

Abstract
PURPOSE
To measure the variation in human cone photoreceptor packing density across the retina both within an individual and between individuals with different refractive errors.
METHODS
A high resolution adaptive optics scanning laser ophthalmoscope was used to image the cones of eleven human eyes. Five emmetropes and six myopes were tested (+0.50D to -7.50D). For each subject we obtained four approximately 10 degree by 1.5 degree strips of cone images. Each strip started at the fovea, and proceeded towards the periphery along the four primary meridians. The position of each cone within the sampling windows was digitized manually by the investigator. From these cone counts, the density of cones was calculated for a set of fixed distances from the fovea for locations throughout the image.
RESULTS
Cone photoreceptor packing density decreased from 27,712 cells/mm2 to 7,070 cells/mm2 from the retinal eccentricity of 0.30mm to 3.40mm along the superior meridian in five emmetropic eyes. Cone photoreceptor packing density in cells/mm2 was significantly lower in myopic eyes than in emmetropic eyes. At a given location, there was considerable individual variation in cone photoreceptor packing density, although more than 20% of the variance could be accounted for by differences in axial length.
CONCLUSIONS
Our results provide a baseline analysis of individual difference in cone photoreceptor packing density in healthy human eyes. As predicted by retinal stretching models, cone photoreceptor packing density is lower in highly myopic eyes than in emmetropic eyes.
Keywords: Adaptive optics, cone photoreceptors, myopia, emmetropia
Introduction
Adaptive optics retinal imaging 1-4, now allows routine imaging of retinal cone photoreceptors in the living human retina. This approach is now providing direct measurements of how cone photoreceptors are affected by diseases such as retinitis pigmentosa and cone-rod dystropy 5, 6 as well as others conditions 7. However, to fully utilize these measurements in the study of disease, we need to have a solid understanding of the variation in cone packing density in normal eyes. Currently, most studies investigating in vivo cone photoreceptor packing have utilized the histological data of Curcio and colleauges 8 to provide a normal control data set. In their studies, they showed that there were individual variations in central cone packing density, but less in the near periphery, a result in agreement with other in vivo techniques 9, 10. In addition, she and collaborators have found some changes in cone numbers with aging 11, 12. Furthermore, the distribution of cones across the retina is uneven, with a slight tendency to show a higher density of cones along the horizontal meridian 8.
While these changes have not been fully investigated in vivo, there is also likely to be sources of individual differences in cone packing density that do not arise from age or disease. One such cause is likely to be eye size. While the cones reach their final number early in development, the eye continues to grow through adolescence and even into adulthood 13-16. Thus, it is expected that if a constant number of cones are distributed across various size eyes, that there could be large individual differences that arise due to eye size. Since eye length varies from 22mm to 28mm in length, we could expect the surface area to vary by 60%. While the details of eye growth are not quite so straight forward 17-21, it is clear that in terms of the number of cones/mm2 of the retina, we expect a significant dependence on eye length, an expectation that is supported by the finding of decreased cone spacing at 2 degrees in the temporal retina for myopic eyes 22. The dependence of cone density on eye length has also been indirectly implicated from psychophysical studies of the effect of myopia on peripheral visual acuity. Axially myopic eyes are larger than emmetropic eyes due to elongation of the vitreous chamber 13-16. In the eyes of axial myopes there is reduced visual acuity and contrast sensitivity 18-21, 23-28. These impairments in visual performance can be attributed to both reduced neural sampling density associated with retinal stretching 18, 20, 28 and reduced optical quality in myopes 29, 30. In the present study, we examined individual differences in cone packing density across the retina for young adults. We also measured the variation in cone packing density across the retina both within an individual and between individuals with different refractive errors and axial lengths.
Methods
Subjects
Eleven healthy subjects (5 males and 6 females; age range 21-31 years, mean 26.6) participated in these measurements. All subjects received a complete eye examination, including a subjective refraction and retinal imaging using a Heidelberg Retina Angiograph (HRA) (Heidelberg Engineering GmbH, Heidelberg, Germany). Exclusion criteria for this study included any retinal pathology or systemic diseases. Spherical equivalent refractive errors ranged from +0.50D to -7.50D (mean = -2.48D, SD = 2.82) with astigmatism less -1.00D when referenced to the spectacle plane. Subjects were classified into three groups based on their refractive error. Group 1 (5 subjects) was emmetropic, with a range of spherical equivalent refractive error from +0.50D to 0.00D (mean = +0.15D, SD = 0.22). Group 2 (4 subjects) consisted of low-to-moderate myopes, with refractive errors ranging from -2.75D to -4.50D (mean -3.63D, SD = 0.78). Group 3 (2 subjects) were high myopes, with refractive errors ranging from -6.00D to -7.50D (mean = -6.75D, SD = 1.06). All subjects had best corrected visual acuity of 20/20 or better. The right eye of each subject was imaged in this experiment. All adaptive optics scanning laser opthalomoscope (AOSLO) imaging sessions were conducted after dilating the pupils with 0.5% tropicamide. The pupil diameter measured under room illumination was equal to or greater than 6mm before starting the experiment. Informed consent was obtained after a full explanation of the procedures and consequences of the study. This study protocol was approved by Indiana University Institutional Review Board and complied with the requirements of the Declaration of Helsinki.
Axial Length Measurements
One drop of 0.5% proparacaine hydrochloride was instilled as a corneal surface anesthetic to facilitate the measurement of axial length by A-scan ultrasonography (A/B-scan, Mentor Advent). Axial length measurements were conducted after AOSLO imaging was completed. A mean of 5 axial length measurements were obtained for each subject. Axial length ranged from 22.80mm to 27.47mm (mean = 24.45, SD = 1.49). The mean axial length and standard deviation were 23.24mm±0.53, 24.72mm±0.36, and 26.98mm±0.70 in Group 1, Group 2, and Group 3 respectively.
Apparatus
The Indiana AOSLO system has been described in detail elsewhere 31. In general, it is composed of three primary optical subsystems of importance to the current study, the wavefront sensor and deformable mirror subsystem, the confocal imaging subsystem, and the wide field imaging subsystem. The light source for high resolution imaging was provided by a super luminescent diode (SLD) which had a 50nm bandwidth centered at 840nm. The adaptive optics control of the system was maintained using a Boston Micromachines deformable mirror (BMC MEMS) and custom software. Wavefront errors were detected with a Shack Hartmann sensor operating at 15 Hz. The imaging raster was provided by an 8 kHz horizontal scanning galvanometer and a programmable vertical scan galvanometer. For these experiments the vertical scan was programmed to provide full frame images of 512 × 512 pixels at a frame rate of 15Hz. Light returning from the retina passes through a confocal aperture optically conjugate to the retinal plane. For this study, the confocal aperture was either 12μm or 24μm relative to the retina depending on which aperture produced the best image quality prior to dilating the subject. Subject’s head movements were stabilized using a wax impression of the mouth and a head rest. Subjects were instructed to fixate an illuminated green LED. Fixation LEDs were arranged in an 8 × 8 array. For a given fixation position, a set of steering mirrors positioned the beam sequentially across the retina with a range of 9 degrees vertically and 10 degrees horizontally.
Procedures
Images were collected as short sections of sequential video frames (30 frames). As soon as a region of retina was imaged, the steering mirrors were moved under experimenter control, such that an adjacent section of overlapping retina was imaged, and the next set of frames was collected. For each subject we obtained four approximately 10 degree sets of cone images. Each set started at the fovea, and proceeded towards the periphery along either the horizontal meridian (both nasal and temporal) or the vertical meridian (both superior and inferior). Typically a single acquisition of 30 frames was sufficient to collect a data set suitable for cone quantification. To relate the separate video frames to each other, it was necessary to align them properly. Image montaging was performed offline by finding corresponding points between the selected images using cross correlation in MATLAB (Mathworks, Inc., Natick, Massachusetts). Each image in the montage was generated from a single frame without averaging. All montages locations were verified by comparing to the subject’s HRA fundus images. A comparison of HRA and cone image strips is shown in Fig. 1a & b.
Fig. 1.

a) HRA fundus image of subject 01. The box indicates the region for high resolution imaging in the superior field. b). Montage of a series of high resolution images reaching from the fovea (lower right) to the superior periphery. c) Same region of retina, indicating regions for cone counting, with constant distances from the fovea indicated by concentric white circles. d) One of the regions of interest expanded to show individual cones as well as the distance bins.
Measuring the cone packing density
A set of 150×150 pixel sampling windows at different retinal eccentricities were located on the montages (Fig. 1c). These sampling windows were chosen such that an apparently complete set of retinal cones was optically resolved. That is, none were obscured by blood vessels. The position of each cone within the sampling windows was then digitized manually by the investigator in MATLAB by clicking a mouse on the cone, and marking its location on the image to ensure that no cone was counted twice, and that none were excluded. From these cone counts, the density of cones was calculated for a set of fixed distances from the fovea for locations throughout the montage.
Computing the retinal magnification factor
Differences in optical magnification, and thus retinal image size, created by different axial lengths and different correction lenses cause the relation between pixel coordinates and retinal dimensions (expressed in mm) measured by an AOSLO to vary. For a given visual angle, retinal dimensions (mm) will be larger in a myopic retina than in an emmetropic retina due to the longer axial length. This larger retinal dimension affects the calculation of cone packing density in cells/mm2. For this reason we converted pixels to retinal position using the measured axial length for each eye by computing a retinal magnification factor (RMF) that converts from external angles to retinal dimensions based on the axial length of the individual eyes being imaged and the optics of the system. In our system we corrected ametropia using both a built-in Badal optometer (which because it is telecentric does not alter the angular magnification with changes in defocus) and trial lenses (which in our system do change the angular magnification). When trial lenses were used, they were placed in the AOSLO system at 15mm from the pupil plane. To correct for the effect of the trial lens, we used a standard reduced eye model to calculate the magnification factor. Individual RMF was computed using ZEMAX (ZEMAX Development Corporation, Washington). The RMF was estimated for each eye based on the correction lenses added to the system and the subject’s axial length. To double check the ZEMAX computed relative RMF, we compared the RMF computed from ZEMAX with the RMF calculated by the ratio of pixel distance between two cones of the same subject when wearing contact lenses and when using trial lenses. The test subject had a refractive error of -4.50D and an axial length of 25.07mm. We measured a 2% difference between the corrected intercone distances for the two imaging conditions when the images were corrected according to our ZEMAX model (Fig. 2). A similar calibration was performed on a model eye, where the axial length (the distance from the lens to a target) was varied, and the system was used to optically correct the induced defocus. Results were similar.
Fig. 2.

AOSLO images of a -4.50D myope. Single frame AOSLO images a) with spectacle lens correction. b) With contact lens correction. Pixel distance is determined by the distance between two distinctive cones (circles). When corrected using our optical model, the results were within 2% of each other, despite the relatively large magnification change due to the use of trial lenses in one of the conditions.
Results
Five emmetropes, four low-to-moderate myopes and two high myopes were tested. The relationship between spherical equivalent refractive error and axial length is shown in Fig 3. As expected, significant correlation was found between the axial length and refractive error (r=-0.92, p<0.0001). As expected from the resolution of our system (2.8 microns for a diffraction limited emmetropic eye), we were unable to image the central foveal cones, but we were able to count cones from approximately 1 degree to 10 degrees. Fig. 4 shows a temporal montage for subject 10 (axial length = 23.71mm) ranging from 0 degrees retinal eccentricity to 10 degrees. The squares indicate regions that are shown in high resolution in the lower panel.
Fig. 3.
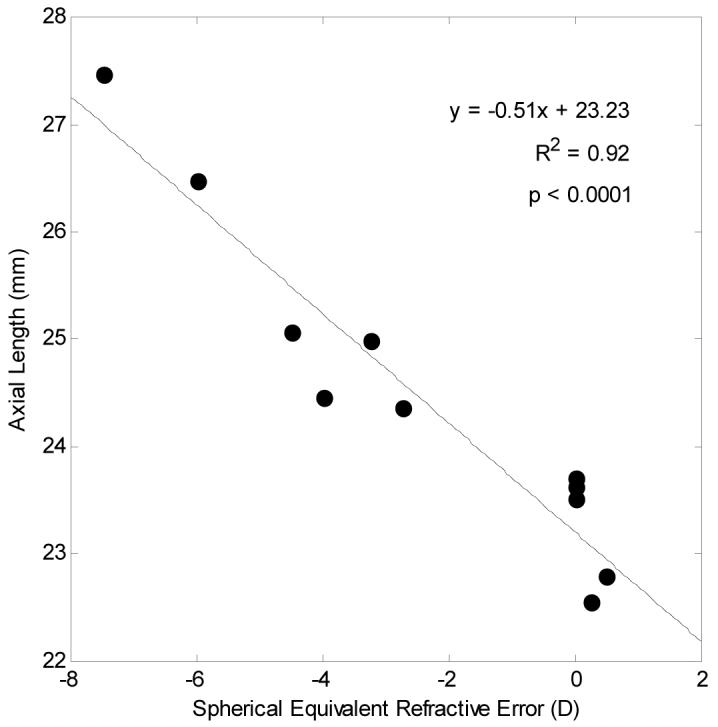
Relationship between axial length (mm) and spherical equivalent refractive error (D) in subjects’ right eyes. Linear regression to the data is showed by the solid line.
Fig. 4.

Upper panel: Temporal montage from subject 10, an emmetrope with an axial length of 23.71mm. This montage spans approximately 10 degrees from the fovea (* lower right corner) to the temporal retina (left side of image). The scale bar represents 200μm. Lower Panels: Averaged subregions matching the square region indicated in the upper panel. Cone photoreceptors have been resolved at retinal locations from approximately 1 degree to 10 degrees. Scale bar represents 50μm.
Cone packing density in emmetropic eyes
Variation of cone packing density with retinal eccentricity along the superior meridian in five emmetropes is shown in Fig. 5. The y axis in the graph indicates the cone packing density in 1,000 cells/mm2. According to our data, cone packing density decreases from 27,712 cells/mm2 to 7,070 cells/mm2 from the retinal eccentricity of 0.30mm to 3.40mm along the superior meridian. The dashed curve in Fig. 5 is the result of a fit of a power law relation between retinal eccentricity and cone packing density. The solid curve is the mean cone packing density from 7 human eyes from a previous anatomical study on human cone topography 8. The power law fit of the cone packing density in all four meridians are shown with heavy solid curves in Fig. 7. The cone packing density data for the emmetropic eyes are in reasonable agreement with the data reported by Curcio and colleagues 8 for postmortem measurements.
Fig. 5.

Variation of cone packing density with retinal eccentricity along the superior meridian for five emmetropic subjects. Cone packing density decreases from 27,712 cells/mm2 to 7,070 cells/mm2 from the retinal eccentricity of 0.30mm to 3.40mm along the superior meridian. The solid curve indicates the result from the study of Curcio and colleagues 8. The dashed curve indicates a power law fit for the five emmetropes in Group 1.
Fig. 7.

Comparisons of cone packing densities obtained from the study of Curico and colleagues 8 (solid curves) and data from the emmetropes in the present study (heavy solid curves), low-to-moderate myopes (dashed curves), and high myopes (dotted curves) in each of the four meridians. The data from the present study were fit using power law fitting, and the lines are based on this fitting.
Variation of cone packing density in 3 groups of refractive error
Fig. 6 compares cone packing densities obtained from the three groups of subjects for four meridians. There was considerable variability among the six tested myopes. As with the emmetropes, a power law fit was used to estimate the overall trend of cone packing density change as a function of retinal eccentricity in each subject group. The results of these fits for the three subject groups are shown in Fig. 7. Table 1 shows the mean cone packing density for each subject group for two retinal locations and for each of the four meridians. The retinal regions considered for this analysis were a region about 3 degrees from the fovea, and a region about 6 degrees from the fovea (area 1 = 0.9-1.0mm and area 2 = 1.8-2.0mm retinal eccentricity). Due to the steepness of the cone packing density gradient near the fovea, we did not include regions closer to the fovea than 900 um for the summary comparison, since the precise area sampled in a single subject due to blood vessel location could produce a significant bias in the results. Cone packing density was higher in Group 1 than the other two groups in all meridians and retinal areas except for area 2 in the nasal meridian. For all groups the cone packing density was the lowest in the inferior meridian. To test the significance of the interactions between refractive error group, meridian, and eccentricity, a three way ANOVA was performed (SPSS 15.0). The ANOVA results are presented in Table 2. The significance of the mean differences was computed by performing two-way comparisons between groups for each of the retinal eccentricities. Table 3 presents the results for a pairwise comparison of the means across area 1 and area 2, and shows that cone packing densities were significantly higher for refractive error Group 1 than for refractive error Groups 2 and 3.
Fig. 6.


Comparison of cone packing density for 3 groups of subjects differing in refractive error at four meridians. Upper right panels: the data are for measurements along the superior meridian. Filled symbols are data from five emmetropes, plus symbols are data from four low-to-moderate myopes, and asterix symbols are from two high myopes. Anatomical values are based on published cone packing density in human retina from Curcio and colleagues 8 (Solid curve). Other panels: Comparison of cone packing density for 3 groups of subjects for the inferior, nasal, and temporal meridians.
Table 1.
Mean cone packing densities (x1000 cells/mm2) obtained from two retinal areas (area 1 = 0.9-1.0mm and area 2 = 1.8-2.0mm) in four meridians in 3 groups of refractive error
| Superior (Mean±SD) | Inferior (Mean±SD) | Nasal (Mean±SD) | Temporal (Mean±SD) | ||
|---|---|---|---|---|---|
| Area 1 (0.9-1.0mm) | Average | ||||
| Emmetrope | 16.868±1.76 | 14.007±2.03 | 13.994±1.04 | 16.497±3.17 | 15.341±0.29 |
| Low-moderate myope | 15.473±1.64 | 9.891±1.44 | 15.331±0.93 | 13.681±2.73 | 13.594±0.32 |
| High myope | 12.258±1.20 | 10.837±0.20 | 15.640±0.91 | 12.864±0.84 | 12.899±0.43 |
| Average | 15.309±2.44 | 11.773±2.52 | 14.888±1.16 | 14.991±3.09 | |
| Area 2 (1.8-2.0mm) | Average | ||||
| Emmetrope | 9.942±1.29 | 8.952±0.38 | 10.212±1.14 | 11.372±1.06 | 10.119±0.28 |
| Low-moderate myope | 9.179±1.52 | 8.201±0.89 | 9.099±3.11 | 10.887±1.24 | 9.343±2.56 |
| High myope | 8.282±0.81 | 6.759±0.60 | 8.019±1.33 | 8.626±1.05 | 7.921±0.44 |
| Average | 9.419±1.41 | 8.211±0.97 | 9.251±2.22 | 10.963±1.34 | |
Table 2.
Main effects and interaction effects of refractive group, meridian, and retinal eccentricity on cone packing density. P values < 0.05 are regarded as statistically significant
| Comparison by 3-way ANOVA | P value |
|---|---|
| Main effect of refractive group | <0.0001 |
| Main effect of meridian | <0.0001 |
| Main effect of retinal eccentricity | <0.0001 |
| Interaction effect of refractive group * meridian | 0.008 |
| Interaction effect of refractive group * retinal eccentricity | 0.228 |
| Interaction effect of meridian * retinal eccentricity | 0.007 |
| Interaction among refractive group*meridian*retinal eccentricity | 0.001 |
Table 3.
Multiple comparisons of cone packing densities for all 3 refractive error groups. The mean difference between emmetrope and the other two groups is significant, but the means of low-moderate myope and high myope were not significantly different. P values < 0.05 are regarded as statistically significant
| Group | Mean Difference ± SD | P value | |
|---|---|---|---|
| Emmetrope | Low-moderate Myope | 1.673±0.27 | <0.001 |
| High Myope | 2.313±0.33 | <0.001 | |
| Low-moderate Myope | High Myope | 0.640±0.35 | 0.156 |
Variation of cone packing density with different axial lengths and refractive errors
Table 4 summarizes the regression slopes of estimated cone density in four meridians as a function of axial length and refractive error. Fig. 8 presents the variation of cone packing density (cells/mm2) with axial lengths and refractive error. The estimated cone packing densities at the retinal eccentricity of 1mm, 1.5mm, and 2mm were computed from the power law fits for each subject. Linear regressions between cone packing density estimates and axial length and refractive error are shown by the solid lines. All regression slopes are statistically significant with p<0.05. Fig. 9 shows that in terms of the estimated cone packing densities expressed in angular units (cells/deg2) there is little variation with axial length and refractive error at the retinal eccentricities of 3 degrees, 5 degrees, and 7 degrees.
Table 4.
Regression slopes for cone density in cells/mm2 and cells/deg2 in four meridians as a function of axial length (AL) and refractive error (Rx). * indicates regression slope was statistically significant with p<0.05
| Cone density (cells/mm2) Regression slope at retinal eccentricity | Cone density (cells/deg2) Regression slope at retinal eccentricity | ||||||
|---|---|---|---|---|---|---|---|
| 1mm | 1.5mm | 2mm | 3deg | 5deg | 7deg | ||
| Superior | AL | -0.59* | -0.47* | -0.40* | 0.04 | 0.02 | 0.02 |
| Rx | 0.32* | 0.30* | 0.27* | -0.02 | -0.01 | -0.003 | |
| Inferior | AL | -1.41* | -0.88* | -0.62* | -0.04 | -0.02 | -0.003 |
| Rx | 0.73* | 0.48* | 0.34* | 0.03 | 0.01 | 0.004 | |
| Nasal | AL | -0.16 | -0.30 | -0.36 | 0.10* | 0.05 | 0.03 |
| Rx | 0.06 | 0.14 | 0.18 | -0.05* | -0.03 | -0.02 | |
| Temporal | AL | -1.38* | -0.51 | -0.21 | -0.06 | 0.03 | 0.05 |
| Rx | 0.71* | 0.30 | 0.17 | 0.03 | -0.01 | -0.02 | |
Fig. 8.

Variation of cone packing density (cells/mm2) with axial length (upper row) and refractive error (lower row) at 3 retinal eccentricities on superior meridian. Circle symbols indicate the estimation of cone packing density from individual eyes. Linear regressions to the data are showed by the solid lines. All regression slopes are statistically significant with p<0.05.
Fig. 9.

Variation of cone packing density (cells/deg2) with axial length (upper row) and refractive error (lower row) at 3 retinal eccentricities along the superior meridian. Circle symbols indicate the estimation of cone packing density from individual eyes. The results of a linear regressions to the data are displayed as the solid lines and the equation. All regression slopes are statistically non-significant with p> 0.05.
Discussion
We have been able to use the AOSLO to make systematic measurements of cone packing density across the retina. In the present study, data from five emmetropes and six myopes were obtained. We find that in the emmetropes the cone packing density expressed in cells/mm2 is in overall agreement with the data reported by Curcio et al.8. Other anatomical studies have found similar results 32-34, although perhaps with lower cell counts in the parafoveal retina, but it is not clear if these represent individual differences or biases due to preparation. Curcio and colleagues presented the most detailed analysis of cone distributions. They find that cone packing density at 1mm superior retina was ∼16,000 cells/mm2, corresponding to a cone spacing of 7.4μm. Similarly, we found that cone packing density at 1mm eccentricity in the superior retina was 15,121 cells/mm2 in five emmetropic eyes, this corresponds to a cone spacing of 7.6μm. In fact, we did find considerable individual differences in cone packing density. Some subjects had cone packing density lower than those reported by the study of Curcio and colleagues. When we look at the results for our low-to-moderate and high myopes, our data are much lower than the data of Curcio and colleagues. However, the decrease in density with increasing retinal eccentricity is similar to all studies.
One of the goals of the current study was to provide a basis of comparison for studies of the effect of age and retinal pathology on cone packing density. This comparison requires careful optical modeling and determination of the exact positioning of the correction optics. For this reason we also compared differences between eyes based on simple angular density of the cones, that is using the visual angle rather than retinal size, which requires correcting the data for the axial length of the eye. As seen in Fig. 9, the cone packing density is much more constant with axial length when expressed in cells/deg2 of visual subtense than when expressed as cells/mm2 of retinal surface area (Fig. 8). This means that at least over this range of axial lengths, the data can be directly compared to a single set of subjects, without the need to measure and correct for axial length of the eye. Since in many hereditary retinal degenerations, eye size can be quite large, this result is reassuring. However, it is not known that the eye growth in hereditary retinal pathology, or even in very high axial myopia follows the same pattern of eye growth.
The importance for eye growth can be explained by noting that the current data provide information on how differences in axial length, and presumably the subsequent retinal stretching and cone remodeling, varied at different retinal eccentricities and meridians. It is well established that the increase in the eye’s axial length is greater than the increase in equatorial diameter as myopia develops 17 35-37, but it is less clear whether the increase in axial length is distributed uniformly across the posterior pole, or locally. One extreme example of a local growth would be if all the increase in axial length occurred as axial growth at the equator. We consider that it is unlikely that the cones are freely sliding across the entire surface of the retina during eye growth, since the vasculature is thought to constrain cone migration 38, 39, and because of this the cone packing density can be used to examine whether eye growth is causing local anisotropies or simply an uniform decrease in cone packing density. That is, a general expansion of the posterior pole should produce uniform changes in cone density, whereas a purely axial elongation at the equator should produce low cone densities at the equator, but normal everywhere else. While we cannot measure cone density at the equator, our data do provide information on cone packing density within a few millimeters of the fovea. If the posterior pole grows uniformly, we would expect that between an eye with an axial length of 22 mm and one with an axial length of 28 mm, there would be a change of about 60% everywhere. This is not the case. At 1mm in the superior retina, we find that the average cone packing density for an eye with an axial length of 28mm is roughly 77% that of an eye with an axial length of 22mm. Similarly, for data at 2mm superior retina, the average cone packing density decreases to 75% with the same change in axial length. In contrast, for cone packing density at 1mm nasal retina, the average cone packing density for an eye with an axial length of 28mm is roughly 93% that of an eye with an axial length of 22mm. For data at 2mm nasal retina, cone packing density decrease to about 79% with the same change in axial length. Therefore, our data are not consistent with a model of eye growth that occurs uniformly, with a consequent uniform decrease in cone packing density. Similarly we can rule out the equatorial stretching model, which predicts similar cone packing densities in cells/mm2 at the posterior pole for emmetropic and myopic eyes. Therefore, our data are also inconsistent with the hypothesis that the growth of the eye arises entirely from equatorial elongation. Thus, it is possible that that the elongation of the eye is differentially distributed across the posterior pole. This type of growth would still result in the well established prolate shape with increased retinal surface area. However, the local increase in surface area would represent a complex combination of contributions. We cannot fully test this possibility, due to the limited range of retinal eccentricity tested in the present study, but there do appear to be local variations, with the smallest dependence on axial length occurring for the nasal retina. It is also important to note that this growth pattern may not be the same in extreme myopia or in hereditary retinal degeneration, but it does suggest that a simple comparison of cone packing density based on the angular dimensions would be acceptable for determining normality of the cone mosaic.
These data are also related to studies which have examined the visual capabilities of myopes. According to sampling theory, retinal resolution capability of the cone mosaic can be computed based on the spatial density of the retinal mosaic 40. There is a large body of experimental evidence in support of this theory, with previous studies showing that retinal resolution acuity in cycles/mm is reduced with increasing myopia 18-20, 28. This result has been interpreted as evidence for retinal stretching of the myopic eye 19-21, 41. One possible explanation linking structure and function in myopic eyes is that retinal stretching caused by expansion of the posterior pole may lead to a reduction in neural sampling density 19-21, 41. That is, a reduction in cone packing density has been interpreted as evidence for a visual acuity (cycles/mm) reduction in myopia which is most likely associated with retinal stretching of the myopic eye 19-21, 41. Our data allow us to compare actual cone measurements to data on acuity that have been published. Such a comparison is shown to the results of Coletta and Watson 20. This study investigated retinal resolution acuity at different retinal eccentricities as a function of refractive error using an interferometer 20. Figure 10 shows, retinal resolution acuity measured at 4 degree and 10 degree retinal eccentricities in the temporal retina from the study of Coletta & Watson 20 compared to calculations based on the data from the present study. Due to the resolution limit of our system, we are not able to compare the foveal resolution acuity with this study. In the present study, the estimated cone packing densities at 4 degree and 10 degree retinal eccentricities were computed from the power law fits in 11 subjects. Approximating the actual cone packing arrangement with hexagonally packed samples 42, 43, the cone spacing (S) in microns is calculated as equation 1: , where cone spacing (S) is defined as the center to center spacing of cones in microns and D is the cone density in cells/mm2. The Nyquist limit of resolution (Vn) in cyc/mm is then calculated as equation 2: , where S is the cone spacing in micron obtained from equation (1). The results of these calculations for our study at 4 degree and 10 degree retinal eccentricities in the temporal retinal appear in Fig. 10 as the filled and open circles respectively. The solid lines in Fig. 10, are results of linear regressions for 4 degree and 10 degree retinal eccentricities from the study of Coletta & Watson 20. The dashed lines are the linear regressions to the predicted retinal resolution acuity from the present study. Coletta & Watson reported that the retinal resolution acuity at 4 degrees temporal retina was 79 cyc/mm in an emmetropic eye. In contrast, our data indicates that the predicted retinal resolution acuity at 4 degrees temporal retina should be 77 cyc/mm in an emmetropic eye. According to the regression slopes in Fig. 10, the reduction in the rate of retinal resolution acuity with refractive error at retinal eccentricity of 4 degrees are 1.34 cyc/mm and 2.00 cyc/mm per diopter in the study of Coletta & Watson 20 and the present study respectively. Thus, our data show a steeper decline in cone packing density then would be inferred from their data but this difference is small. Looking at the data for 10 degrees, there is an offset between their measurements and our prediction, probably based on the well documented finding that retinal resolution acuity is limited by the P-type retinal ganglion cell density not cone packing density beyond 10-15 degree retinal eccentricity 44-46. Here however we find that the variation with refractive error is similar. Thus, both data sets indicate that myopic eyes have lower retinal resolution acuity than emmetropic eyes. Therefore, our study provides further evidence in support the hypothesis that retinal stretching in myopic eyes reduces retinal sampling density.
Fig. 10.

Relationship between retinal resolution acuity and spherical equivalent refractive error. The y axis in the graph indicates the retinal resolution acuity in cyc/mm. Filled and open circles indicate the computed temporal retinal resolution acuity at 4 degree and 10 degree retinal eccentricities respectively. The dashed lines are the linear fits to these data at 4 degrees (y1: heavy dashed line) and 10 degrees (y3: light dashed line). The solid lines are the linear regression of retinal resolution acuity at 4 degrees (y2: heavy solid line) and 10 degrees (y4: light solid line) from the study of Coletta & Watson 20.
Conclusions
In summary, our results provide a baseline analysis of cone packing density in vivo in relatively young, healthy human eyes. This baseline data is useful for detecting and monitoring the loss of cone photoreceptor in retinal diseases. This study has also demonstrated that in terms of cones/mm2, there is a systematic decrease in cone packing density with increasing axial length. Thus, as predicted by retinal stretching, cone packing density is lower in highly myopic eyes than in emmetropic eyes. Our emmetropic eyes have similar cone packing density to data reported by Curcio, but our myopic eyes have lower packing densities. We find a similar variation in cone packing density with changes in retinal eccentricity and meridian to those reported by Curcio with the exception of the nasal meridian, where we find somewhat lower cone packing densities. While our data do not have sufficient power to test differences between different degrees of refractive error, they do suggest that such changes would be present, as expected from the need to distribute a constant number of cones over a larger retinal surface area.
Acknowledgments
The authors thank Arthur Bradley for his helpful discussions. This work was supported by NIH Grants R01-EY14375 and R01-EY04395.
This work was supported by NIH Grants R01-EY14375 and R01-EY04395.
References
- 1.Liang J, Williams DR, Miller DT. Supernormal vision and high-resolution retinal imaging through adaptive optics. J Opt Soc Am A Opt Image Sci Vis. 1997;(14):2884–2892. doi: 10.1364/josaa.14.002884. [DOI] [PubMed] [Google Scholar]
- 2.Roorda A, Romero-Borja F, Donnelly WJ, Queener H, Hebert TJ, Campbell MCW. Adaptive optics scanning laser ophthalmoscopy. Optics Express. 2002;(10):405–412. doi: 10.1364/oe.10.000405. [DOI] [PubMed] [Google Scholar]
- 3.Roorda A. Adaptive optics ophthalmoscopy. J Refract Surg. 2000;(16):S602–607. doi: 10.3928/1081-597X-20000901-23. [DOI] [PubMed] [Google Scholar]
- 4.Pircher M, Zawadzki RJ, Evans JW, Werner JS, Hitzenberger CK. Simultaneous imaging of human cone mosaic with adaptive optics enhanced scanning laser ophthalmoscopy and high-speed transversal scanning optical coherence tomography. Opt Lett. 2008;(33):22–24. doi: 10.1364/ol.33.000022. [DOI] [PMC free article] [PubMed] [Google Scholar]
- 5.Duncan JL, Zhang Y, Gandhi J, et al. High-resolution imaging with adaptive optics in patients with inherited retinal degeneration. Invest Ophthalmol Vis Sci. 2007;(48):3283–3291. doi: 10.1167/iovs.06-1422. [DOI] [PubMed] [Google Scholar]
- 6.Wolfing JI, Chung M, Carroll J, Roorda A, Williams DR. High-resolution retinal imaging of cone-rod dystrophy. Ophthalmology. 2006;(113):1014–1019. doi: 10.1016/j.ophtha.2006.01.056. [DOI] [PubMed] [Google Scholar]
- 7.Carroll J, Neitz M, Hofer H, Neitz J, Williams DR. Functional photoreceptor loss revealed with adaptive optics: an alternate cause of color blindness. Proc Natl Acad Sci U S A. 2004;(101):8461–8466. doi: 10.1073/pnas.0401440101. [DOI] [PMC free article] [PubMed] [Google Scholar]
- 8.Curcio CA, Sloan KR, Kalina RE, Hendrickson AE. Human photoreceptor topography. J Comp Neurol. 1990;(292):497–523. doi: 10.1002/cne.902920402. [DOI] [PubMed] [Google Scholar]
- 9.Marcos S, Burns SA. Cone spacing and waveguide properties from cone directionality measurements. J Opt Soc Am A Opt Image Sci Vis. 1999;(16):995–1004. doi: 10.1364/josaa.16.000995. [DOI] [PMC free article] [PubMed] [Google Scholar]
- 10.Williams DR. Topography of the foveal cone mosaic in the living human eye. Vision Res. 1988;(28):433–454. doi: 10.1016/0042-6989(88)90185-x. [DOI] [PubMed] [Google Scholar]
- 11.Curcio CA, Owsley C, Jackson GR. Spare the rods, save the cones in aging and age-related maculopathy. Invest Ophthalmol Vis Sci. 2000;(41):2015–2018. [PubMed] [Google Scholar]
- 12.Jackson GR, Owsley C, Curcio CA. Photoreceptor degeneration and dysfunction in aging and age-related maculopathy. Ageing Res Rev. 2002;(1):381–396. doi: 10.1016/s1568-1637(02)00007-7. [DOI] [PubMed] [Google Scholar]
- 13.Bullimore MA, Gilmartin B, Royston JM. Steady-state accommodation and ocular biometry in late-onset myopia. Doc Ophthalmol. 1992;(80):143–155. doi: 10.1007/BF00161240. [DOI] [PubMed] [Google Scholar]
- 14.McBrien NA, Millodot M. A biometric investigation of late onset myopic eyes. Acta Ophthalmol. 1987;(65):461–468. doi: 10.1111/j.1755-3768.1987.tb07024.x. [DOI] [PubMed] [Google Scholar]
- 15.Grosvenor T, Scott R. Three-year changes in refraction and its components in youth-onset and early adult-onset myopia. Optom Vis Sci. 1993;(70):677–683. doi: 10.1097/00006324-199308000-00017. [DOI] [PubMed] [Google Scholar]
- 16.Grosvenor T, Scott R. Role of the axial length/corneal radius ratio in determining the refractive state of the eye. Optom Vis Sci. 1994;(71):573–579. doi: 10.1097/00006324-199409000-00005. [DOI] [PubMed] [Google Scholar]
- 17.Atchison DA, Jones CE, Schmid KL, et al. Eye shape in emmetropia and myopia. Invest Ophthalmol Vis Sci. 2004;(45):3380–3386. doi: 10.1167/iovs.04-0292. [DOI] [PubMed] [Google Scholar]
- 18.Atchison DA, Schmid KL, Pritchard N. Neural and optical limits to visual performance in myopia. Vision Res. 2006;(46):3707–3722. doi: 10.1016/j.visres.2006.05.005. [DOI] [PubMed] [Google Scholar]
- 19.Chui TY, Yap MK, Chan HH, Thibos LN. Retinal stretching limits peripheral visual acuity in myopia. Vision Res. 2005;(45):593–605. doi: 10.1016/j.visres.2004.09.016. [DOI] [PubMed] [Google Scholar]
- 20.Coletta NJ, Watson T. Effect of myopia on visual acuity measured with laser interference fringes. Vision Res. 2006;(46):636–651. doi: 10.1016/j.visres.2005.05.025. [DOI] [PubMed] [Google Scholar]
- 21.Strang NC, Winn B, Bradley A. The role of neural and optical factors in limiting visual resolution in myopia. Vision Res. 1998;(38):1713–1721. doi: 10.1016/s0042-6989(97)00303-9. [DOI] [PubMed] [Google Scholar]
- 22.Kitaguchi Y, Bessho K, Yamaguchi T, Nakazawa N, Mihashi T, Fujikado T. In vivo measurements of cone photoreceptor spacing in myopic eyes from images obtained by an adaptive optics fundus camera. Jpn J Ophthalmol. 2007;(51):456–461. doi: 10.1007/s10384-007-0477-7. [DOI] [PubMed] [Google Scholar]
- 23.Collins JW, Carney LG. Visual performance in high myopia. Curr Eye Res. 1990;(9):217–223. doi: 10.3109/02713689009044516. [DOI] [PubMed] [Google Scholar]
- 24.Subbaram MV, Bullimore MA. Visual acuity and the accuracy of the accommodative response. Ophthalmic Physiol Opt. 2002;(22):312–318. doi: 10.1046/j.1475-1313.2002.00037.x. [DOI] [PubMed] [Google Scholar]
- 25.Applegate RA. Visual acuity and aberrations in myopia. Invest Ophthalmol Vis Sci. 1991;(32 Suppl):2657. [Google Scholar]
- 26.Fiorentini A, Maffei L. Spatial contrast sensitivity of myopic subjects. Vision Res. 1976;(16):437–438. doi: 10.1016/0042-6989(76)90214-5. [DOI] [PubMed] [Google Scholar]
- 27.Jaworski A, Gentle A, Zele AJ, Vingrys AJ, McBrien NA. Altered visual sensitivity in axial high myopia: a local postreceptoral phenomenon? Invest Ophthalmol Vis Sci. 2006;(47):3695–3702. doi: 10.1167/iovs.05-1569. [DOI] [PubMed] [Google Scholar]
- 28.Rossi EA, Weiser P, Tarrant J, Roorda A. Visual performance in emmetropia and low myopia after correction of high-order aberrations. J Vis. 2007;(7):14. doi: 10.1167/7.8.14. [DOI] [PubMed] [Google Scholar]
- 29.Paquin MP, Hamam H, Simonet P. Objective measurement of optical aberrations in myopic eyes. Optom Vis Sci. 2002;(79):285–291. doi: 10.1097/00006324-200205000-00007. [DOI] [PubMed] [Google Scholar]
- 30.Salmon TO, West RW, Gasser W, Kenmore T. Measurement of refractive errors in young myopes using the COAS Shack-Hartmann aberrometer. Optom Vis Sci. 2003;(80):6–14. doi: 10.1097/00006324-200301000-00003. [DOI] [PubMed] [Google Scholar]
- 31.Burns SA, Tumbar R, Elsner AE, Ferguson D, Hammer DX. Large-field-of-view, modular, stabilized, adaptive-optics-based scanning laser ophthalmoscope. J Opt Soc Am A Opt Image Sci Vis. 2007;(24):1313–1326. doi: 10.1364/josaa.24.001313. [DOI] [PMC free article] [PubMed] [Google Scholar]
- 32.Jonas JB, Schneider U, Naumann GO. Count and density of human retinal photoreceptors. Graefes Arch Clin Exp Ophthalmol. 1992;(230):505–510. doi: 10.1007/BF00181769. [DOI] [PubMed] [Google Scholar]
- 33.Sjostrand J, Conradi N, Klaren L. How many ganglion cells are there to a foveal cone? A stereologic analysis of the quantitative relationship between cone and ganglion cells in one normal human fovea. Graefes Arch Clin Exp Ophthalmol. 1994;(232):432–437. doi: 10.1007/BF00186586. [DOI] [PubMed] [Google Scholar]
- 34.Sjostrand J, Olsson V, Popovic Z, Conradi N. Quantitative estimations of foveal and extra-foveal retinal circuitry in humans. Vision Res. 1999;(39):2987–2998. doi: 10.1016/s0042-6989(99)00030-9. [DOI] [PubMed] [Google Scholar]
- 35.Meyer-Schwickerath G, Gerke E. Biometric studies of the eyeball and retinal detachment. Br J Ophthalmol. 1984;(68):29–31. doi: 10.1136/bjo.68.1.29. [DOI] [PMC free article] [PubMed] [Google Scholar]
- 36.Curtin BJ, Karlin DB. Axial length measurements and fundus changes of the myopic eye. Am J Ophthalmol. 1971;(1):42–53. doi: 10.1016/0002-9394(71)91092-0. [DOI] [PubMed] [Google Scholar]
- 37.Logan NS, Gilmartin B, Wildsoet CF, Dunne MC. Posterior retinal contour in adult human anisomyopia. Invest Ophthalmol Vis Sci. 2004;(45):2152–2162. doi: 10.1167/iovs.03-0875. [DOI] [PubMed] [Google Scholar]
- 38.Springer AD, Hendrickson AE. Development of the primate area of high acuity, 3: temporal relationships between pit formation, retinal elongation and cone packing. Vis Neurosci. 2005;(22):171–185. doi: 10.1017/S095252380522206X. [DOI] [PubMed] [Google Scholar]
- 39.Springer AD, Hendrickson AE. Development of the primate area of high acuity. 1. Use of finite element analysis models to identify mechanical variables affecting pit formation. Vis Neurosci. 2004;(21):53–62. doi: 10.1017/s0952523804041057. [DOI] [PubMed] [Google Scholar]
- 40.Helmholtz HV. Treatise On Physiological Optics. Vol. 2. Optical Society of America; Rochester, NY: 1924. pp. 1–46. [Google Scholar]
- 41.Bradley A, Rabin J, Freeman RD. Nonoptical determinants of aniseikonia. Invest Ophthalmol Vis Sci. 1983;(24):507–512. [PubMed] [Google Scholar]
- 42.Snyder AW, Miller WH. Photoreceptor diameter and spacing for highest resolving power. J Opt Soc Am. 1977;(67):696–698. doi: 10.1364/josa.67.000696. [DOI] [PubMed] [Google Scholar]
- 43.Hirsch J, Miller WH. Does cone positional disorder limit resolution? J Opt Soc Am A. 1987;(4):1481–1492. doi: 10.1364/josaa.4.001481. [DOI] [PubMed] [Google Scholar]
- 44.Anderson RS, Wilkinson MO, Thibos LN. Psychophysical localization of the human visual streak. Optom Vis Sci. 1992;(69):171–174. doi: 10.1097/00006324-199203000-00001. [DOI] [PubMed] [Google Scholar]
- 45.Anderson SJ, Mullen KT, Hess RF. Human peripheral spatial resolution for achromatic and chromatic stimuli: limits imposed by optical and retinal factors. J Physiol. 1991;(442):47–64. doi: 10.1113/jphysiol.1991.sp018781. [DOI] [PMC free article] [PubMed] [Google Scholar]
- 46.Thibos LN, Cheney FE, Walsh DJ. Retinal limits to the detection and resolution of gratings. J Opt Soc Am [A] 1987;(4):1524–1529. doi: 10.1364/josaa.4.001524. [DOI] [PubMed] [Google Scholar]