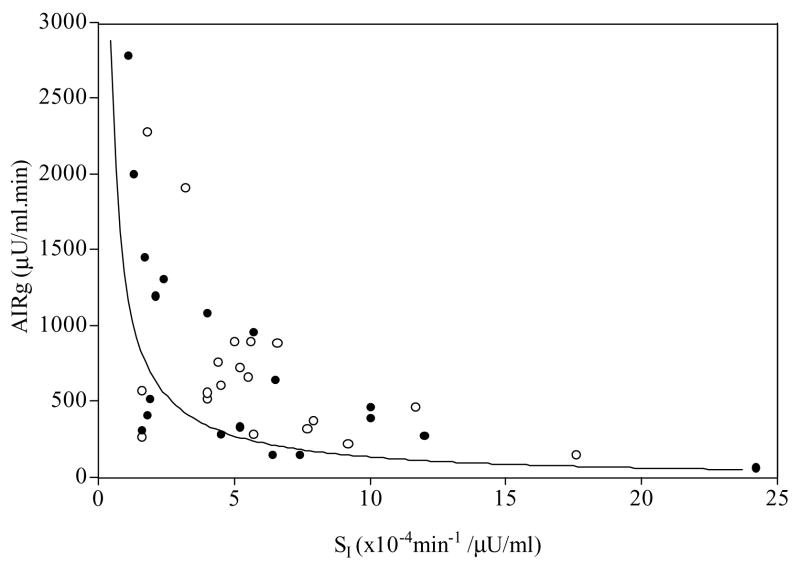
Figure 1.
The relationship between insulin secretion and insulin sensitivity in the brothers (●) and control men (○). The line depicts 50th percentile for this relationship from a large study (n=93) of normal men and women, where SI × AIRg = 0.02237 (48). Values below the 50th percentile are associated with an increased risk for type 2 DM (23).

