

Abstract
Background and Aims
Wood density is a key variable for understanding life history strategies in tropical trees. Differences in wood density and its radial variation were related to the shade-tolerance of six canopy tree species in seasonally dry tropical forest in Thailand. In addition, using tree ring measurements, the influence of tree size, age and annual increment on radial density gradients was analysed.
Methods
Wood density was determined from tree cores using X-ray densitometry. X-ray films were digitized and images were measured, resulting in a continuous density profile for each sample. Mixed models were then developed to analyse differences in average wood density and in radial gradients in density among the six tree species, as well as the effects of tree age, size and annual increment on radial increases in Melia azedarach.
Key Results
Average wood density generally reflected differences in shade-tolerance, varying by nearly a factor of two. Radial gradients occurred in all species, ranging from an increase of (approx. 70%) in the shade-intolerant Melia azedarach to a decrease of approx. 13% in the shade-tolerant Neolitsea obtusifolia, but the slopes of radial gradients were generally unrelated to shade-tolerance. For Melia azedarach, radial increases were most-parsimoniously explained by log-transformed tree age and annual increment rather than by tree size.
Conclusions
The results indicate that average wood density generally reflects differences in shade-tolerance in seasonally dry tropical forests; however, inferences based on wood density alone are potentially misleading for species with complex life histories. In addition, the findings suggest that a ‘whole-tree’ view of life history and biomechanics is important for understanding patterns of radial variation in wood density. Finally, accounting for wood density gradients is likely to improve the accuracy of estimates of stem biomass and carbon in tropical trees.
Key words: Radial gradients, shade-tolerance, tree biomass estimates, tree rings, tropical trees, wood density
INTRODUCTION
Wood density is related to a number of plant functional traits and is an important indicator of the mechanical properties of woods (Panshin and de Zeeuw, 1980; Chave et al., 2009). A direct relationship between wood density and tree growth is expected because the volume of wood produced for a given unit biomass is inversely proportional to its density (King et al., 2005). In tropical forests the growth, survival and reproduction of light-demanding tree species is dependent on an ability to avoid or escape prolonged periods of low light (e.g. Ackerley, 1996). Thus, light-demanding species attain rapid rates of height growth, in part by investing in low density wood that is cheap to construct (King et al., 2006), but as a consequence of low stem strength, have high mortality rates due to stem breakage (Putz et al., 1983; van Gelder et al., 2006; Poorter, 2008). In contrast, shade-tolerant tree species grow more slowly and invest in dense, strong and damage-resistant wood that in turn lowers their mortality rates (Putz et al., 1983; Muller-Landau, 2004; van Gelder et al., 2006). A growth-mortality trade-off is likely to be common in trees of diverse tropical forests, and wood density may be one of the best predictors of species differences along this axis of variation (Poorter et al., 2008; Chave et al., 2009).
In addition to interspecific variation in wood density in forests, within individual trees wood density often varies vertically along the main axis of the stem and/or radially from the pith to the bark (Panshin and de Zeeuw, 1980; Grabner and Wimmer, 2006). For example, in gap-colonizing heliophiles of tropical wet forests with very low-density juvenile wood, increases in wood density from the pith to the bark as large as 200–300% have been documented (Whitmore, 1973; Wiemann and Williamson, 1988), and in drier and montane tropical forests increases ranged from 20% to 100% (Wiemann and Williamson, 1989b). It is thought that radial increases in wood density result from a shift in allocation from low density wood and rapid height growth early on in tree development to denser wood and structural reinforcement as trees increase in size, age and height and are exposed to increasing wind speeds within the forest (Wiemann and Williamson, 1989b).
Radial gradients in wood density are found in a range of tree species of different successional stages and from different forests, suggesting that they may occur frequently in trees (Panshin and de Zeeuw, 1980; Wiemann and Williamson, 1989a, b; Omolodun et al., 1991; Hernandez and Restrepo, 1995; Parolin, 2002; Woodcock and Shier, 2002). In tropical wet and dry forest, increases were observed in 80% and 60% of the tree species, respectively (Wiemann and Williamson, 1989a, b), although species were not a random sample of the local tree community. Documented increases are greatest in wet tropical forest and become progressively less in drier tropical forests, montane rain forest and temperate forest (Wiemann and Williamson, 1989b; Woodcock and Shier, 2002), a pattern which is consistent with differences in competition for light, which may be greater in tropical wet forest compared with drier forests (Wiemann and Williamson, 1989a; Coomes and Grubb, 2000; Markesteijn et al., 2007).
Understanding the relative influence of stem age versus stem size on radial gradients in wood density is important for inferences of their adaptive value (e.g. Rosell and Olsen, 2007; de Castro et al., 1993). In a previous study of the effects of tree size and age on radial gradients in wood density, de Castro et al. (1993) presented evidence that tree age was likely to be the driver of radial increases in wood density for a single cohort of Joannesia princeps grown in a Brazilian plantation: for trees of the same age but different diameters the slopes from a regression of wood density versus distance from the pith were generally greater in smaller, slower-growing trees because similar pith to bark changes in wood density occurred across a smaller stem radius. However, these results remain to be verified for trees varying in both age as well as size, and growing in a natural forest setting. At least for tropical trees such data are not available, because quantifying ages in most tropical trees remains difficult. Understanding the drivers of radial gradients in wood density is also important for determining their implications for tree biomechanics; mechanical models of tree stability have thus far not incorporated the possible effects of radial variation in stem wood density (e.g. Sterck and Bongers, 1998). Furthermore, estimates of carbon stocks in forests are strongly affected by accurate estimates of wood density (Chave et al., 2005), but few studies have addressed the potential bias arising from radial variation in wood density within stems (Nogueira et al., 2005, 2008).
In seasonal tropical forests a growing number of species are known to produce reliable annual growth rings, thus allowing one to determine tree ages as well as growth patterns in select species (Worbes, 2002; Baker et al., 2005; Baker and Bunyavejchewin, 2006). By employing X-ray densitometry, which produces a continuous and high resolution (<1 mm) wood density profile from tree cores, annual growth boundaries can be accurately delineated using digitized images of the X-ray films (e.g. Grabner et al., 2005). Tree age and annual increment can therefore be examined as potential explanatory variables in models of wood density variation in addition to tree size.
The overarching goal of this study was to characterize radial variation in wood density in sympatric tropical tree species that differed in relative shade-tolerance. Using data collected from six tropical canopy tree species from a seasonal dry evergreen forest in Thailand, the aim was to address the following questions. (1) How common are radial gradients? (2) How are mean wood density and shade-tolerance related? (3) Do radial gradients decrease with increasing shade-tolerance? (4) Does tree size or age most-parsimoniously explain radial increases in wood density and what is the effect of radial increment?
MATERIALS AND METHODS
Study site and species
This study was conducted in a 50-ha forest dynamics plot established in seasonally dry evergreen forests in the Huai Kha Khaeng Wildlife Sanctuary in west-central Thailand, located at 15°40′N, 99°10′E (Baker et al., 2005; Bunyavejchewin et al., 2001, 2002). Although logging occurred in the region prior to 1970, the forest dynamics plot was established in an area of forest with no evidence of prior logging. The climate in the region is monsoonal with <100 mm of rainfall per month in the dry season between November and April and a mean annual rainfall of approx. 1500 mm. Mean July and January temperatures are 27°C and 19°C, respectively. Soils in the area are highly weathered ultisols (Lauprasert, 1988).
Six canopy tree species – Afzelia xylocarpa Craib, Neolitsea obtusifolia Merrill, Vitex peduncularis Wall. ex Schauer, Toona ciliata M.Roem., Melia azedarach L. and Chukrasia tabularis A. Juss. (= C. velutina M.Roem.) – were selected because they form annual growth rings and comprise an important component of the forest community measured by their basal area or frequency (Baker, 2001; Baker et al., 2005). The shade-tolerance of Afzelia was assigned on the basis of regeneration patterns in the vicinity of the forest dynamics plot. Afzelia has been observed to regenerate exclusively in gaps and juvenile diameter growth rates are high (>10 mm year−1; Baker et al., 2005). For the other species, shade-tolerance was determined primarily from the literature; recent studies and plot observations are consistent with the literature categorization (Troup, 1921; Baker et al., 2005; Baker and Bunyavejchewin, 2006). The selected species thus represent the full range of canopy tree life histories that occur in the forest (Table 1).
Table 1.
Species examined, shade-tolerance, number of trees sampled (n), diameter at breast height (DBH) of sample trees and average percentage change in wood density (from pith to bark) for six tropical trees in western Thailand
| Species | Family | Shade-tolerance | n | DBH mean (range) (cm) | Percentage change in wood density* |
|---|---|---|---|---|---|
| Afzelia xylocarpa | Fabaceae (Caesalp.) | Intolerant | 9 | 58·8 (12·1–84·4) | 24 |
| Chukrasia tabularis | Meliaceae | Intolerant/intermediate | 22 | 41·5 (11·0–67·2) | 38 |
| Melia azedarach | Meliaceae | Very intolerant | 11 | 51·2 (16·9–62·7) | 70 |
| Neolitsea obtusifolia | Lauraceae | Tolerant | 26 | 44·5 (8·5–69·7) | −13 |
| Toona ciliata | Meliaceae | Intolerant | 9 | 64·4 (36·0–76·1) | 27 |
| Vitex peduncularis | Lamiaceae | Intermediate | 12 | 28·8 (14·0–43·4) | 36 |
Field and laboratory procedure
Canopy trees were cored in April 2007 with a 5-mm-diameter increment borer at approx. 1 m height. Due to the limited number of individuals of each species on the plot, trees were selected non-randomly and to represent the full range of diameters present, excluding very irregular stems or severely leaning individuals. The number of trees sampled, diameter ranges and mean diameters for each species are given in Table 1.
X-ray densitometry was used to measure the wood density of one core per tree. Samples were allowed to air dry in the laboratory, sawn along their length to a uniform thickness of 1·4 mm with a double-bladed saw and then placed on film and exposed to X-rays (10 kV, 24 mA) for 25 min (Grabner et al., 2005). X-ray films were then digitized using a custom-built scanner equipped with a stepwise driven motor and a line-camera on an incident-light microscope, resulting in a resolution of 3·52 µm pixel−1. Wood density was then measured from the digital images (256 grey levels) using SigmaScan Pro® version 5·0 (Systat Software Inc., San Jose, CA, USA) and the data for each tree were summarized for analysis by calculating means for 1-cm intervals. Absolute density values were obtained by including a density standard made of cellulose acetate with each X-ray film during exposure and later calibrating the greyscale.
Although annual growth rings were identifiable in all six species, those in Melia were the most readily identifiable in density images because of conspicuous rows of large vessels at the start of rings and a pronounced intra-annual density gradient. Melia was therefore chosen to compare the effects of age, radial distance from the pith and annual growth on wood density, and in addition, the average wood density in each growth ring, the radial distance from pith at the end of each growth ring and annual increment were measured. Then the average growth rate was calculated for each tree.
Not all coring attempts reached the pith of the tree, so missing distances to the pith were estimated from the curvature of the last complete inner ring using Duncan's geometric method (Duncan, 1989). Hereafter, these corrected data are referred to as the radial distance from the pith. By extension, the number of missing inner tree rings for each Melia individual was calculated by dividing the missing distance (cm) by the average growth rate (cm year−1) in the adjacent five growth rings, and tree ages adjusted for the missing number of rings.
Statistical analysis
Models of variation in wood density
Two sets of linear mixed-effects models were developed to investigate the relationships among wood density and the explanatory variables. The first set of models examined differences in average wood density and radial variation in wood density among the six species. The second set examined the importance of radial distance from the pith, tree age and annual increment in models of radial variation in wood density for Melia. Below, the models are described and the methods used to select the most-parsimonious models outlined.
Interspecific differences in average wood density and in radial gradients in wood density
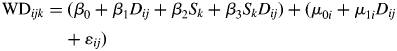
Average wood density and gradients in wood density with radial distance were expected to vary with shade-tolerance, and thus fit the following linear mixed-effects model to explain variation in wood density among the six species:
 |
1 |
where WDijk is the wood density for ith 1-cm interval in the jth tree of the kth species; Dij is the radial distance in cm from the pith and Sk is the species of tree. β0, β1, β2, β3 are the fixed effects. Initially, both a random intercept, μ0i, and a random slope, μ1i were included to account for random variation at the tree level. In order to account for dependence among εij due to temporal autocorrelation within-trees, a variety of error autocorrelation structures were evaluated. To determine the most-parsimonious model, a series of reduced models which varied in their inclusion of the fixed and random effects terms were examined (Table 2).
Table 2.
Comparison of the fitted models for six tree species from western Thailand including the predictor variables examined, corresponding maximum log-likelihoods, AIC values and differences in AIC relative to the model with the lowest AIC (Model 2; ΔAIC)
| Model | D | S | D × S | Random intercept | Random slope | Log- likelihood | AIC | ΔAIC* |
|---|---|---|---|---|---|---|---|---|
| 1 | x | x | x | x | −7615·76 | 15261·53 | 0·9 | |
| 2 | x | x | x | x | x | −7613·31 | 15260·63 | 0 |
| 3 | x | x | x | x | −7621·41 | 15272·81 | 12·18 | |
| 4 | x | x | x | x | −7645·76 | 15315·52 | 54·89 | |
| 5 | x | x | x | −7696·08 | 15406·16 | 145·53 |
Predictor variables included distance from the pith in cm (D) and species (S). The inclusion of a term is indicated by an x.
* Note: ΔAIC <2 indicates little difference in support for competing models (Burnham and Anderson, 2002).
Effects of tree age, radius and annual increment on radial increases in Melia
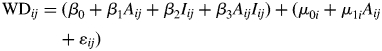
A separate series of linear mixed-effects models was developed solely for Melia. Exploratory data plots indicated a log-transformation was appropriate in order to obtain a linear relationship between wood density and tree age, and to meet assumptions of linearity and normality in variance. Candidate models ranged in complexity from simple models that included age or size only (either the ith ring from the pith or the ith centimetre from the pith) to more complex models that included all of the terms as well as interactions among variables (Table 3). The final linear mixed-effects model form was:
 |
2 |
where WDij is the value of the wood density for the ith of ni observations in the jth tree; Aij is the log-transformed tree age, Iij is the annual increment. μ0i, μ1i are random effects for each tree and εij is the error. A variety of error autocorrelation structures were evaluated to determine the most suitable for the model.
Table 3.
Comparison of the fitted linear mixed models for Melia azedarach examining the effects of radial distance from the pith (D), log-transformed age (A) and annual increment (I) on wood density including the predictor variables examined and corresponding maximum log-likelihoods, AIC values and differences in AIC among models (ΔAIC)*
| Model number | Fixed effects terms | AIC | Log-likelihood | ΔAIC |
|---|---|---|---|---|
| 1 | A + I + A : I | 3122·37 | −1552·18 | 0 |
| 2 | D + I + D : I | 3126·49 | −1554·24 | 4·12 |
| 3 | A | 3130·26 | −1558·13 | 7·89 |
| 4 | A + In.s. | 3131·29 | −1557·65 | 8·92 |
| 5 | A + Dn.s. | 3132·09 | −1558·04 | 9·72 |
| 6 | D | 3138·63 | −1562·31 | 16·26 |
| 7 | D + In.s. | 3138·91 | −1561·46 | 16·54 |
n.s., Non-significant terms at P < 0·05.
* Note: ΔAIC values between 3 and 7 indicate considerably less support for the model (Burnham and Anderson, 2002).
Model selection and evaluation
To select the most-parsimonious model among competing models the significance of the fixed effects terms was first evaluated using approximate Wald tests and likelihood-ratio tests – the latter via comparison with a reduced model which differed by the term being tested (Pinheiro and Bates, 2000). Secondly, the significance of the random-effect terms and error autocorrelation were evaluated using likelihood-ratio tests. To select among error autocorrelation structures, nested models were compared using likelihood-ratio tests and non-nested models were compared using information criteria statistics (Pinheiro and Bates, 2000). Finally, models were compared by calculating the difference in Akaike's information criteria (AIC) between the model with the lowest AIC, indicating greatest parsimony, and the AIC of another candidate model (Tables 2 and 4; Burnham and Anderson, 2002).
Table 4.
Maximum likelihood parameter estimates and confidence limits (95%) for a linear mixed-effects model describing changes in wood density with distance from the pith (D) for six canopy tree species (Spp) in western Thailand (Table 2, model 1)
| Parameter | Estimate (s.e.) | t-value | P-value | Confidence interval |
|---|---|---|---|---|
| Intercept | 809·6 (32·0) | 25·31 | <0·001 | 747·1, 872·1 |
| D | 5·0 (1·5) | 3·26 | 0·001 | 2·0, 8·0 |
| Spp | ||||
| Ct | −193·7 (38·1) | −5·08 | <0·001 | −269·2, −118·3 |
| Ma | −320·7 (42·5) | −7·54 | <0·001 | −404·3, −236·5 |
| No | 37·2 (37·6) | 1·00 | 0·325 | −37·2, 111·6 |
| Tc | −336·6 (47·2) | −7·13 | <0·001 | −430·1, −243·2 |
| Vp | −109·7 (43·7) | −2·51 | 0·014 | −196·2, −23·2 |
| D × Spp | ||||
| D × Ct | 3·8 (2·0) | 1·90 | 0·056 | −0·1, 7·7 |
| D × Ma | 6·0 (2·1) | 2·79 | 0·005 | 1·8, 10·2 |
| D × No | −8·2 (1·9) | −4·30 | <0·001 | −11·9, −4·5 |
| D × Tc | −1·2 (2·2) | −0·53 | 0·589 | −5·4, 3·1 |
| D × Vp | 10·1 (3·2) | 3·17 | 0·002 | 3·9, 16·3 |
| Variance components | s.d. | Likelihood-ratio | P-value | Confidence interval |
| Intercept | 55·6 | 16·19 | <0·001 | 41·7, 74·1 |
| Residual | 76·7 | 62·1, 80·3 | ||
| AR1 error term | 0·76 | 436·51 | <0·001 | (0·70, 0·80) |
P-values for Spp and D × Spp test are for significant differences relative to Afzelia xylocarpa.
Species abbreviations: Ct, Chukrasia tabularis; Ma, Melia azedarach; No, Neolitsea obtusifolia; Tc, Toona ciliata; Vp, Vitex peduncularis.
Table 5.
Maximum likelihood parameter estimates and confidence limits (95%) for the linear mixed model describing variation in wood density with log-transformed tree age (A) and annual increment (I) for Melia azedarach (Table 3, model 1)
| Parameter | Estimate | t-value | P-value | Confidence interval |
|---|---|---|---|---|
| Intercept | 450·5 (60·9) | 7·40 | <0·001 | 331·5, 569·6 |
| A | 177·9 (50·6) | 3·51 | <0·001 | 78·9, 276·9 |
| I | −124·3 (34·5) | −3·60 | <0·001 | −191·7, −56·8 |
| A : I | 116·3 (33·5) | 3·47 | <0·001 | 50·7, 181·8 |
| Variance components | Standard deviation | Likelihood-ratio | P-value | Confidence interval |
| Intercept | 138·6 | 13·63 | 0·001 | 73·3, 261·9 |
| A | 115·6 | 9·48 | 0·009 | 50·4, 265·1 |
| Residual | 64·1 | 57·3, 71·7 | ||
| AR1 error term | 0·34 | 24·38 | <0·001 | 0·22, 0·48 |
In addition to using AIC to indicate which model most-parsimoniously explained radial gradients in Melia, comparison of our analysis with that of de Castro et al. (1993) was facilitated by examining the relationship between the increase in wood density with distance (slope term from model 2, Table 3, including the random effect) and average growth rate in Melia trees.
For each linear mixed-effects model assumptions – constant variance, homogeneity of group variances and normality of the within-group errors – were assessed graphically (Pinheiro and Bates, 2000). Plots of predicted values versus the observed data were used to assess model fit (see Supplementary Data, available online). All analyses were conducted in R version 2·6·2 (R Foundation for Statistical Computing, Vienna, Austria) using the package nlme (Pinheiro and Bates, 2000). Error rates for multiple comparisons of average wood density among species (Fig. 1) were controlled by using the Tukey multiple comparison procedure within the R package multcomp (Hothorn et al., 2008).
Fig. 1.

Wood density for six canopy trees species in western Thailand: pairs with the same letter are not significantly different (P > 0·05). Values were calculated from a linear mixed effects model of the variation in wood density (Table 4) and error inflation controlled using Tukey's multiple comparison procedure.
RESULTS
Species differences in average wood density and radial gradients in wood density
Two models including the main effects of species and distance from the pith as well as their interaction on wood density for the six species had equal support (models 1 and 2; Table 2). There was little support for alternative models which either excluded a random intercept or the interaction between species and distance from the pith (models 3–5; Table 2). Likelihood-ratio tests confirmed the statistical significance of the random intercept term (Tables 2 and 4). Inspection of regressions of wood density versus distance from the pith conducted for the individuals of each species suggested testing for random variation in the slope and intercept (data not shown), but the inclusion of a random slope term did not significantly improve model fit (models 1 and 2; Table 2). Thus, the simpler of the two models (model 1) was selected. An error autoregressive correlation structure of order one provided the most-parsimonious fit. The best model explained 79% of the variation in the observed data and provided a good fit (model 1; see Fig. S1 in Supplementary Data].
Mean wood density for the six tree species varied by nearly a factor of two, from approx. 470 kg m−3 to approx. 850 kg m−3 (Fig. 1). The rank order of species from highest to lowest mean wood density was Neolitsea, Afzelia, Vitex, Chukrasia, Melia, Toona (Fig. 1). With the exception of Afzelia, this order corresponded to species differences in shade-tolerance (Fig. 1 and Table 1). Significant differences in mean wood density were present, although species that were relatively similar in shade-tolerance did not significantly differ (Fig. 1).
Radial gradients in wood density were present in all of the six species (Fig. 2 and Table 4). In five of the six species wood density increased with distance from the pith (Fig. 2), although large confidence intervals indicated a marginally insignificant slope for Toona (Table 4). Individual tree plots of wood density versus distance from the pith suggested that despite the curvilinear appearance of the aggregated data in some species (e.g. Melia; Fig. 2), individual trees trends were generally linear (data not shown). The most shade-tolerant species, Neolitsea, showed a radial decrease in wood density (Fig. 2); however, the rank order of slopes (Neolitsea, Toona, Afzelia, Chukrasia, Melia, Vitex; see Table 4) did not reflect differences in shade-tolerance (Fig. 2 and Table 1). Unexpectedly, radial increases in the more shade-tolerant species Chukrasia and Vitex were greater than in Toona and, despite similar average wood densities and shade-tolerances, radial gradients were quite different between Toona and Melia.
Fig. 2.

Variation in wood density with distance from the pith for six tree species in western Thailand with fitted values predicted by a linear mixed effects model fit by maximum likelihood (Table 2, Model 1).
Radial gradients are often reported in terms of a percentage change from the pith to the bark, whereas slopes describe the rate of change in wood density independent of size differences among trees. Expressed in percentage change, the greatest increase occurred in Melia at 70% (Table 1).
Effects of size, age and increment on radial shifts in Melia
Increases in wood density in Melia with tree age and tree diameter were similar (Figs 2 and 3F). However, the AIC comparisons indicated the model including log-age and annual increment provided a better fit to the data than the equivalent model with distance from the pith. The most-parsimonious model (model 1; Table 3) included terms for log-age, annual increment and their interaction, and explained 74% of the variation in the observed data. This model fit well, with the exception of some model bias at the lowest and highest wood densities (see Fig. S2 in Supplementary Data, available online). Delta AIC values indicated considerably less support for the alternative models (Table 3). As in the previous model for all six tree species, an error autoregressive correlation structure of order one provided the most-parsimonious fit.
Fig. 3.

Relationships for Melia azedarach: (A) stem radius and tree age; (B) predicted wood density and the interaction of annual increment and tree age; (C) annual increment and wood density; (D) increment and log-tree age; (E) wood density and log-tree age; ( F) wood density and tree age. For (B) values for mean increment, mean increment plus one standard deviation, and mean increment minus one standard deviation were calculated with the observed data for the following year classes: 0–9, 10–19, 20–29, 30–39, 40–50. These values were then used to calculate predicted values of wood density at each age from a linear mixed model (Model 1, Table 3).
Size and age varied substantially among the 11 Melia trees (Fig. 3A). As expected, there was a negative relationship between annual increment and log-age (Fig. 3D), and between annual increment and wood density (Fig. 3C). Wood density increased linearly with log-transformed tree age (Fig. 3E). A significant but small interaction effect was found between annual increment and log-age on wood density: slower growth in young trees was associated with greater wood density but this difference diminished with tree age (Fig. 3B). Finally, a negative relationship was also observed between the slope of the increase in wood density with distance from the pith (predicted from model 2; Table 3) and the average growth rate of individuals (Fig. 4).
Fig. 4.

Slope of the increase in wood density with distance from the pith predicted from a linear mixed model fit by maximum likelihood versus average growth rate for Melia azedarach trees in western Thailand (Model 2, Table 3).
DISCUSSION
Shade-tolerance and mean wood density
It was found that the variation in mean wood density corresponded with differences in shade-tolerance for all species except for the intolerant Afzelia, which was closer in density to the shade-tolerant Neolitsea than to Toona or Melia, the other intolerant species (Fig. 1 and Table 1). Baker and Bunyavejchewin (2006) examined canopy ascension patterns using tree ring analyses for five of the species in the present study (excluding Afzelia) and found that rapid growth into the canopy in high light was most common in Melia and declined substantially with increasing shade-tolerance, whereas the most common pattern amongst shade-tolerant trees was slow growth in low-light beneath the canopy. These patterns for a seasonally dry rainforest in Thailand are consistent with recent results from a wide range of tropical forests, indicating a central role for wood density in the growth strategies of trees, with low wood density facilitating rapid canopy ascension in shade-intolerant trees and higher wood density contributing to higher survival in shade-tolerant trees which grow slowly beneath a canopy (Ackerley, 1996; van Gelder et al., 2006). Chave et al. (2009) noted a possible exception to the general negative trend of lower growth rates and higher wood density, suggesting that in seasonally dry climates denser wooded plant species may be better equipped to cope with strongly negative xylem potentials and water stress (resistance to xylem implosion; Hacke et al., 2001) and hence exhibit greater annual growth rates than lighter-wooded species. This could in part explain the association of relatively high growth rates with high wood density in Afzelia in the present study.
Potential causes of radial gradients in wood density in Melia
The AIC comparisons (Table 3) revealed the most-parsimonious model included the effects of tree age with a minor effect of annual growth (Fig. 2B), demonstrating that wood density does indeed vary with tree age independently of tree size (radial distance from the pith) in Melia. In addition, the negative relationship between the slope of the change in wood density with distance and mean growth rate (Fig. 4) shows that the density gradient depends on tree age: in slower-growing trees the increase in wood density with age occurs across a smaller radius, resulting in greater slopes. De Castro et al. (1993) documented the importance of tree age in a previous study, though whether their results could be generalized to natural forests and adult canopy trees was uncertain for two reasons: (1) the study trees were young (17 years) and consisted of a single cohort grown in a plantation; and (2) growth and density could not be annually resolved as the species did not produce annual growth rings.
Radial gradients in wood density have been primarily interpreted as an adaptation for structural support in tropical pioneer trees which exhibit rapid height and diameter growth by producing wood of low density as juveniles but require greater stability later in development, possibly due to greater exposure to wind (Wiemann and Williamson, 1988, 1989a, b). As previously noted by de Castro et al. (1993) given this interpretation, one would expect a measure of tree size such as diameter or height rather than tree age to be most strongly related to radial gradients in wood density. In a recent study, Woodcock and Shier (2003) found some evidence for an influence of tree height on radial gradients in temperate tree species, although this was from a correlation of the ‘current’ height of individuals with their radial gradient in wood density and not from an analysis with tree height as an independent variable, thus it is difficult to derive inferences from these results. The present data are novel for tropical trees in that the effect of age, stem size (distance from the pith) and growth rates on wood density can be tested; however, because it was not possible to obtain retrospective data on tree heights, it cannot be ruled out that age may be a proxy for some other measure of size such as tree height. Finally, higher density wood is also more resistant to pathogens (Augspurger, 1984), thus increasing wood density with tree age may function as a defence mechanism against increasing pathogen loads over time.
Association between mean wood density or shade-tolerance and radial gradients in wood density
Woodcock and Shier (2002) proposed a model for the degree and direction of radial trends in wood density (specific gravity) in tree species. In their model, large positive slopes are associated with pioneer species with low wood density and slopes progressively decline and ultimately become negative in late-successional species with specific gravities ranging from approx. 0·6 to 1·0. The present observations were not found to be consistent with this model: Vitex and Afzelia had relatively high-density wood and positive radial gradients and both had much higher wood densities and greater slopes than the light-wooded, shade-intolerant Toona. In addition, mean wood density, as well as shade-tolerance was quite similar between Toona and Melia, but their radial gradients were markedly different. In another recent study of radial gradients in wood density which examined 35 tree species of the Amazonian floodplains, the mean wood density of a species and the average increase in wood density from pith to bark were not significantly related, although generally increases were greatest and most common in fast-growing pioneers (Parolin, 2002). Similarly, though differences between pioneers and very shade-tolerant species were evident in the present study (compare Melia and Neolitsea; Figs 1 and 2), radial gradients in wood density did not correspond to mean wood density or shade-tolerance across the range of shade-tolerance categories (Table 1).
It is suggested that a ‘whole-tree’ perspective – such as that proposed by Givnish (1988) for the interpretation of leaf level traits within the context of whole-plant adaptation to light environments – is likely key to understanding the relationships among radial gradients in wood density, tree biomechanics and successional status/shade-tolerance. For example, recent research has documented that species strategies for dealing with wind disturbance vary: some species may lose canopy elements during severe winds to mitigate stress on the main stem, but retain enough elements to recover post-disturbance, while others retain their canopy at higher wind speeds, but risk catastrophic failure if winds become strong enough (Metcalfe et al., 2008). Maximum adult stature is also important for understanding species differences in wood density, tree structural stability and likely radial gradients in wood density. Recent studies indicate that, among pioneer species, wood density, stiffness factors, safety factors and wood strength all increase with maximum adult stature (Falster and Westoby, 2005; van Gelder et al., 2006). Finally, longevity is an important life history trait that could lead to differences in wood density and its radial trends among two pioneer species with similar requirements for regeneration; in the present study Afzelia and Melia are both shade-intolerant and have high juvenile growth, but individuals of Afzelia reach ages in excess of 250 years, whereas Melia rarely exceed approx. 70 years of age (Baker et al., 2005).
Further evidence for the co-ordination of wood density with traits across the whole-plant, including leaf size, minimum leaf water potential and possibly rooting depth was recently presented in an extensive review by Chave et al. (2009) in which the existence of a ‘wood economics spectrum’ was proposed. The present results suggest that radial gradients in wood density – which likely represent an allocational shift from rapid height growth to mechanical support throughout development in response to environmental conditions are relevant to understand aspects of the ‘wood economics spectrum’.
Significance for biomass estimates
Variation in wood density occurs at multiple scales in forest ecosystems, ranging from within trees, to regional changes in mean wood density among forest communities (Hernandez and Restrepo, 1995; Muller-Landau, 2004; Chave et al., 2006; Grabner and Wimmer, 2006; Swenson and Enquist, 2007). Understanding and documenting the great degree of variation in wood density is thus an important challenge in calculating biomass and carbon pools in tropical forests, a critical area of research on global carbon cycles (Brown, 2002; Woodcock and Shier, 2002; Nogueira et al., 2005). Studies of destructively sampled trees have shown that, in predicting the mass of a tree, wood density is the second most important parameter after tree diameter (Chave et al., 2005). Where radial gradients are present, mean stem density increases or decreases with stem size and thus estimates of stem biomass and in turn carbon based on a mean species density become inaccurate (Nogueira et al., 2008). In the case of the six species in the present study, simple calculations of the biomass of a stem disc 40 cm in diameter using mean density values of the cores resulted in an overestimate of approx. 8% in Neolitsea due to its radial decrease in density, to underestimates ranging from approx. 12% to approx. 31% in the other five species due to radial increases. Errors even will be larger when stem-wood density is determined from the density of outer wood, such as when short tree cores are taken. Overall, errors in carbon estimation resulting from radial gradients will depend mainly on the slope of the change in wood density, as well as the proportion of individuals with increasing and decreasing densities. Thus, studies designed specifically to assess how frequent radial gradients in wood density occur in different forests are needed. Previous studies have examined radial gradients in wood density by individually quantifying the wood-specific gravity of small segments of cores (e.g. 1 cm, Woodcock and Shier, 2003; de Castro et al., 1993), while providing less-refined data sets and opportunities for anatomical analysis than x-ray densitometry, gravimetric analysis would likely require less time and specialized equipment.
SUPPLEMENTARY DATA
Supplementary data are available online at http://aob.oxfordjournals.org/ and consist of Fig. S1: the goodness-of-fit for the linear mixed model for the wood density of six tree species fitted by maximum likelihood (see Table 2, model 1); and Fig. S2: the goodness-of-fit for the radial variation in the wood density of Melia azederach fitted by maximum likelihood (see Table 3, model 1).
ACKNOWLEDGEMENTS
We thank Manop Keawfoo and the staff of HKK for help in the field. We also acknowledge the Thai Royal Forest Department and the Center for Tropical Forest Science of the Smithsonian Tropical Research Institute for establishing the 50-ha plot. This work was supported by a grant from the Austrian Science Foundation (Grant P19507-B17). The authors would also like to thank S. C. Thomas and D. G. Woolford for suggestions on statistical approaches and to D. Metcalfe and J. Norghauer for helpful comments. Funding to pay the Open Access publication charges for this article was provided by the Austrian Science Fund (FWF).
LITERATURE CITED
- Ackerly DD. Canopy structure and dynamics: integration of growth processes in tropical pioneer trees. In: Mulkey S.S., Chazdon RL, Smith AP., editors. Tropical forest plant ecophysiology. New York, NY: Chapman and Hall; 1996. pp. 619–659. [Google Scholar]
- Augspurger CK. Light requirements of Neotropical seedlings: a comparative study of growth and survival. Journal of Ecology. 1984;72:777–795. [Google Scholar]
- Baker PJ. Age structure and stand dynamics of a seasonal tropical forest in western Thailand. University of Washington; 2001. PhD Thesis. [Google Scholar]
- Baker PJ, Bunyavejchewin S. Suppression, release and canopy recruitment in five tree species from a seasonal tropical forest in western Thailand. Journal of Tropical Ecology. 2006;22:521–529. [Google Scholar]
- Baker PJ, Bunyavejchewin S, Oliver CD, Ashton PS. Disturbance history and historical stand dynamics of a seasonal tropical forest in western Thailand. Ecological Monographs. 2005;75:317–343. [Google Scholar]
- Brown S. Measuring carbon in forests: current status and future challenges. Environmental Pollution. 2002;116:363–372. doi: 10.1016/s0269-7491(01)00212-3. [DOI] [PubMed] [Google Scholar]
- Bunyavejchewin S, Baker PJ, Lafrankie JV, Ashton PS. Stand structure of a seasonal evergreen forest at the Huai Kha Khaeng Wildlife Sanctuary, western Thailand. Natural History Bulletin of the Siam Society. 2001;49:89–106. [Google Scholar]
- Bunyavejchewin S, Baker PJ, Lafrankie JV, Ashton PS. Floristic composition of a seasonal evergreen forest at the Huai Kha Khaeng Wildlife Sanctuary, western Thailand. Natural History Bulletin of the Siam Society. 2002;50:125–134. [Google Scholar]
- Burnham KP, Anderson DR. Model selection and multi-model inference: a practical information-theoretic approach. New York, NY: Springer-Verlag; 2002. [Google Scholar]
- de Castro F, Williamson GB, Dejesus RM. Radial variation in the wood specific-gravity of Joannesia princeps: the roles of age and diameter. Biotropica. 1993;25:176–182. [Google Scholar]
- Chave J, Andalo C, Brown S, et al. Tree allometry and improved estimation of carbon stocks and balance in tropical forests. Oecologia. 2005;145:87–99. doi: 10.1007/s00442-005-0100-x. [DOI] [PubMed] [Google Scholar]
- Chave J, Muller-Landau HC, Baker TR, Easdale TA, Ter Steege H, Webb CO. Regional and phylogenetic variation of wood density across 2456 Neotropical tree species. Ecological Applications. 2006;16:2356–2367. doi: 10.1890/1051-0761(2006)016[2356:rapvow]2.0.co;2. [DOI] [PubMed] [Google Scholar]
- Chave J, Coomes D, Jansen S, Lewis SL, Swenson NG, Zanne AE. Towards a worldwide wood economics spectrum. Ecology Letters. 2009;12:351–366. doi: 10.1111/j.1461-0248.2009.01285.x. [DOI] [PubMed] [Google Scholar]
- Coomes DA, Grubb PJ. Impacts of root competition in forests and woodlands: a theoretical framework and review of experiments. Ecological Monographs. 2000;70:171–207. [Google Scholar]
- Duncan RP. An evaluation of errors in tree age estimates based on increment cores in kahikatea (Dacrycarpus dacrydioides) New Zealand Natural Sciences. 1989;16:31–37. [Google Scholar]
- Falster D, Westoby M. Alternative height strategies among 45 dicot rain forest species from tropical Queensland, Australia. Journal of Ecology. 2005;93:521–535. [Google Scholar]
- van Gelder HA, Poorter L, Sterck FJ. Wood mechanics, allometry, and life-history variation in a tropical rain forest tree community. New Phytologist. 2006;171:367–378. doi: 10.1111/j.1469-8137.2006.01757.x. [DOI] [PubMed] [Google Scholar]
- Givnish TJ. Adaptation to sun and shade: a whole-plant perspective. Australian Journal of Plant Physiology. 1988;15:63–92. [Google Scholar]
- Grabner M, Wimmer R. Variation of different tree-ring parameters as present in a complete Norway spruce stem. Dendrochronologia. 2006;23:111–120. [Google Scholar]
- Grabner M, Wimmer R, Gierlinger N, Evans R, Downes G. Heartwood extractives in larch and effects on X-ray densitometry. Canadian Journal of Forest Research. 2005;35:2781–2786. [Google Scholar]
- Hacke UG, Sperry JS, Pockman WT, Davis SD, McCulloch KA. Trends in wood density and structure are linked to prevention of xylem implosion by negative pressure. Oecologia. 2001;126:457–461. doi: 10.1007/s004420100628. [DOI] [PubMed] [Google Scholar]
- Hernandez RE, Restrepo G. Natural variation in wood properties of Alnus acuminata H.B.K. grown in Colombia. Wood and Fiber Science. 1995;27:41–48. [Google Scholar]
- Hothorn T, Bretz F, Westfall P. Simultaneous inference in general parametric models. Biometrical Journal. 2008;50:346–363. doi: 10.1002/bimj.200810425. [DOI] [PubMed] [Google Scholar]
- King DA, Davies SJ, Supardi MNN, Tan S. Tree growth is related to light interception and wood density in two mixed dipterocarp forests of Malaysia. Functional Ecology. 2005;19:445–453. [Google Scholar]
- King DA, Davies SJ, Tan S, Noor NSM. The role of wood density and stem support costs in the growth and mortality of tropical trees. Journal of Ecology. 2006;94:670–680. [Google Scholar]
- Lauprasert M. The creation of a permanent sample plot in dry evergreen forest of Thailand and investigations of a suitable plot size for permanent sample plot programs. International Institute for Aerospace Survey and Earth Sciences, the Netherlands; 1988. MSc Thesis. [Google Scholar]
- Markesteijn L, Poorter L, Bongers F. Light-dependent leaf trait variation in 43 tropical dry forest tree species. American Journal of Botany. 2007;94:515–525. doi: 10.3732/ajb.94.4.515. [DOI] [PubMed] [Google Scholar]
- Metcalfe DJ, Bradford MG, Ford AJ. Cyclone damage to tropical rain forests: species- and community-level impacts. Austral Ecology. 2008;33:432–441. [Google Scholar]
- Muller-Landau HC. Interspecific and inter-site variation in wood specific gravity of tropical trees. Biotropica. 2004;36:20–32. [Google Scholar]
- Nogueira EM, Fearnside PM, Nelson BW. Normalization of wood density in biomass estimates of Amazon forests. Forest Ecology and Management. 2008;256:990–996. [Google Scholar]
- Nogueira EM, Nelson BW, Fearnside PM. Wood density in dense forest in central Amazonia, Brazil. Forest Ecology and Management. 2005;208:261–286. [Google Scholar]
- Omolodun OO, Cutter BE, Krause GF, McGinnes EA. Wood quality in Hildegardia barteri (Mast.) kossern – an African tropical pioneer species. Wood and Fiber Science. 1991;23:419–435. [Google Scholar]
- Panshin AJ, de Zeeuw C. Textbook of wood technology. New York, NY: McGraw-Hill Publishing Co; 1980. [Google Scholar]
- Parolin P. Radial gradients in wood specific gravity in trees of Central Amazonian floodplains. IAWA Journal. 2002;23:449–457. [Google Scholar]
- Pinheiro JC, Bates DM. Mixed effects models in S and S-plus. New York, NY: Springer-Verlag; 2000. [Google Scholar]
- Poorter L. The relationships of wood-, gas- and water fractions of tree stems to performance and life history variation in tropical trees. Annals of Botany. 2008;102:367–375. doi: 10.1093/aob/mcn103. [DOI] [PMC free article] [PubMed] [Google Scholar]
- Poorter L, Wright SJ, Paz H, et al. Are functional traits good predictors of demographic rates? Evidence from five Neotropical forests. Ecology. 2008;89:1908–1920. doi: 10.1890/07-0207.1. [DOI] [PubMed] [Google Scholar]
- Putz FE, Coley PD, Lu K, Montalvo A, Aiello A. Uprooting and snapping of trees – structural determinants and ecological consequences. Canadian Journal of Forest Research. 1983;13:1011–1020. [Google Scholar]
- Rosell JA, Olson ME. Testing implicit assumptions regarding the age vs. size dependence of stem biomechanics using Pittocaulon (similar to Senecio) praecox (Asteraceae) American Journal of Botany. 2007;94:161–172. doi: 10.3732/ajb.94.2.161. [DOI] [PubMed] [Google Scholar]
- Sterck FJ, Bongers F. Ontogenetic changes in size, allometry, and mechanical design of tropical rain forest trees. American Journal of Botany. 1998;85:266–272. [PubMed] [Google Scholar]
- Swenson NG, Enquist BJ. Ecological and evolutionary determinants of a key plant functional trait: wood density and its community-wide variation across latitude and elevation. American Journal of Botany. 2007;94:451–459. doi: 10.3732/ajb.94.3.451. [DOI] [PubMed] [Google Scholar]
- Troup RS. The silviculture of Indian trees. Oxford: Clarendon Press; 1921. [Google Scholar]
- Whitmore JL. Wood density variation in Costa Rican balsa. Wood Science. 1973;5:223–229. [Google Scholar]
- Wiemann MC, Williamson GB. Extreme radial changes in wood specific-gravity in some tropical pioneers. Wood and Fiber Science. 1988;20:344–349. [Google Scholar]
- Wiemann MC, Williamson GB. Radial gradients in the specific-gravity of wood in some tropical and temperate trees. Forest Science. 1989;a 35:197–210. [Google Scholar]
- Wiemann MC, Williamson GB. Wood specific-gravity gradients in tropical dry and montane rain-forest trees. American Journal of Botany. 1989;b 76:924–928. [Google Scholar]
- Woodcock DW, Shier AD. Wood specific gravity and its radial variations: the many ways to make a tree. Trees – Structure and Function. 2002;16:437–443. [Google Scholar]
- Woodcock DW, Shier AD. Does canopy position affect wood specific gravity in temperate forest trees? Annals of Botany. 2003;91:529–537. doi: 10.1093/aob/mcg054. [DOI] [PMC free article] [PubMed] [Google Scholar]
- Worbes M. One hundred years of tree-ring research in the tropics – a brief history and an outlook to future challenges. Dendrochronologia. 2002;20:217–231. [Google Scholar]