

Abstract
 Multiple microRNAs (miRNAs) are detected in a microarray format using a novel approach that combines a surface enzyme reaction with nanoparticle-amplified SPR imaging (SPRI). The surface reaction of poly(A) polymerase creates poly(A) tails on miRNAs hybridized onto locked nucleic acid (LNA) microarrays. DNA-modified nanoparticles are then adsorbed onto the poly(A) tails and detected with SPRI. This ultrasensitive nanoparticle-amplified SPRI methodology can be used for miRNA profiling at attomole levels.
MicroRNAs (miRNAs) are small RNA molecules (19 to 23mers) that can regulate the expression of genes in plants and animals by binding to the 3′-untranslated region of messenger RNAs.1 Several research groups have studied miRNA gene regulation in processes as diverse as cell proliferation, fat metabolism, and cell differentiation.2,3 The recent surge of interest in miRNAs and the related small interfering RNA (siRNA) gene silencing methodology3 has led to an increased need for the ultrasensitive detection and quantitation of small miRNAs in both solution and surface microarray formats.4-7
The multiplexed detection of miRNAs with DNA microarrays is a particularly appealing method for miRNA profiling in biological samples.5 However, the direct hybridization of miRNAs onto complementary DNA microarrays is problematic due to the short length of the miRNA sequences. A chemical or enzymatic modification (e.g. ligation, polymerase extension, biotinylation) of the target miRNA is required.5-8 For example, polyadenylation of the 3′-end of target miRNAs in solution with the enzyme poly(A) polymerase has been used to detect miRNAs with fluorescence imaging down to a concentration of 10 pM.5 In addition, the use of modified single stranded DNA such as locked nucleic acids (LNAs) that bind more strongly to the miRNA has been used to increase the sensitivity of the microarray assays by approximately a factor of ten.9
In this communication, we describe a novel approach for the detection of miRNAs on LNA microarrays down to a concentration of 10 fM with the technique of surface plasmon resonance imaging (SPRI).10 This methodology employs a combination of surface poly(A) enzyme chemistry and nanoparticle-amplified SPRI measurements.11,12 This ultrasensitive nanoparticle-amplified SPRI methodology is further applied to determine miRNA concentrations present in a total RNA sample from mouse liver tissue.
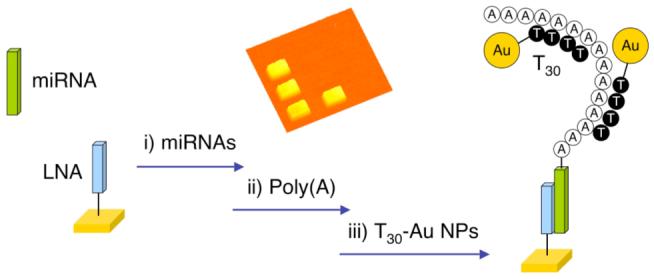
Figure 1 shows the proposed three-step scheme for the detection and identification of miRNAs. The target miRNAs are first adsorbed from solution onto a single stranded LNA microarray (step (i) in the figure). In step (ii), poly(A) tails are added to the surface bound miRNAs via the poly(A) polymerase surface reaction. Finally, in step (iii) the poly(A) tails are hybridized with T30 DNA-coated Au nanoparticles (NPs) for signal amplification and subsequently detected with SPRI.
Figure 1.
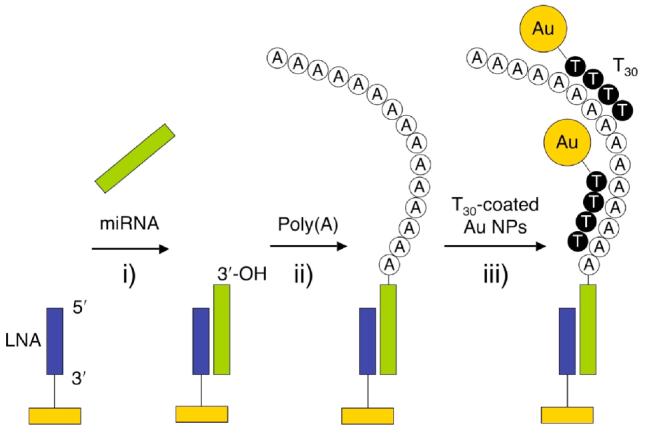
Schematic showing the detection of microRNAs using a combination of surface polyadenylation chemistry and nanoparticle amplified SPRI detection. (i) Hybridization adsoprtion of miRNA onto a complementary LNA array element, (ii) addition of poly(A) tails to the surface bound miRNAs using poly(A) polymerase and (iii) hybridization adsorption of T30-coated Au nanoparticles to poly(A) tails detected by SPRI measurements.
The first step in the miRNA detection process is the hybridization from a target solution onto a three-component microarray of complementary single stranded LNA 16mers. LNAs are nucleic acid analogues containing one or more nucleotide monomers where the ribose moiety is modified with an extra bridge connecting the 2′-O and 4′-C atoms, which are commercially available.9 The three LNA probes chosen for this array were 16mers designed to specifically bind to the known mouse miRNAs, miR-16, miR-122b and miR-23b.13 Hybridization adsorption of the miRNA to the LNA created an overhang at least 6 bases long at the 3′-OH end of the miRNAs; this overhang was required to ensure a high efficiency of the poly(A) reaction in step (ii). The adsorption of synthetic target miRNA from solutions ranging in concentration from 1 pM down to 10 fM was examined. Hybridization adsorption was allowed to proceed for ∼4 hours in a circulating 100 μL cell with a total volume of 500 μL sample solution. This reaction time is sufficient to reach a steady-state surface coverage of miRNA from femtomolar solutions given an miRNA hybridization adsorption rate constant of approximately 104 M−1s−1.10
Following hybridization adsorption, the surface-bound miRNA was then polyadenylated with poly(A) polymerase. To optimize the conditions for the surface enzyme reaction, we first used a high concentration (500 nM) target miRNA solution to follow the surface polyadenylation reaction with real time SPRI measurements. The changes in percent reflectivity (Δ%R) measured from the polyadenylation of miRNA adsorbed onto the LNA microarray are shown as a function of time in Figure 2. Note that the SPRI reflectivity increase is due to the surface polymerization reaction that forms poly(A) tails on the adsorbed miRNA array elements, not simple binding to the surface. The polymerization reaction data was fit to an exponential equation of the form R∞(1 – exp(−t/τ)) where R∞ represents the steady state value and τ is the time constant for this surface polymerization reaction. For the data in Figure 2, R∞ is 16.2% and τ is 460 s. These values were obtained using enzyme and ATP concentrations of 2.4 units/ml and 5 mM, respectively. These conditions were found to be optimal and used in all of the measurements reported in this paper. The number of adenosine residues added to the adsorbed miRNA can be estimated roughly by comparing the SPRI signal obtained from the hybridization adsorption of 500 nM 22mer miRNA (ΔR of 1.4%) to that obtained for poly(A) addition (ΔR of 16.2%). Using these two reflectivity values, we estimate that on average approximately 250 adenosine residues were added onto the hybridized miRNA sequences on the microarray surface.
Figure 2.
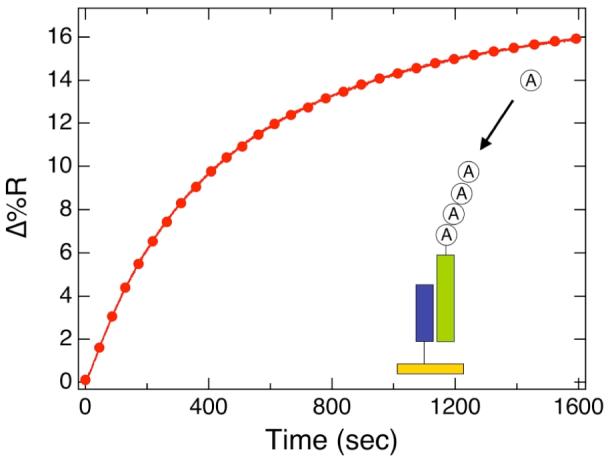
Real-time SPRI measurements of the polyadenylation of surface-bound target miRNA. A 500 nM solution of miR-16 was first hybridized onto complementary LNA microarray elements followed by surface polyadenylation, as depicted in the figure inset. The polyadenylation reaction solution contained a mixture of 2.4 units/μL yeast poly(A) polymerase and 5 mM ATP.
Having optimized conditions for the surface polyadenylation reaction, we proceeded to the direct detection of synthetic miRNAs at femtomolar concentrations using a combination of polyadenylation and nanoparticle amplification. After formation of the poly(A) tails, the arrays were exposed to a solution of T30-coated Au nanoparticles to further enhance the SPRI signal. The combined use of a surface enzyme reaction and nanoparticle enhancement with SPRI has also been recently reported for ultrasensitive single nucleotide polymorphism genotyping.11 The nanoparticle amplification step was characterized via a series of SPRI experiments at various RNA surface coverages. An optimal NP concentration of 10 nM was determined from these measurements. This value enabled us to measure fractional surface coverages (θ) from 10−4 to 10−6. Given a Langmuir adsorption constant of Kads = 108 M−1 and the relationship between θ and miRNA bulk concentration (C) described by θ = Kads*C at low concentrations, these surface coverages correspond to miRNA concentrations ranging from 1 pM down to 10 fM. (See the Supporting Information for further details on the RNA surface coverage measurements).
Figure 3 shows the results from a series of SPRI measurements for the detection of different synthetic miRNAs using three-component LNA microarrays. The synthetic miRNA targets (miR-16, miR-23b and miR-122b) used here are the same sequences as miRNAs found in total RNA samples extracted from mouse liver tissue.6 In Figure 3a, the three-component array was first used to detect a 200 fM solution of miR-122b. A significant ΔR of 3.1% was observed for the miR-122b LNA array elements. No non-specific adsorption was observed at either of the other two LNA array elements or the background. Next, a three-component array was exposed to a mixture of miR-23b and miR-16 each at a concentration of 50 fM. As shown in Figure 3b, a nearly identical signal (0.7%) was observed for both miRNA sequences. A detection limit of 10 fM was established using this amplification method (see the corresponding line profile in Figure 3c). In addition, a plot of the SPRI signal as a function of miRNA concentration is displayed in Figure 4. The SPR signal responded linearly for all three different synthetic miRNAs over a concentration range of 10 fM to 500 fM. Above a ΔR of 6%, the SPRI responsivity decreases as predicted by theory.14 For higher miRNA concentrations, the nanoparticle concentration can be reduced to bring the SPRI signal back into the linear response range. Above a miRNA concentration of 100 pM, no nanoparticle amplification is required.
Figure 3.
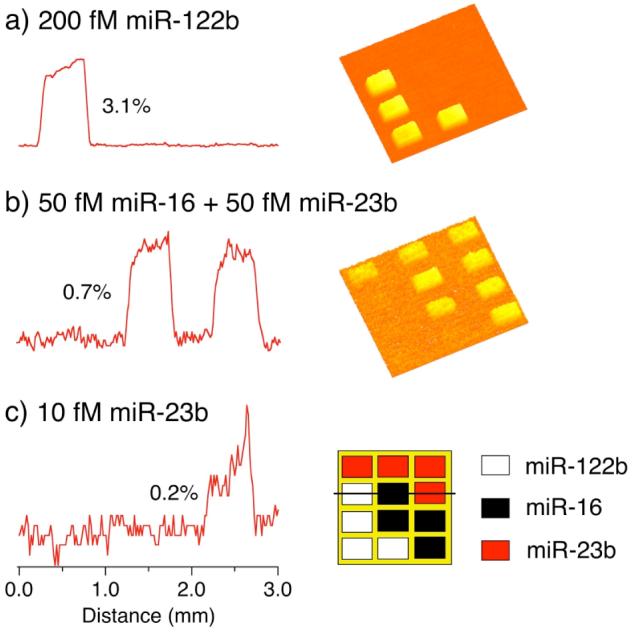
A series of SPR difference images and the corresponding line profiles obtained for the detection of (a) 200 fM miR-122b, (b) 50 fM miR-16 and 50 fM miR-23b, and (c) 10 fM miR-23b. A three-component LNA microarray was used with the pattern shown in the lower right of the figure. The three LNA probes were designed to specifically bind to miR-16, miR-122b and miR-23b, respectively. SPR difference images were obtained by subtracting images taken before and after exposure to a 10 nM solution of T30-coated Au nanoparticles. All miRNA and LNA sequences along with experimental details can be found in the Supporting Information.
Figure 4.
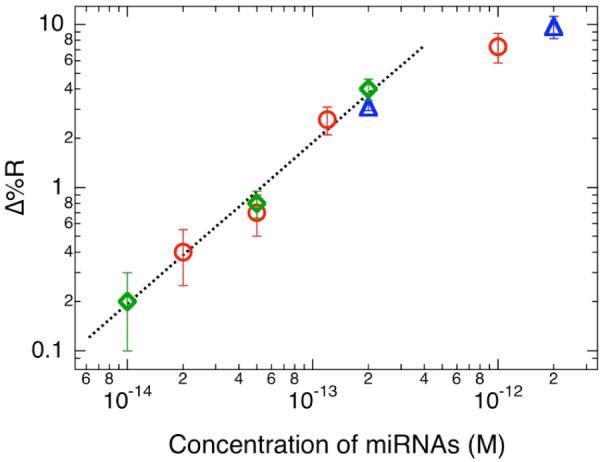
Plot of the polyadenylation-nanoparticle amplified SPRI response obtained at concentrations of miR-16 (○), miR-122b (◇) and miR-23b (△) ranging from 10 fM to 2 pM. The dotted line in the figure is used to indicate the concentration region over which the SPRI signal responds linearly.
A detection limit of 10 fM is significantly lower than that reported previously using other miRNA methods that employ a microarray format.5 Recently, a non-microarray format electrochemical method utilizing chemical ligation and electrostatically bound Os nanoparticles to detect miRNA at a concentration of 80 fM was demonstrated.15 The minimum amount of miRNA detected in our experiments was 5 attomoles (a 10 fM solution with a total volume of 500 μL). At present, a 5 attomole detection limit is about 50 times more sensitive than the fluorescence-based microarray detection method mentioned previously.5
In a final set of experiments, the surface polyadenylation-nanoparticle amplification scheme was employed to detect miRNA sequences in a total RNA sample extracted from mouse liver tissue. The presence of the three sequences, miR-16, miR-23b and miR-122b from mouse liver tissue has previously been reported.6 Details of the total RNA sample preparation and reaction conditions can be found in the Supporting Information. A four-component array was fabricated using three LNA probes designed to bind to miR-16, miR-122b, and miR-23b, with a DNA probe used as a negative control. Figure 5 shows (a) an SPR difference image along with a line profile (the solid line in (b)) obtained after the amplification step involving the adsorption of NPs onto the array. As reported previously,6 miR-122b was found to be the most abundant of the three miRNAs with a ΔR of 9.7% observed in the SPR difference image, while miR-23b and miR-16 were present at much lower levels with a ΔR of 0.8% and 0.4% obtained respectively.
Figure 5.
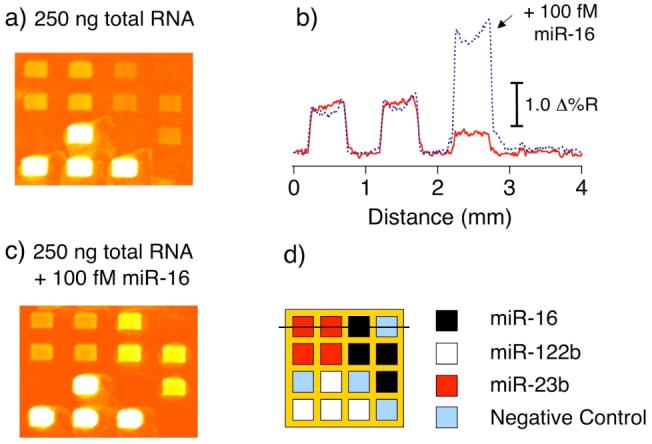
Detection of miRNAs from 250 ng of mouse liver total RNA via polyadenylation-nanoparticle amplified SPRI measurements. An SPR difference image (a) was obtained by subtracting images acquired before and after the final nanoparticle amplification step. (b) A line profile taken across the image (a) is shown as a solid line. (c) An SPR difference image obtained from a separate chip using the same total RNA concentration as in (a) with the addition of 100 fM synthetic miR-16. For comparison, a separate line profile taken across the image in (c) is also plotted in (b) as a dashed line. (d) Schematic of the four-component microarray pattern and line profile location.
The amount of miRNAs in the total RNA sample were estimated using the calibration curve in Figure 4 to be 20 fM, 50 fM and 2 pM for miR-16, miR-23b and miR-122b respectively. The amount of miR-16, the miRNA with the lowest concentration, was further verified as 20 fM by the addition of 100 fM synthetic miR-16 to the total RNA sample. The SPR difference image and line profile from this sample are displayed in Figure 5b and c.
This data shows that our enzymatically amplified SPRI methodology can be used to quantitatively measure miRNAs in total RNA samples down to femtomolar concentrations. The excellent sensitivity of these measurements arise from the combined use of surface enzyme chemistry and DNA-coated nanoparticles. The use of a surface-based enzyme amplification strategy to form the poly(A) tail greatly simplifies the removal of reactants and reagents from the miRNA, and allows for the binding of multiple DNA-coated nanoparticles to a single miRNA adsorption site. For comparison, SPRI measurements have been used to directly detect the adsorption of unlabeled RNA onto DNA microarrays down to a concentration of 1 nM.14 The 10 fM detection limit demonstrated in this paper represents a remarkable 105 signal enhancement, which corresponds to the detection of a miRNA fractional surface coverage of 10−6.10 Future work will focus on the implementation of larger microarrays for the complete profiling of miRNA in biological samples.
Supplementary Material
Acknowledgment
This research was supported by the National Institute of Health (2RO1 GM059622-04) and the National Science Foundation (CHE-0551935).
Footnotes
Supporting Information Available: Details of materials and methods used in this study. This material is available free of charge via the Internet at http://pubs.acs.org.
References
- 1.Bartel D. Cell. 2004;116:281–297. doi: 10.1016/s0092-8674(04)00045-5. [DOI] [PubMed] [Google Scholar]
- 2.Carthew RW. Curr. Opin. Genet. Dev. 2006;16:203–208. doi: 10.1016/j.gde.2006.02.012. [DOI] [PubMed] [Google Scholar]
- 3.Zamore PD, Haley B. Science. 2005;309:1519–1524. doi: 10.1126/science.1111444. [DOI] [PubMed] [Google Scholar]
- 4.Chen C, Ridzon DA, Broomer AJ, Zhou Z, Lee DH, Nguyen JT, Barbisin M, Xu NL, Mahuvakar VR, Andersen MR, Lao KQ, Livak KJ, Guegler KJ. Nucleic Acids Res. 2005;33:e179. doi: 10.1093/nar/gni178. [DOI] [PMC free article] [PubMed] [Google Scholar]
- 5.Shingara J, Keiger K, Shelton J, Laosinchai-Wolf L, Powers P, Conrad R, Brown D, Labourier E. RNA. 2005;11:1461–1470. doi: 10.1261/rna.2610405. [DOI] [PMC free article] [PubMed] [Google Scholar]
- 6.Babak T, Zhang W, Morris Q, Blencowe BJ, Hughes TR. RNA. 2004;10:1813–1819. doi: 10.1261/rna.7119904. [DOI] [PMC free article] [PubMed] [Google Scholar]
- 7.Nelson PT, Baldwin DA, Scearce LM, Oberholtzer JC, Tobias JW, Mourelatos Z. Nat. Methods. 2004;1:155–161. doi: 10.1038/nmeth717. [DOI] [PubMed] [Google Scholar]
- 8.Liang R, Li W, Li Y, Tan C, Li J, Jin Y, Ruan K. Nucleic Acids Res. 2005;33:e17. doi: 10.1093/nar/gni019. [DOI] [PMC free article] [PubMed] [Google Scholar]
- 9.Castoldi M, Schmidt S, Benes V, Noerholm M, Kulozik AE, Hentze MW, Muckenthaler MU. RNA. 2006;12:913–920. doi: 10.1261/rna.2332406. [DOI] [PMC free article] [PubMed] [Google Scholar]
- 10.Lee HJ, Wark AW, Corn RM. Langmuir. 2006;22:5241–5250. doi: 10.1021/la060223o. [DOI] [PMC free article] [PubMed] [Google Scholar]
- 11.Li Y, Wark AW, Lee HJ, Corn RM. Anal. Chem. 2006;78:3158–3164. doi: 10.1021/ac0600151. [DOI] [PMC free article] [PubMed] [Google Scholar]
- 12.He L, Musick MD, Nicewarner SR, Salinas FG, Benkovic SJ, Natan MJ, Keating CD. J. Am. Chem. Soc. 2000;122:9071–9077. [Google Scholar]
- 13. www.sanger.ac.uk.
- 14.Nelson BP, Grimsrud TE, Liles MR, Goodman RM, Corn RM. Anal. Chem. 2001;73:1–7. doi: 10.1021/ac0010431. [DOI] [PubMed] [Google Scholar]
- 15.Gao Z, Yang Z. Anal. Chem. 2006;78:1470–1477. doi: 10.1021/ac051726m. [DOI] [PubMed] [Google Scholar]
Associated Data
This section collects any data citations, data availability statements, or supplementary materials included in this article.