

Abstract
It is well established that a lack of social support constitutes a major risk factor for morbidity and mortality, comparable to risk factors such as smoking, obesity, and high blood pressure. Although it has been hypothesized that social support may benefit health by reducing physiological reactivity to stressors, the mechanisms underlying this process remain unclear. Moreover, to date, no studies have investigated the neurocognitive mechanisms that translate experiences of social support into the health outcomes that follow. To investigate these processes, thirty participants completed three tasks in which daily social support, neurocognitive reactivity to a social stressor, and neuroendocrine responses to a social stressor were assessed. Individuals who interacted regularly with supportive individuals across a ten-day period showed diminished cortisol reactivity to a social stressor. Moreover, greater social support and diminished cortisol responses were associated with diminished activity in the dorsal anterior cingulate cortex (dACC) and Brodmann's area (BA) 8, regions previously associated with the distress of social separation. Lastly, individual differences in dACC and BA 8 reactivity mediated the relationship between high daily social support and low cortisol reactivity, such that supported individuals showed reduced neurocognitive reactivity to social stressors, which in turn was associated with reduced neuroendocrine stress responses. This study is the first to investigate the neural underpinnings of the social support-health relationship and provides evidence that social support may ultimately benefit health by diminishing neural and physiological reactivity to social stressors.
Introduction
Animal and human research has consistently demonstrated that supportive social contact enhances physical health while a lack thereof increases the risk of morbidity and mortality. Indeed, an absence of social relationships constitutes a major risk factor for mortality, comparable to other risk factors such as smoking, obesity, and high blood pressure (House et al., 1988). For example, in a study investigating the impact of social relationships on longevity, individuals with fewer social ties were 2-3 times more likely to die during a 9-year assessment period (Berkman and Syme, 1979).
Despite the robust relationship between social support and health, the mechanisms underlying this relationship remain unknown and the neurocognitive mechanisms, in particular, have been largely unexplored in humans. One hypothesis, which has garnered some support, is that social support reduces physiological stress reactivity to threatening situations, which, over time, can have deleterious health consequences (Uchino et al., 1996). The body responds to stressors, in part, by activating the hypothalamic-pituitary-adrenocortical (HPA) axis, which results in the release of cortisol, a neuroendocrine stress hormone that acts to mobilize energy resources. Although adaptive in the short-run, continuous activation of the HPA axis can be harmful to health (McEwen, 1998). Among other costs, cortisol has immunosuppressive effects, increasing vulnerability to infection and infectious diseases (Ader et al., 1991).
Although much of the work on stress reactivity has focused on the role of the HPA axis in inducing physiological stress responses, other neural regions are likely to play a role in modulating stress reactivity as a function of social support. As proposed by Cohen and Wills (1985), social support may modulate stress reactivity at two different point in the chain of events that lead from potential stressors to physiological stress responses. First, social support may alter the appraisal or perception of potentially threatening conditions such that they are no longer perceived as stressful. Thus, feeling supported and cared for may lead an individual to be less likely to appraise certain conditions as threatening, thus preventing the onset of physiological stress reactivity. To the extent that social support downregulates threat-related reactivity, social support may be associated with less activity in limbic structures that are typically involved in responding to negative or threatening experiences, such as the amygdala, insula, or anterior cingulate cortex (ACC).
The amygdala responds to dangerous or threatening stimuli (Davis and Whalen, 2001) and has robust connections with the paraventricular nucleus (PVN) of the hypothalamus (Risold et al., 1997; Saphier and Feldman, 1986), which triggers the eventual release of cortisol, implicating the amygdala in the facilitation of physiological stress responses. The insula is thought to be involved in processing visceral sensation (Aziz, Schnitzler, & Enck, 2000; Cechetto & Saper, 1987) as well as negative affective states, such as disgust (Phan et al., 2004; Phillips et al., 1997). The insular cortex also has projections to the central nucleus of the amygdala and lateral hypothalamus and thus may play a role in the physiological responses that accompany emotional experience (Davidson and Irwin, 1999). Likewise, the ACC, depending on the location of activity, is involved in both affective experience and stress-related physiological responses. The dorsal portion of the ACC (dACC) has been shown to be involved in the distressing experience associated with physical pain (Rainville et al., 1997), social exclusion (Eisenberger et al., 2003), anxiety (Kimbrell et al., 1999; Wang et al., 2005), and perceived stress (Wang et al., 2005). The subgenual portion of the ACC (subACC) has been shown to be involved in the experience of sadness and is altered in individuals with depression (Mayberg et al., 1999; Phan et al., 2002). Although the subACC is more densely interconnected with regions of the PVN (Ongur, An, & Price, 1998), electrical stimulation to either the dACC or subACC (but not the pregenual ACC (pACC), the portion of the ACC anterior to the genu of the corpus callosum; Vogt, 2005) results in cortisol increases (Frankel et al., 1978; Setekleiv et al., 1961) and thus implicates these regions in stress-related physiological responding as well. Moreover, the ACC may be particularly important for the stress-protective effects of social support as this region is activated in response to maternal-infant separation in non-human mammals (Kirzinger and Jurgens, 1982; MacLean & Newman, 1988; Smith, 1945) and thus greater activity in this region may signify an absence of supportive others.
The second point at which social support may reduce physiological stress reactivity is after an event has been appraised as stressful but prior to the onset of prolonged physiological stress responses. Thus, individuals with greater social support may be better able to cope with or regulate negative stressful experiences, leading to reduced physiological stress responses through reappraisal or regulatory processes. To the extent that social support is important for regulating negative responses to stressors, social support may relate to increased activity in regions that are typically involved in regulating negative affect, such as ventrolateral and medial prefrontal cortex (VLPFC; MPFC; Ochsner & Gross, 2005).
VLPFC has been shown to play a role in regulating the distress of physical pain and negative affect (Hariri et al., 2000; Lieberman et al., 2004; Lieberman, et al., in press; Ochsner et al., 2004; Petrovic and Ingvar, 2002). MPFC appears to play a similar role, showing greater activation when individuals regulate, reappraise, or suppress negative emotional states (Phan et al., 2005; Urry et al., 2006). In addition, some have suggested that the ACC may also play a role in emotion regulatory processes (Ochsner et al., 2002; Phillips et al., 2003). Several of these studies seem to implicate the pACC as involved in regulatory processes (Das et al., 2005; Most et al., 2006), although some implicate regions of the dACC (Ochsner et al., 2002) and subACC (Kim et al., 2003; Phelps et al., 2004) as well. Thus, to the extent that social support relates to reduced physiological stress reactivity through enhanced regulatory capacity, social support should recruit greater activity in regions of the VLFPC, MPFC, and possibly ACC.
To investigate the types of neural processes that underlie the stress-protective effects of social support, we investigated how daily levels of social support related to both neurocognitive and cortisol reactivity to a social stressor. To assess daily levels of social support, participants completed a signal-contingent daily experience-sampling task, in which they were loaned a PalmPilot device and, for ten days, were signaled at random times during the day to report on the degree to which their most recent interaction partner was someone they perceived to be generally supportive. To assess neural reactivity to social rejection, participants completed the Cyberball task within the fMRI scanner (Eisenberger et al., 2003), a virtual ball-tossing game in which participants were excluded partway through the game. To assess cortisol reactivity to a social stressor, all participants completed the Trier Social Stress Task (TSST; Kirschbaum et al., 1993), a task that requires participants to deliver an impromptu speech and perform mental arithmetic aloud in front of a non-responsive, rejecting panel, and, in a meta-analysis, has been shown to reliably elicit cortisol responses (Dickerson and Kemeny, 2004).1
We hypothesized that greater daily social support would be associated with reduced cortisol responses to the TSST, consistent with the notion that social support reduces physiological stress reactivity. We then examined the neural processes related to this social support-cortisol relationship. To the extent that social support relates to attenuated cortisol reactivity through reduced emotional reactivity to stressors, we expected that greater social support and the associated reductions in cortisol responses would be related to reduced activity in limbic regions such as the amygdala, insula, and ACC during social exclusion. Conversely, to the extent that social support relates to attenuated cortisol reactivity through enhanced emotion regulatory processes, we expected that greater social support and the associated reductions in cortisol responses would be related to greater activity in PFC regions involved in regulation, such as VLPFC and MPFC, and possibly regions of the ACC during social exclusion. Last, based on a large body of knowledge relating the hypothalamus to cortisol responses, we also examined the relationships between hypothalamic activity and both social support and cortisol reactivity.
Materials and Methods
Participants
Prospective participants responded to an ad posted around the UCLA campus, offering $60 in return for participating in the stress challenge component of the study (the TSST). Prospective participants completed a structured phone interview in which they were asked questions about their mental and physical health (e.g., whether a mental health professional had ever diagnosed them with an emotional disorder, whether they were seeing a mental health counselor for any disorder, whether they were currently taking any medications). Prospective participants were excluded if they had serious mental or physical health problems, used medications affecting cardiovascular or endocrine function, received current treatment from a mental health professional, used mental health-related medications (e.g., Prozac), or were pregnant or breast-feeding. One hundred twenty five participants (54 males and 71 females) completed the stress challenge component of the study. All were affiliated with UCLA as students, employees, or both. Participants ranged in age from 18 to 36, with a mean age of 21.3 years. The sample was 31.9% European-American, 32.6% Asian American, 10.4% Hispanic/Latino, 3.7% African American, 6.7% Middle Eastern, 6.5% “mixed” or other, and 8.1% unspecified, a pattern that reflects the composition of the UCLA community.
Participants from this larger stress challenge study, who indicated that they were willing to be re-contacted, were then emailed to see if they were interested in completing additional studies. Of those who completed the stress challenge component, thirty-two participants (19 women), aged 18-36 (mean = 20.59, SD = 3.17; Male: mean = 21.54, SD = 4.65; Female: mean = 19.95, SD = 1.35), participated in both the daily-experience sampling component and the fMRI component for an additional $60. These individuals met the following fMRI-related inclusion criteria: they were right-handed, not claustrophobic, and had no metal in their bodies (dental fillings were allowed) or other conditions that prevented them from being scanned (e.g., pacemaker). The ethnic breakdown was similar to that of the larger sample (28.1% European-American, 40.6% Asian American, 15.6% Hispanic/Latino, 6.3% African American, and 9.4% other). All experimental procedures were approved by the UCLA Human Subjects Protection Committee.
Procedure
Daily experience-sampling methodology
To assess social support during daily social interactions, participants were loaned a PalmPilot device running the Experience Sampling Program (Barrett and Barrett, 2001), which administered the relevant questions. Over the course of a ten-day period, participants were randomly signaled at different times during the day to answer questions on a PalmPilot regarding the supportiveness of their most recent social interaction partner.2
Participants were given a limited amount of time to respond to each signal, and if they did not respond during that time, the PalmPilot turned off. If participants responded to a signal within the time window, they were first asked whether they were able to complete an interaction entry; if the participant answered no, the PalmPilot turned off. If they answered yes, they were then asked if they had had a new interaction since the last signal. If the participant answered no, the questionnaire ended; if the participant answered yes, the participant completed the questionnaire and could not return to previously-answered questions. Again, if participants did not respond to a question item within a certain time window, the PalmPilot turned off, preventing participants from returning to a questionnaire at a later point in time.
Participants were informed that they could turn the volume off on the PalmPilot when they couldn't be disturbed, such as while driving, during class, or in important meetings. Additionally, the PalmPilot was set so that it would signal participants only during hours when they reported they would typically be awake. Because participants were told that they could turn off the volume on the PalmPilot when they could not be disturbed, participants were signaled more frequently to ensure that enough assessments were collected when the PalmPilot's volume was on. In order to obtain approximately four daily assessments, the PalmPilots were set to go off at eight different times during the day (regardless of when the volume was on or off). Similar techniques have been validated and used widely (Reis and Gable, 2002).
To assess general feelings of social support, participants were asked to rate, on a 7-point scale, the extent to which their most recent interaction partner was someone that they perceived to be generally “not close to me (1) or close to me (7),” “threatening (1) or comforting (7),” or “unsupportive (1) or supportive (7).” Note that this was not a measure of how supportive the interaction partner was in this most recent interaction, but rather how supportive the interaction partner is typically. A measure of daily social support was generated by calculating average levels of closeness, comfort, and support for each subject across the ten-day period. The reliability of this measure was strong (α = .78).
Participants responded to an average of 4 (SD = 1.22) signals per day. Of these 4 signals, participants reported that they could not complete approximately one of the signals (M = 0.7, SD = 0.76) and that they had had no new interaction on approximately 1 signal (M = 0.7, SD = 0.69). On average, they completed approximately 2.5 assessments of social support per day (SD = 1.21). Neither overall compliance (responding to the PalmPilot device) nor the number of social support ratings made per day was significantly associated with self-reported levels of social support (p's>.4).
Cyberball methodology
Participants completed the Cyberball task (Williams et al., 2000) in the fMRI scanner approximately one week following the daily experience-sampling task (none of the these participants had been in the previous Cyberball study; Eisenberger et al., 2003). fMRI scans were acquired while participants played a virtual ball-tossing game, supposedly with two other individuals; in reality, participants played with a preset computer program. Each game began with a still picture of the two virtual players in the upper corners of the screen and a hand, representing the participant, in the lower-center portion of the screen. The participant's name was displayed below the hand while two other names were displayed below each of the two virtual players' animated cartoon representations. After 9s, the cartoon player in the upper left-hand corner started the game by throwing the ball to either the other cartoon player or the participant. The participant could return the ball to one of the players by pressing one of two keys. The Cyberball program was set for 60 throws per game, with the computer players waiting 0.5-3.0 seconds (determined randomly) before making a throw to heighten the sense that the participant was actually playing with other individuals.
Participants completed two rounds of the Cyberball game. In the first scan (inclusion), participants played with the two other players for the entire duration of the game (approximately 140 seconds), with each virtual player throwing the ball to the participant on approximately 50% of the throws. In the second scan (exclusion), participants only received the ball for a total of seven throws (lasting approximately 50 seconds) and were then excluded for the rest of the scan when the two players stopped throwing the ball to the participant (60-90 seconds)3. Immediately following the scanning session, participants completed a measure of self-reported social distress (Williams et al., 2000), which assessed participants' feelings of self-esteem (e.g., “I felt liked.”), belongingness (e.g., “I felt rejected.”), meaningfulness (e.g., “I felt invisible.”), and control (e.g., “I felt powerful.”).
fMRI methodology
Data were acquired on a Siemens Allegra 3T head-only scanner. High-resolution structural T2-weighted echo-planar images (spin-echo; TR=5000ms; TE=33ms; matrix size 128×128; 36 axial slices; FOV = 20-cm; 3-mm thick, skip 1-mm) were acquired coplanar with the functional scans. Prior to completing the Cyberball task, participants completed two other tasks in the fMRI scanner that are not relevant to the present investigation and are thus reported elsewhere. During the Cyberball task, two functional scans, each lasting 2 minutes and 30 seconds, were acquired (echo planar T2*-weighted gradient-echo, TR=3000ms, TE=25ms, flip angle=90°, matrix size 64×64, 36 axial slices, FOV=20-cm; 3-mm thick, skip 1-mm). Participants viewed stimuli through goggles connected to a computer.
The imaging data were analyzed using SPM'99 [Wellcome Department of Cognitive Neurology, Institute of Neurology, London, UK]. Images for each subject were realigned to correct for head motion, normalized into a standard stereotactic space, and smoothed with an 8mm Gaussian kernel, full width at half maximum, to increase signal-to-noise ratio. The design was modeled using a boxcar function convolved with a canonical hemodynamic response function. For each participant, periods of inclusion and exclusion were modeled as epochs based on the length of that participant's inclusion and exclusion episodes, which were individually timed (these varied slightly between participants due to the random delay assigned to the virtual players when throwing the ball). Thus, neural activity during the inclusion and exclusion episodes was an average of the sustained neural activity that occurred during each of those episodes (punctate neural responses to the moment of exclusion could not be assessed with this block design).
After the task was modeled for each participant, planned comparisons were computed as linear contrasts to investigate neural activity during the exclusion compared to the inclusion episode. Random effects analyses of the group were computed using the contrast images generated for each participant. The correction for multiple comparisons was carried out using an uncorrected p-value of .005 combined with a cluster size threshold of 10 voxels (Forman et al., 1995), a threshold that we have used regularly in previous investigations (Eisenberger et al., 2003; Eisenberger et al., in press; Lieberman et al., 2005; Lieberman et al., in press). All coordinates are reported in Montreal Neurological Institute (MNI) coordinate space. Two participants were excluded from the neuroimaging analyses: one due to excessive motion and one due to prior experience with the Cyberball task.
Cortisol assessment to a social stressor
To assess cortisol reactivity to a social stressor, all participants completed the TSST (Kirschbaum et al., 1993) prior to the daily experience-sampling and neuroimaging tasks. Participants were scheduled for an experimental session in the afternoon (1-3PM or 3-5PM) to control for diurnal variations in neuroendocrine parameters and because afternoon sessions have been associated with greater cortisol increases (Dickerson and Kemeny, 2004).
Participants were told that they would be giving a 5-minute speech, in which they would introduce themselves and then describe “why I would be an ideal administrative assistant.” They were told that they would be evaluated by a panel of their peers and that their speech would be videotaped so that it could be evaluated by a panel of experts as well. They were also told that following the speech task, they would be completing an arithmetic task for five minutes.
After receiving the standardized instructions, participants were given 5 minutes to prepare their speeches and then 5 minutes to present their speeches. Speeches were given to a panel of two non-responsive student evaluators (both female confederates) and participants were videotaped. After completing the 5-minute speech task, participants completed the mental arithmetic task, in which they were asked to count backwards from 2083 by 13s in front of the panel as well. Participants were told that if they made any mistakes, they would have to start over again from the beginning. The mental arithmetic task lasted for 5 minutes and participants were asked to go more quickly at one-minute intervals.
Cortisol levels were assessed at baseline (10 minutes after entering the laboratory), which was approximately forty minutes before the stress task, and again at approximately 20 minutes after the initiation of the stress tasks, in accordance with when cortisol shows peak increases following a stressor (Dickerson and Kemeny, 2004). After providing the baseline cortisol sample, participants responded to a brief set of interview questions about their home life, friendships, romantic relationships, work and hobbies, material that is part of a separate study and is thus not part of the present analyses. After this, participants were familiarized with the laboratory procedures (e.g., stress task instructions) and then began the stress challenge portion of the study. Each time cortisol was assessed, participants rolled a sterile cotton swab in their mouth for one minute and forty-five seconds and then placed the swab in a Salivette® salivary collection tube (Sarstedt, Inc., North Carolina). Saliva samples were immediately placed on ice and transferred within the next few minutes to a freezer. In addition, heart rate and blood pressure were assessed at two-minute intervals throughout the course of the study. The results of these analyses will be detailed in a separate report.
To calculate cortisol reactivity, cortisol measures were first log-transformed to correct for non-normality, and a measure of percentage increase was calculated by subtracting baseline log-transformed cortisol from post-task log-transformed cortisol and dividing this difference by the log-transformed baseline measure. In addition, because men showed a significantly greater percentage increase in cortisol than women to this task (t(28)=2.38, p<.05), gender was covaried out of the cortisol reactivity measure.4
Salivary cortisol assay procedures
Saliva samples were shipped for overnight delivery on dry ice to the Behavioral Endocrinology Laboratory at Pennsylvania State University where the cortisol assays were conducted. Salivary cortisol levels were determined from a 25-μl sample, which was assayed in duplicate by radioimmunoassay using the HS-cortisol High Sensitivity Salivary Cortisol Enzyme Immunoassay Kit (Salimetrics LLC, State College, PA). The HS-Cortisol Assay allows for robust results when the saliva samples have a pH within the range of 3.5-9.0. All samples were within this pH range. Due to errors in the assay procedures, cortisol levels were not provided for two of the thirty participants.
Self-reported responses to the TSST
Following the completion of the TSST, participants completed several self-report measures that assessed levels of perceived stress. Participants rated the degree to which they felt 16 specific emotions (e.g., “afraid,” “angry,” “anxious,” “contemptuous”) during the TSST on a scale ranging from 0-“did not feel even the slightest bit” to 8-“most you have ever felt in your life.” A general measure of negative affect was then computed by taking the average of all of the negative items and the reverse-coded positive items. This scale demonstrated strong reliability (α = .80). We also created a measure of anxiety/irritability, as a more stress-specific measure of affect, by averaging scores on the relevant items (“anxious,” “nervous,” “frustrated,” “irritable”). This subscale also demonstrated strong reliability (α = .83).
Participants were also asked to estimate their heart rates during the speech and arithmetic tasks (these ratings were made after the completion of these tasks). Participants were told what their lowest resting heart rate was at the beginning of the study (prior to the stress challenge component). They were then asked to give their “best guess” of their actual heart rate during the speech task as well as their “best guess” of their actual heart rate during the math task. Heart rate estimates from the speech and math tasks were averaged together and percentage increase scores were computed by subtracting baseline values from this average estimate and dividing this difference by the baseline value.
Analytic strategy
To assess the relationship between daily social support and cortisol reactivity to a social stressor, simple correlations were computed. To identify candidate neural regions that might mediate the relationship between daily levels of social support and cortisol reactivity to a social stressor, two procedures were employed. First, we used whole-brain analyses to identify neural regions that correlated with daily levels of social support. Thus, measures of social support were entered as regressors into a random effects group analysis, comparing neural activity during the exclusion, relative to the inclusion, episode (p<.005, 10-voxel extent threshold). We then extracted parameter estimates (i.e., betas) from the maximally active voxel in these regions and examined whether this activity correlated with cortisol reactivity at a standard statistical threshold (p<.05). The conjunctive probability of these two events (i.e., a cluster being significant in both of these analyses) is p<.00025 (i.e., .005 × .05), uncorrected for multiple comparisons, and is thus more conservative than the p<.001, uncorrected threshold that is commonly used in fMRI studies.
Second, we repeated this analysis in the reverse direction. Thus, measures of cortisol reactivity were entered as regressors into a whole-brain analysis comparing exclusion to inclusion (p<.005, 10-voxel extent threshold), and relevant activations were examined to see if they correlated with social support at a standard statistical threshold (p<.05). Any regions that survived these analyses, were then examined to see if they mediated the relationship between social support and cortisol reactivity using standard mediational procedures (MacKinnon et al., 2002). In addition, based on previous research showing that women evidence greater cortisol responses to social stressors than men (Stroud et al., 2002), we also examined gender differences in all of the reported analyses.
Results
Self-Report and Cortisol Responses to the TSST
Self-reported responses to the TSST
On average, participants reported feeling stressed by the TSST. Participants reported feeling a significant level of general negative affect in response to the TSST (M = 3.48, SD = .98 on a scale ranging from 0-“did not feel even the slightest bit” to 8-“most you have ever felt in your life;” t(31) = 20.06, p < .001 when comparing mean scores with zero, as affect measures were not assessed prior to the TSST). With regard to the more specific measure of anxiety and irritability (“anxious,” “nervous,” “irritable,” “frustrated), participants also reported feeling a significant amount of anxiety and irritability following the TSST (M = 4.33, SD = 1.67; t(31) = 14.63, p < .001 when comparing mean scores with zero). In addition, participants reported that they perceived that their heart rate increased by approximately 52% (SD = .36) in response to the TSST. This self-reported increase in heart rate symptoms was significantly greater than zero (t(31) = 8.17, p < .001). These results indicate that participants found the TSST subjectively distressing.
Cortisol responses to the TSST
A repeated-measures analysis indicated that participants showed a significant increase in cortisol levels from baseline (M = .23 μg/dl, SD = .17) to post-task assessments (M = .30 μg/dl, SD = .19; F(1,28) = 5.57, p < .05). This effect remained the same after log-transforming the cortisol values to correct for non-normality (F(1,28) = 6.44, p < .05). However, there was a significant gender by time interaction in cortisol reactivity to the TSST (F(1,28) = 7.93, p < .01), such that men showed a significantly greater increase in cortisol responses than females. In addition, females showed marginally higher baseline cortisol levels than males (t(29) = -1.71, p = .10).
As noted earlier, because cortisol responses differed significantly by gender, gender was covaried out of the final cortisol reactivity measure. In addition, because cortisol responses were not normally distributed, baseline and post-task cortisol measures were first log-transformed before computing percentage increase scores. Percentage increase scores were created by subtracting baseline from post-task cortisol measures and then dividing this difference by the baseline measure. Finally, there were no significant correlations between this measure of percentage increase in cortisol and self-reported responses to the TSST (negative affect, anxiety/irritability, perceived heart rate increase; all p's>.16).
Social Support and Cortisol
Individuals who interacted with more supportive individuals on a daily basis showed significantly lower cortisol responses during the laboratory stress task (r=-.44, p<.05; Figure 1). These findings extend previous research, which has examined social support's modulation of cortisol reactivity (Kirschbaum et al., 1995), by showing that social support is associated with reduced cortisol reactivity to a social stressor without supportive others being physically present. There were no significant gender differences in the amount of daily social support that participants reported (t(29) = .08, ns) or in the relationship between daily social support and cortisol reactivity (p >.25).
Figure 1.
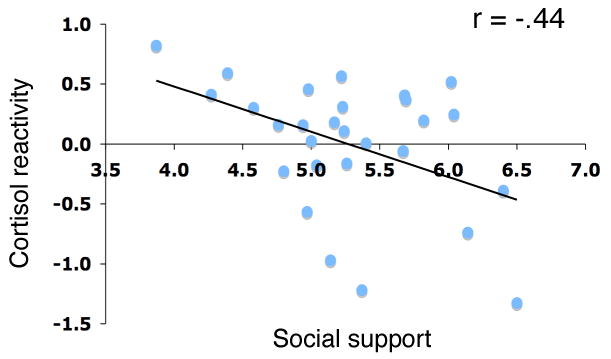
Scatterplot showing the relationship between daily social support and cortisol reactivity (percentage increase in log-transformed cortisol levels (peak minus baseline cortisol levels, divided by baseline levels), controlling for gender) during the Trier Social Stress Task. Each point represents the data from a single participant.
Neural Responses to the Cyberball Task
To examine whether neural responses to the Cyberball task replicated our previous findings (Eisenberger et al., 2003), we examined both main effect and correlational analyses. Specifically, we examined: a) whether participants showed greater activity in the dACC and right ventral PFC (RVPFC) during exclusion compared to inclusion and b) whether activity in these neural regions correlated with self-reports of social distress in response to the exclusion episode. Although we did not find main effects of dACC or RVPFC activity during exclusion relative to inclusion5, we did find significant relationships between social distress and these neural regions.
Replicating our previous results, greater activity in several regions of the dACC (during exclusion vs. inclusion) was associated with greater self-reported social distress in response to the exclusion episode (dACC1: 6,36,32, t = 4.43, r = .64, p < .005; dACC2: -10,38,24, t = 4.00, r = .60, p <.005; dACC3: -8,30,38, t = 3.88, r = .59, p < .005; dACC4: 10,26,18, t = 3.82, r = .59, p < .005; dACC5: -6,12,32, t = 3.06, r =.50, p < .005). One of these dACC activations (dACC3) was similar to an activation that correlated with social distress in the previous study (-4,30,46). Also consistent with previous results, greater RVPFC activity (during exclusion vs. inclusion) was associated with lower self-reported social distress (42,46,-4, t = 2.42, r = -.52, p < .005). This region of RVPFC was more lateral than the region of RVPFC that correlated with social distress in the previous study (30,34,-4); however both of these regions fell within a functionally similar neural region (BA 47), which has been shown to be involved in inhibitory control and affect regulation (Aron, Robbins, & Poldrack, 2004; Lieberman et al., in press; Ochsner et al., 2004). Interestingly, greater activity in the vicinity of the hypothalamus was also associated with greater self-reported social distress (10,-4,-4, t=4.18, r = .62, p<.005), a finding that was not previously observed. Similar to our previous results, there were no significant correlations between self-reported social distress and either amygdala, subACC, or insula activity in the present sample. In addition, there were no gender differences in the magnitude of dACC or RVPFC responses to exclusion vs. inclusion or in the relationships between self-reported social distress and either dACC or RVPFC activation.
Social support, Cortisol, and Neural Activity
In order to examine which neural regions correlated with both social support and cortisol responses, two procedures were employed. First, measures of daily social support were entered as regressors into whole-brain analyses, comparing neural activity during exclusion vs. inclusion (p<.005, 10 voxels), and then significant activations were examined to see if they correlated with cortisol responses at a standard statistical threshold (p<.05). Social support did not correlate positively with any neural activity; however, higher levels of social support were associated with less neural activity across several regions (Table 1a). Of these regions, the only regions where activity also correlated significantly with cortisol reactivity at a standard statistical threshold (p<.05) were the dACC and a region of Brodmann's area (BA) 8 in the dorsal superior frontal gyrus.
Table 1.
Regions correlated with social support or cortisol responses in whole brain analyses. (a) Regions correlated with social support during exclusion compared to inclusion. (b) Regions correlated with cortisol responses during exclusion compared to inclusion. Abbreviations: dACC (dorsal anterior cingulate cortex); PAG (periaqueductal gray); BA (Brodmann's area); SMA (supplementary motor area); DMPFC (dorsomedial prefrontal cortex); PPC (posterior parietal cortex); VLPFC (ventrolateral prefrontal cortex); VPFC (ventral prefrontal cortex)
| Region | MNI Coordinates | Cluster size (k)* | t-stat | r | ||
|---|---|---|---|---|---|---|
| (b) Regions negatively correlated with social support | ||||||
| dACC | 14 | 30 | 38 | 13 | 3.25 | -0.52 |
| BA 8 | -22 | 38 | 40 | 59 | 3.37 | -0.54 |
| Thalamus | 16 | -24 | 2 | 108 | 3.38 | -0.54 |
| Caudate | -14 | 22 | -2 | 27 | 3.58 | -0.56 |
| BA 20 | 50 | -20 | -24 | 20 | 3.26 | -0.52 |
| PAG | -4 | -32 | -4 | 26 | 3.57 | -0.56 |
| (b) Regions positively correlated with cortisol responses | ||||||
| BA 8 | -22 | 40 | 42 | 82 | 3.55 | 0.57 |
| BA 8 | -42 | 26 | 40 | 404 | 4.56 | 0.67 |
| SMA | -12 | 32 | 56 | 109 | 3.21 | 0.53 |
| DMPFC (BA 8) | -10 | 50 | 44 | 16 | 3.37 | 0.55 |
| Hippocampus | 18 | -18 | -12 | 48 | 3.71 | 0.59 |
| Posterior cingulate | -2 | -24 | 34 | 58 | 3.77 | 0.59 |
| PPC | -40 | -58 | 58 | 83 | 3.83 | 0.60 |
| PPC | 48 | -52 | 54 | 101 | 3.46 | 0.56 |
| VLFPC | -38 | 24 | -22 | 40 | 3.40 | 0.55 |
| BA 10 | -30 | 56 | 2 | 10 | 3.11 | 0.51 |
| BA 20 | -50 | -16 | -28 | 17 | 3.21 | 0.52 |
| BA 20 | -58 | -28 | -16 | 12 | 3.02 | 0.50 |
| Regions negatively correlated with cortisol responses | ||||||
| VPFC | 26 | 34 | -12 | 21 | 3.71 | -0.59 |
Cluster size (k) refers to the number of voxels in each activated cluster. The size of each voxel is 3.125 × 3.125 × 3 mm3.
Increased activity in the dACC (MNI coordinates: 14,30,38), a neural region previously shown to be involved in the distress of social rejection (Eisenberger et al., 2003), was associated with both lower levels of daily social support (r =-.52, p<.005) and increased cortisol reactivity to a social stressor (r=.40, p<.05; see Figures 2 and 3a). This region of the dACC also correlated marginally with self-reported social distress (r=.32, p=.09), such that greater activity in this region was associated with greater self-reported social distress in response to the Cyberball game. Additionally, this cluster of dACC activity overlapped with the region of the dACC that correlated most strongly with self-reported social distress during the Cyberball task (6,36,32; r=.64, p<.001; see Figure 2). Likewise, increased activity in BA 8 (-22,38,40), a region whose activity has been associated with maternal separation and increased cortisol responses in juvenile rhesus monkeys (Rilling et al., 2001) was associated with both lower levels of social support (r = -.54, p < .005) and increased cortisol reactivity to a social stressor (r = .55, p < .005; see Figures 2 and 3b). This region, however, did not correlate significantly with self-reported social distress. Finally, there were no gender differences in the magnitude of the correlations between dACC or BA 8 activity and either social support, cortisol responses, or self-reported social distress (all p's>.19).
Figure 2.

Regions of the dACC and BA 8 that correlate with social distress, social support, and cortisol responses. Yellow activations indicate regions that correlate positively with social distress; green activations indicate regions that correlate negatively with social support; red activations indicate regions that correlate positively with cortisol responses.
Figure 3.

(A) Scatterplot showing dACC activity (14,30,38) for individuals who are both low in daily social support and high in cortisol reactivity to the TSST (left column) and for individuals who are both high in daily social support and low in cortisol reactivity to the TSST (right column). (B) Scatterplot showing BA 8 activity (-22,38,40) for individuals who are both low in daily social support and high in cortisol reactivity to the TSST (left column) and for individuals who are both high in daily social support and low in cortisol reactivity to the TSST (right column). Each point represents the data from a single participant.
Next, we examined which neural regions correlated with cortisol reactivity in whole-brain analyses and then examined which of these activations correlated with social support at a standard statistical threshold. Cortisol reactivity correlated significantly with neural activity across several regions (Table 1b). Of these regions, the only one that also correlated significantly with social support was BA 8 (-22,40,42), similar to the activation reported previously (-22,38,40). Activity in BA 8 correlated positively with cortisol reactivity (BA 8: t=3.55, r=.57, p<.005) and negatively with social support6 (BA 8: r=-.45, p<.05). Activity in this region, however, did not correlate significantly with self-reported social distress (r=.22, ns). Again, there were no gender differences in the magnitude of the correlations between BA 8 activity and either social support, cortisol responses, or self-reported social distress (all p's>.25).
It should be noted that in whole-brain analyses that correct for the total number of resolution elements, correlations between neural activity and either social support or cortisol responses were not significant at p < .05, corrected. However, in ROI analyses, focused on the strongest dACC activation that correlated with social distress (6,36,32), we found significant correlations between dACC activity (12,32,38) and both social support (T = 3.05, p = .04) and cortisol responses (T = 2.99, P = .04) at p < .05, FDR-corrected. Because we did not have a previously determined ROI in BA 8, we could not examine the activity in this neural region in the same way.
Based on the original analyses showing that activity in both dACC and BA8 correlated with social support and cortisol responses, we examined whether activity in these regions mediated the relationship between social support and cortisol responses. Although these correlational assessments do not allow for causal inferences, we can still examine whether these data are consistent with a mediational account. We found that activity in the dACC (14,30,38) and both regions of BA 8 (-22,38,40; -22,40,42) were significant mediators of the relationship between social support and cortisol responses (distribution of products test (MacKinnon et al., 2002): dACC, ZαZβ=3.50, p<.05; BA 8 (-22,38,40), ZαZβ=7.66, p<.01; BA 8 (-22,40,42), ZαZβ=6.78, p<.01), suggesting the possibility that social support may be associated with attenuated neuroendocrine stress reactivity, in part, by lessening the reactivity of these neural regions. Because all of these relationships are correlational, any suggestions of directionality remain speculative, however.
Based on extensive research relating the hypothalamus to cortisol responses, we also examined the relationships between hypothalamic activity and both social support and cortisol reactivity. In whole-brain analyses, the hypothalamus was not significantly correlated with cortisol responses or with social support. However, using a small-volume correction (SVC; in a box centered on the hypothalamus at 0,0,-8 with dimensions 20×10×8mm), two regions in the vicinity of the hypothalamus correlated positively with cortisol reactivity (hypothalamus1: 6,0,-8; t=1.98, r=.36, p<.05, corrected; hypothalamus2: -10,0,-12; t=2.29, r=.41, p<.05, corrected), and one region correlated negatively with social support (10, 0,-6; t = 2.28, r = -.40, p<.05). Of the hypothalamic activations that correlated with cortisol reactivity, neither was significantly correlated with social support. Similarly, the hypothalamic activation that correlated with social support was not significantly correlated with cortisol responses. Thus, the hypothalamus did not appear to be a direct mediator of the social support-cortisol relationship in the present study. Lastly, only the hypothalamic activation that correlated negatively with social support also correlated positively with social distress (r = .41, p<.05).
To examine whether the neural regions that were significant mediators of the social support-cortisol relationship (dACC, BA 8) were related to cortisol responses by way of their connections to the hypothalamus, we examined the relationship between activity in dACC or BA 8 and activity in the hypothalamus. When examining the regions of the hypothalamus that correlated with cortisol responses, we found that activity in one of the hypothalamic regions (-10,0,-12) correlated positively with activity in both dACC (dACC: 8,36,38; r=.49, p<.01) and BA 8 (BA 8: -22,38,40, r =.56, p<.005; BA 8: -22,40,42, r=.67, p<.005). Moreover, the hypothalamus served as a significant mediator of the relationship between these regions and cortisol responses (dACC: 8,36,38, ZαZβ=3.67, p<.05; BA 8: -22,38,40, ZαZβ=2.43, p<.05; BA 8: -22,40,42, ZαZβ=9.77, p<.01), suggesting that dACC and BA 8 activity may relate to cortisol responses by modulating hypothalamic activity, based on the presence or absence of social support. Again, due to the correlational nature of these findings, all suggestions of directionality are speculative.
Discussion
The present study investigated the neural correlates underlying the stress-protective effects of social support by examining how neural activity to a social stressor related to both daily levels of social support and cortisol responses to a social stressor. In summary, only two regions of the brain were significantly correlated with both daily levels of social support and cortisol reactivity and are thus strong candidates to play a role in the stress-protective effects of social support in the present study. Individuals who reported interacting with close and supportive individuals on a daily basis showed less dACC and BA 8 activity during a social rejection task and this reduced activity was associated with reduced cortisol reactivity during a social stress task. Moreover, individual differences in dACC and BA 8 activity mediated the relationship between social support and cortisol reactivity, suggesting that social support may relate to reduced stress reactivity by modulating long-term reactivity to social threat in these neural regions, which may then contribute to attenuated stress responses. Finally, the hypothalamus mediated the relationship between dACC and BA 8 activity and cortisol responses, potentially linking dACC and BA 8 activity to the activation of the HPA axis.
Implications for Understanding the Effects of Social Support on Health
These findings may help clarify how social support contributes to health. Although numerous studies have shown that social support benefits health and reduces physiological reactivity to stressors, it has remained unclear as to how social relationships exert this influence. Previous theoretical work has suggested that one way that social support may reduce stress reactivity is by strengthening an individual's abilities to actively cope with and regulate stressful experiences. If this were the case, we might have seen increased activity in regions involved in effortful, controlled processing or in regulating negative affect (typically associated with lateral and medial prefrontal cortical activity; Ochsner and Gross, 2005) among those with greater levels of social support. However, this is not what was observed. No region of the brain was more active to the extent that individuals were more supported. Rather, social support was associated with attenuated activity in regions that have previously been associated with distressing experience. Thus, social support may alter basic sensitivities to socially threatening situations (i.e. being rejected) such that those experiences are no longer perceived to be as threatening. Although it is not yet clear how social support contributes to the desensitization of these neural regions, there are multiple possibilities.
With regard to the dACC, it is possible that social support desensitizes this region through opioid-related processes. The ACC has one of the highest density of opioid-receptors in the central nervous system (Schlaepfer et al., 1998; Vogt et al., 1995) and endogenous opioids, which are released upon social contact, can have both analgesic and stress-reducing effects (Panksepp, 1998). Thus, social support may desensitize the dACC over time through the regular release of opioids, attenuating the stress responses that might be triggered by the dACC.
Another possibility, suggested by the animal literature, is that the presence of supportive others, over time, can lead to changes in dendritic fiber systems in specific neural regions. For example, maternal separation among newborn rodents changes various neurotransmitter fiber systems in the ACC and MPFC, which can affect the function of these neural systems (Braun et al., 2000; Poeggel et al., 1999). Conversely, hearing the sound of the mother's voice while separated buffers against these changes (Ziabreva et al., 2003). Thus, feeling socially connected (or estranged) over a period of time may change the structural makeup of the neural systems involved in responding to stressors. Of course, it is still possible that the physical presence of socially supportive others (which we did not investigate in the present study) would enhance prefrontal regulatory activations. Additional research is needed to investigate this possibility.
It is interesting to note that it was the dACC rather than the subACC that correlated with self-reported social distress and that was a mediator of the social support-cortisol relationship in the present study. This may seem surprising in light of recent reviews that have suggested that the dACC is primarily involved in cognitive processes whereas the rostral-ventral region of the ACC, which includes the subACC and pACC, is primarily involved in affective processes (Bush, Luu, & Posner, 2000; Phillips et al., 2003; Somerville et al., 2006). However, increasing amounts of data are pointing to a role for the dACC in affective experience as well, as evidenced by work showing a relationship between dACC activity and social pain distress (Eisenberger et al., 2003; Eisenberger et al., in press), physical pain distress (Price, 2000; Rainville et al., 1997), anxiety (Bystritsky et al. 2001; Kimbrell et al., 1999; Nitschke et al., 2006; Wang et al., 2005), and perceived stress (Wang et al., 2005). Moreover, numerous studies have shown that lesions to the dACC through cingulotomy consistently result in reductions in distressing or anxious affective experience across several different patient populations (Baer et al., 1995; Ballantine et al., 1987; Ballantine et al., 1967; Cohen et al., 2001; Dougherty et al., 2001; Foltz & White, 1968), whereas the data are less consistent with regard to how dACC lesions influence cognitive processes, with studies showing varying results (Cohen et al., 1999; Naccache et al., 2005; Ocshner et al., 2001; Turken & Swick, 1999). It is possible that the cognitive-affective distinction between the dACC and rostral-ventral ACC, respectively, may need to be revisited based on the accumulation of recent data. In addition, it will be important to examine how neural regions that show activity to certain affective tasks correlate with self-reported affective experience as some regions that show activity during affective tasks may actually be involved in regulating affective responses rather than in producing the affective experience itself (Das et al., 2005; Eisenberger et al., 2003; Kim et al., 2003).
Limitations and Future Directions
This study has some potential limitations. First, its correlational nature and the fact that the variables of interest were assessed at different time points, makes it impossible to determine the direction of causality. For example, it is conceivable that people who are less reactive to stress, neurally and physiologically, also perceive more support during their daily social interactions. However, previous research has shown that even after controlling for dispositional variables that may bias perceptions of social support, self-reports of social support still predict health-related outcomes (Cohen, 2004).
A second limitation is that, although physiological and neurocognitive reactivity were both assessed during a social stressor involving rejection, the tasks were not identical due to constraints imposed by the fMRI scanner. Nevertheless, the neurocognitive and physiological reactivity to the two tasks were highly correlated, which is consistent with the putative conceptual similarity of the tasks.
There are also several limitations regarding the use of the Cyberball social exclusion task in the fMRI scanner. First, as mentioned previously, the order of the inclusion and exclusion scans was not counterbalanced across participants. Although it would have been ideal to counterbalance the order of these scans, we did not do so due to possible contamination effects; experiencing the exclusion scan first would likely change the meaning of a subsequent inclusion scan. Second, because the inclusion and exclusion episodes were completed in separate scans, differential activity between these scans could be due to other factors besides feeling excluded, such as shifts in signal intensity between scans or greater fatigue during the second scan. However, the fact that we found significant correlations between neural activity in response to social exclusion (vs. inclusion) and self-reports of social distress, social support, and cortisol responses suggest that neither signal intensity changes nor fatigue are likely explanations for all of the differences between exclusion and inclusion. Neither changes in signal intensity or changes in fatigue from one scan to the next are likely to correlate in meaningful ways with these self-reported psychological variables. Last, it should be noted that the exclusion paradigm employed a block design, which only allows us to examine sustained types of neural activity that are the result of social exclusion and not more punctate neural responses that may also be occurring in response to social exclusion. Future studies will be needed to more clearly ascertain the neural structures that are associated with sustained vs. momentary responses to social exclusion.
One puzzling feature of the present investigation is that, although we replicated the previously observed correlations between self-reported social distress and neural activity to social exclusion (Eisenberger et al., 2003), we did not replicate the main effects of exclusion vs. inclusion in the present study. There are several possible reasons for this lack of replication, which stem from the differences between the present study and the previous one.
The previous study, which observed main effects of exclusion vs. inclusion, recruited participants at random from the student population, whereas participants in the present study responded to an initial ad that recruited individuals to participate in a study in which “psychological and physiological responses will be recorded as you complete several challenging tasks.” Moreover, participants in the present study then agreed to come back and participate in another study (the neuroimaging and daily experience component) with members of the same research group after having completed the TSST. Thus, the present study may have inadvertently recruited a group of participants who were more resilient or less bothered by challenging tasks, and thus these individuals, as a group, may have shown less sensitivity to the social exclusion episode. Another difference between the present study and the previous one is that, in the previous study, participants completed only the Cyberball task, whereas in the present study, participants completed two other tasks in the fMRI scanner prior to the completion of the Cyberball game. This may have led participants in the present study to have been more fatigued by the time they played the game, they may have devoted less attention to the game or taken the game less seriously, or the game may have seemed less important or central to the study. Future studies will be needed to determine the reproducibility of the main effect findings. Nevertheless, the correlation between subjective social experience and neural activity to social exclusion did replicate the original findings.
Overall, this study begins to broaden our understanding of how social support relates to health by showing that individuals who interact more with close, supportive, and comforting individuals on a daily basis show reduced neurocognitive and physiological stress reactivity to a social stressor. This reduction in stress responses, over time, may result in better health outcomes. Understanding the mechanisms whereby social relationships influence health unearths new possibilities for improving and maximizing health outcomes and reaffirms the importance of social relationships for survival.
Acknowledgments
We would like to thank the staff of the UCLA Brain Mapping Center for their assistance. This research was funded by a predoctoral research fellowship from the University of California, Los Angeles Graduate Division and a postdoctoral research fellowship from the National Institutes of Mental Health to N.I. Eisenberger (T32 MH-019925) and by National Institutes of Mental Health Grants to M.D. Lieberman (R21MH66709, R21MH071521) and S.E. Taylor (R01MH56880)
Footnotes
Although it would have been ideal to assess cortisol and neural responses simultaneously, the paradigm needed to produce cortisol responses was not amenable to the fMRI scanner. Previous research has demonstrated that the social-evaluative component of the TSST, the possibility that one could be evaluated and rejected, is critical for cortisol responses (Dickerson and Kemeny, 2004). Because of the difficulty in recreating an evaluative panel within the fMRI scanner, the Cyberball task, which has been shown to elicit feelings of rejection and is amenable to the fMRI scanner (Eisenberger et al., 2003), was used instead.
Social interactions were defined as any interaction with one or more individuals that lasted for 5 minutes or longer, but not including email or web-based interactions.
Although it would have been ideal to counterbalance the order of the inclusion and exclusion scans across participants, having the exclusion scan come before the inclusion scan would likely change the meaning of the inclusion scan for participants. Thus, participants who were first excluded might subsequently worry about being excluded again or anticipate that another exclusion episode is possible.
Females taking oral contraceptives were not excluded from participating in this study. Five of the eighteen females in this study were taking oral contraceptives; however, there were no cortisol-related or social support-related differences between those taking and those not taking oral contraceptives.
The present study differed from the previous one (Eisenberger et al., 2003) in multiple ways that may have led to the lack of main effects. These differences are addressed in the discussion section.
Although the activation in BA 8 that correlated positively with cortisol reactivity is similar to that seen in previous work in rhesus monkeys (Rilling et al., 2001), the activation in the present study was left-sided, whereas, in rhesus monkeys, the activation that correlated positively with cortisol responses to maternal separation was right-sided. Because cortisol-related neural activity has not been examined extensively in humans, it is not clear if this is a species-related difference. To examine this more closely, we extracted parameter estimates from the same BA 8 activation on the right side (22,40,42). Although these two activations were strongly correlated (r=.59, p<.005), the right-sided BA 8 activation did not correlate significantly with social support or cortisol responses (p's>.15). Future research will be needed to determine if this difference in right or left BA 8 activity is meaningful.
Publisher's Disclaimer: This is a PDF file of an unedited manuscript that has been accepted for publication. As a service to our customers we are providing this early version of the manuscript. The manuscript will undergo copyediting, typesetting, and review of the resulting proof before it is published in its final citable form. Please note that during the production process errors may be discovered which could affect the content, and all legal disclaimers that apply to the journal pertain.
References
- Ader R, Felten DL, Cohen N. Psychoneuroimmunology. Academic Press; San Diego: 1991. [Google Scholar]
- Aron AR, Robbins TW, Poldrack RA. Inhibition and the right inferior frontal cortex. Trends Cogn Sci. 2004;8:170–177. doi: 10.1016/j.tics.2004.02.010. [DOI] [PubMed] [Google Scholar]
- Aziz Q, Schnitzler A, Enck P. Functional neuroimaging of visceral sensation. J Clin Neurophysio. 2000;17:604–612. doi: 10.1097/00004691-200011000-00006. [DOI] [PubMed] [Google Scholar]
- Baer L, Rauch SL, Ballantine T, Martuza R, Cosgrove R, Cassem E, Giriunas I, Manzo PA, Dimino C, Jenike MA. Cingulotomy for intractable obsessive-compulsive disorder. Arch Gen Psychiatry. 1995;52:384–392. doi: 10.1001/archpsyc.1995.03950170058008. [DOI] [PubMed] [Google Scholar]
- Ballantine HT, Bouckoms AJ, Thomas EK, Giriunas IE. Treatment of psychiatric illness by stereotactic cingulotomy. Biol Psychiatry. 1987;22:807–819. doi: 10.1016/0006-3223(87)90080-1. [DOI] [PubMed] [Google Scholar]
- Ballantine HT, Cassidy WL, Flanagan NB, Marino R. Stereotaxic anterior cingulotomy for neuropsychiatric illness and intractable pain. J Neurosurgery. 1967;26:488–495. doi: 10.3171/jns.1967.26.5.0488. [DOI] [PubMed] [Google Scholar]
- Barrett LF, Barrett DJ. An introduction to computerized experience sampling in psychology. Soc Sci Comp Rev. 2001;19:175–185. [Google Scholar]
- Berkman LF, Syme SL. Social networks, host resistance, and mortality: A nine-year follow-up study of Alameda county residents. Am J Epidemiol. 1979;109:186–203. doi: 10.1093/oxfordjournals.aje.a112674. [DOI] [PubMed] [Google Scholar]
- Braun K, Lange E, Metzger M, Poeggel G. Maternal separation followed by early social deprivation affects the development of monoaminergic fiber systems in the medial prefrontal cortex of Octodon degus. Neurosci. 2000;95:309–318. doi: 10.1016/s0306-4522(99)00420-0. [DOI] [PubMed] [Google Scholar]
- Bush G, Luu P, Posner MI. Cognitive and emotional influences in anterior cingulate cortex. Tr Cog Sci. 2000;4:215–222. doi: 10.1016/s1364-6613(00)01483-2. [DOI] [PubMed] [Google Scholar]
- Bystritsky A, Pontillo D, Powers M, Sabb FW, Craske MG, Bookheimer SY. Functional MRI changes during panic anticipation and imagery exposure. Neuroreport. 2001;12:3953–3957. doi: 10.1097/00001756-200112210-00020. [DOI] [PubMed] [Google Scholar]
- Cechetto DF, Saper CB. Evidence for a viscerotopic sensory representation in the cortex and thalamus in the rat. J Comp Neurol. 1987;262:27–45. doi: 10.1002/cne.902620104. [DOI] [PubMed] [Google Scholar]
- Cohen RA, Kaplan RF, Moser DJ, Jenkins MA, Wilkinson H. Impairments of attention after cingulotomy. Neurology. 1999;53:819–824. doi: 10.1212/wnl.53.4.819. [DOI] [PubMed] [Google Scholar]
- Cohen RA, Paul R, Zawacki TM, Moser DJ, Sweet L, Wilkinson H. Emotional and personality changes following cingulotomy. Emotion. 2001;1:38–50. doi: 10.1037/1528-3542.1.1.38. [DOI] [PubMed] [Google Scholar]
- Cohen S. Social relationships and health. Am Psychol. 2004;59:676–684. doi: 10.1037/0003-066X.59.8.676. [DOI] [PubMed] [Google Scholar]
- Cohen S, Wills TA. Stress, social support, and the buffering hypothesis. Psychol Bull. 1985;93:310–357. [PubMed] [Google Scholar]
- Das P, Kemp AH, Liddell BJ, Brown KJ, Olivieri G, Peduto A, Gordon E, Williams LM. Pathways for fear perception: Modulation of amygdala activity by thalamo-cortical systems. Neuroimage. 2005;26:141–148. doi: 10.1016/j.neuroimage.2005.01.049. [DOI] [PubMed] [Google Scholar]
- Davidson RJ, Irwin W. The functional neuroanatomy of emotion and affective style. Tr Cogn Sci. 1999;3:11–21. doi: 10.1016/s1364-6613(98)01265-0. [DOI] [PubMed] [Google Scholar]
- Davis M, Whalen PJ. The amygdala: vigilance and emotion. Molecular Psychiatry. 2001;6:13–34. doi: 10.1038/sj.mp.4000812. [DOI] [PubMed] [Google Scholar]
- Dickerson SS, Kemeny ME. Acute stressors and cortisol responses: A theoretical integration and synthesis of laboratory research. Psych Bull. 2004;130:355–391. doi: 10.1037/0033-2909.130.3.355. [DOI] [PubMed] [Google Scholar]
- Dougherty DD, Baer L, Cosgrove GR, Cassem EH, Price BH, Nierenberg AA, Jenike MA, Rauch SL. Prospective long-term follow-up of 44 patients who received cingulotomy for treatment-refractory obsessive-compulsive disorder. Am J of Psychiatry. 2002;159:269–275. doi: 10.1176/appi.ajp.159.2.269. [DOI] [PubMed] [Google Scholar]
- Eisenberger NI, Lieberman MD, Williams KD. Does rejection hurt? An fMRI study of social exclusion. Science. 2003;302:290–292. doi: 10.1126/science.1089134. [DOI] [PubMed] [Google Scholar]
- Eisenberger NI, Way BM, Taylor SE, Welch WT, Lieberman MD. Understanding genetic risk for aggression: Clues from the brain's response to social exclusion. Biol Psychiatry. doi: 10.1016/j.biopsych.2006.08.007. in press. [DOI] [PubMed] [Google Scholar]
- Foltz EL, White LE. The role of rostral cingulotomy in “pain” relief. Int J Neurol. 1968;6:353–373. [PubMed] [Google Scholar]
- Forman SD, Cohen JD, Fitzgerald M, Eddy WF, Mintun MA, Noll DC. Improved assessment of significant activation in functional magnetic resonance imaging (fMRI): use of a cluster-size threshold. Magn Reson Med. 1995;33:636–647. doi: 10.1002/mrm.1910330508. [DOI] [PubMed] [Google Scholar]
- Frankel RJ, Jenkins JS, Wright JJ. Pituitary-adrenal response to stimulation of the limbic system and lateral hypothalamus in the rhesus monkey (Macacca Mulatta) Acta Endocrinol. 1978;88:209–216. doi: 10.1530/acta.0.0880209. [DOI] [PubMed] [Google Scholar]
- Hariri AR, Bookheimer SY, Mazziotta JC. Modulating emotional response: Effects of a neocortical network on the limbic system. NeuroReport. 2000;11:43–48. doi: 10.1097/00001756-200001170-00009. [DOI] [PubMed] [Google Scholar]
- House JS, Landis KR, Umberson D. Social relationships and health. Science. 1988;241:540–545. doi: 10.1126/science.3399889. [DOI] [PubMed] [Google Scholar]
- Kim H, Somerville LH, Johnstone T, Alexander AL, Whalen PJ. Inverse amygdala and medial prefrontal cortex responses to surprised faces. Neuroreport. 2003;14:2317–2322. doi: 10.1097/00001756-200312190-00006. [DOI] [PubMed] [Google Scholar]
- Kimbrell TA, George MS, Parekh PI, Ketter TA, Podell DM, Danielson AL, Repella JD, Benson BE, Willis MW, Herscovitch P, Post RM. Regional brain activity during transient self-induced anxiety and anger in healthy adults. Biol Psychiatry. 1999;46:454–465. doi: 10.1016/s0006-3223(99)00103-1. [DOI] [PubMed] [Google Scholar]
- Kirschbaum C, Klauer T, Filipp SH, Hellhammer DH. Sex-specific effects of social support on cortisol and subjective responses to acute psychological stress. Psychosom Med. 1995;57:23–31. doi: 10.1097/00006842-199501000-00004. [DOI] [PubMed] [Google Scholar]
- Kirschbaum C, Pirke KM, Hellhammer DH. The ‘Trier Social Stress Test:’ A tool for investigating psychobiological stress responses in a laboratory setting. Neuropsychobiol. 1993;28:76–81. doi: 10.1159/000119004. [DOI] [PubMed] [Google Scholar]
- Kirzinger A, Jurgens U. Cortical lesion effects and vocalization in the squirrel monkey. Brain Res. 1982;233:299–315. doi: 10.1016/0006-8993(82)91204-5. [DOI] [PubMed] [Google Scholar]
- Lieberman MD, Eisenberger NI, Crockett MJ, Tom SM, Pfeifer JH, Way BM. Putting feelings into words: Affect labeling disrupts amygdala activity to affective stimuli. Psychol Sci. doi: 10.1111/j.1467-9280.2007.01916.x. in press. [DOI] [PubMed] [Google Scholar]
- Lieberman MD, Hariri A, Jarcho JM, Eisenberger NI, Bookheimer SY. An fMRI investigation of race-related amygdala activity in African-American and Caucasian-American individuals. Nat Neurosci. 2005;8:720–722. doi: 10.1038/nn1465. [DOI] [PubMed] [Google Scholar]
- Lieberman MD, Jarcho JM, Berman S, Naliboff BD, Suyenobu BY, Mandelkern M, Mayer EA. The neural correlates of placebo effects: A disruption account. Neuroimage. 2004;22:447–455. doi: 10.1016/j.neuroimage.2004.01.037. [DOI] [PubMed] [Google Scholar]
- MacKinnon DP, Lockwood CM, Hoffman JM, West SG, Sheets V. A comparison of methods to test mediation and other intervening variable effects. Psychol Methods. 2002;7:83–104. doi: 10.1037/1082-989x.7.1.83. [DOI] [PMC free article] [PubMed] [Google Scholar]
- MacLean PD, Newman JD. Role of midline frontolimbic cortex in production of the isolation call of squirrel monkeys. Brain Res. 1988;450:111–123. doi: 10.1016/0006-8993(88)91550-8. [DOI] [PubMed] [Google Scholar]
- Mayberg HS, Liotti M, Brannan SK, McGinnis S, Mahurin RK, Jerabek PA, Silva JA, Tekell JL, Martin CC, Lancaster JL, Fox PT. Reciprocal limbic-cortical function and negative mood: Converging PET findings in depression and normal sadness. Am J Psychiatry. 1999;156:675–682. doi: 10.1176/ajp.156.5.675. [DOI] [PubMed] [Google Scholar]
- McEwen BS. Stress, adaptation, and disease. Allostasis and allostatic load. Ann NY Acad Sci. 1998;840:33–44. doi: 10.1111/j.1749-6632.1998.tb09546.x. [DOI] [PubMed] [Google Scholar]
- Most SB, Chun MM, Johnson MR, Kiehl KA. Attentional modulation of the amygdala varies with personality. Neuroimage. doi: 10.1016/j.neuroimage.2005.12.031. in press. [DOI] [PubMed] [Google Scholar]
- Naccache L, Dehaene S, Cohen L, Habert M, Guichart-Gomez E, Galanaud D, Willer J. Effortless control: executive attention and conscious feeling of mental effort are dissociable. Neuropsychologia. 2005;43:1318–1328. doi: 10.1016/j.neuropsychologia.2004.11.024. [DOI] [PubMed] [Google Scholar]
- Nitschke JB, Sarinopoulos I, Mackiewicz KL, Schaefer HS, Davidson RJ. Functional neuroanatomy of aversion and its anticipation. Neuroimage. 2006;29:106–116. doi: 10.1016/j.neuroimage.2005.06.068. [DOI] [PubMed] [Google Scholar]
- Ochsner KN, Bunge SA, Gross JJ, Gabrieli JD. Rethinking feelings: An fMRI study of the cognitive regulation of emotion. J Cogn Neurosci. 2002;14:1215–1229. doi: 10.1162/089892902760807212. [DOI] [PubMed] [Google Scholar]
- Ochsner KN, Gross JJ. The cognitive control of emotion. Tr Cog Sci. 2005;9:242–249. doi: 10.1016/j.tics.2005.03.010. [DOI] [PubMed] [Google Scholar]
- Ochsner KN, Kosslyn SM, Cosgrove GR, Cassem EH, Price BH, Nierenberg AA, Rauch SL. Deficits in visual cognition and attention following bilateral anterior cingulotomy. Neuropsychologia. 2001;39:219–230. doi: 10.1016/s0028-3932(00)00114-7. [DOI] [PubMed] [Google Scholar]
- Ochsner KN, Ray RD, Cooper JC, Robertson ER, Chopra S, Gabrieli JD, Gross JJ. For better or for worse: The neural systems supporting the cognitive down- and up-regulation of negative emotion. Neuroimage. 2004;23:483–499. doi: 10.1016/j.neuroimage.2004.06.030. [DOI] [PubMed] [Google Scholar]
- Ongur D, An X, Price JL. Prefrontal cortical projections to the hypothalamus in macaque monkeys. J Comp Neurol. 1998;401:480–505. [PubMed] [Google Scholar]
- Panksepp J. Affective Neuroscience. Oxford University Press; New York: 1998. [Google Scholar]
- Petrovic P, Ingvar M. Imaging cognitive modulation of pain processing. Pain. 2002;95:1–5. doi: 10.1016/s0304-3959(01)00467-5. [DOI] [PubMed] [Google Scholar]
- Phan KL, Fitzgerald DA, Nathan PJ, Moore GJ, Uhde TW, Tancer ME. Neural substrates for voluntary suppression of negative affect: A functional magnetic resonance imaging study. Biol Psychiatry. 2005;57:210–219. doi: 10.1016/j.biopsych.2004.10.030. [DOI] [PubMed] [Google Scholar]
- Phan KL, Wager TD, Taylor SF, Liberzon I. Functional neuroanatomy of emotion: A meta-analysis of emotion activation studies in PET and fMRI. Neuroimage. 2002;16:331–348. doi: 10.1006/nimg.2002.1087. [DOI] [PubMed] [Google Scholar]
- Phan KL, Wager TD, Taylor SF, Liberzon I. Functional neuroimaging studies of human emotions. CNS Spectrum. 2004;9:258–266. doi: 10.1017/s1092852900009196. [DOI] [PubMed] [Google Scholar]
- Phelps EA, Delgado MR, Nearing KI, LeDoux JE. Extinction learning in humans: Role of the amygdala and vmPFC. Neuron. 2004;43:897–905. doi: 10.1016/j.neuron.2004.08.042. [DOI] [PubMed] [Google Scholar]
- Phillips ML, Drevets WC, Rauch SL, Lane R. Neurobiology of emotion perception I: The neural basis of normal emotion perception. Biol Psychiatry. 2003;54:504–514. doi: 10.1016/s0006-3223(03)00168-9. [DOI] [PubMed] [Google Scholar]
- Phillips ML, Young AW, Senior C, Brammer M, Andrew C, Calder AJ, Bullmore ET, Perrett DI, Rowland D, Williams SC, Gray JA, David AS. A specific neural substrate for perceiving facial expressions of disgust. Nature. 1997;389:495–498. doi: 10.1038/39051. [DOI] [PubMed] [Google Scholar]
- Poeggel G, Lange E, Hase C, Metzger M, Gulyaeva N, Braun K. Maternal separation and early social deprivation in Octodon degus: quantitative changes of nicotinamide adenine dinucleotide phosphate-diaphorase-reactive neurons in the prefrontal cortex and nucleus accumbens. Neurosci. 1999;94:497–504. doi: 10.1016/s0306-4522(99)00289-4. [DOI] [PubMed] [Google Scholar]
- Price DD. Psychological and neural mechanisms of the affective dimension of pain. Science. 2000;288:1769–1772. doi: 10.1126/science.288.5472.1769. [DOI] [PubMed] [Google Scholar]
- Rainville P, Duncan GH, Price DD, Carrier B, Bushnell MD. Pain affect encoded in human anterior cingulate but not somatosensory cortex. Science. 1997;277:968–971. doi: 10.1126/science.277.5328.968. [DOI] [PubMed] [Google Scholar]
- Reis HT, Gable SL. Event-sampling and other methods for studying everyday experience. In: Reis HT, Judd CM, editors. Handbook of Research Methods in Social and Personality Psychology. Cambridge University Press; New York: 2002. pp. 190–222. [Google Scholar]
- Rilling JK, Winslow JT, O'Brien D, Gutman DA, Hoffman JM, Kilts CD. Neural correlates of maternal separation in rhesus monkeys. Biol Psychiatry. 2001;49:146–157. doi: 10.1016/s0006-3223(00)00977-x. [DOI] [PubMed] [Google Scholar]
- Risold PY, Thompson RH, Swanson LW. The structural organization of connections between hypothalamus and cerebral cortex. Brain Res Rev. 1997;24:197–254. doi: 10.1016/s0165-0173(97)00007-6. [DOI] [PubMed] [Google Scholar]
- Saphier D, Feldman S. Electrophysiology of limbic forebrain and paraventricular nucleus connections. Brain Res Bull. 1986;17:743–750. doi: 10.1016/0361-9230(86)90085-7. [DOI] [PubMed] [Google Scholar]
- Schlaepfer TE, Strain EC, Greenberg BD, Preston KL, Lancaster E, Bigelow GE, Barta PE, Pearlson GD. Site of opioid action in the human brain: mu and kappa agonists' subjective and cerebral blood flow effects. Am J Psychiatry. 1998;155:470–473. doi: 10.1176/ajp.155.4.470. [DOI] [PubMed] [Google Scholar]
- Setekleiv J, Skaug OE, Kaada BR. Increase of plasma 17-hydroxycorticosteroids by cerebral cortical and amygdaloid stimulation in the cat. J Endocrin. 1961;22:119–127. doi: 10.1677/joe.0.0220119. [DOI] [PubMed] [Google Scholar]
- Somerville LH, Heatherton TF, Kelley WM. Anterior cingulate cortex responds differentially to expectancy violation and social rejection. Nat Neurosci. 2006;9:1007–1008. doi: 10.1038/nn1728. [DOI] [PubMed] [Google Scholar]
- Smith W. The functional significance of the rostral cingular cortex as revealed by its responses to electrical excitation. J Neurophys. 1945;8:241–255. [Google Scholar]
- Stroud LR, Salovey P, Epel ES. Sex differences in stress responses: Social rejection vs achievement stress. Biol Psychiatry. 2002;52:318–327. doi: 10.1016/s0006-3223(02)01333-1. [DOI] [PubMed] [Google Scholar]
- Turken AU, Swick D. Response selection in the human anterior cingulate cortex. Nat Neurosci. 1999;2:920–924. doi: 10.1038/13224. [DOI] [PubMed] [Google Scholar]
- Uchino BN, Cacioppo JT, Kiecolt-Glaser JK. The relationship between social support and physiological processes: a review with emphasis on underlying mechanisms and implications for health. Psych Bull. 1996;119:488–531. doi: 10.1037/0033-2909.119.3.488. [DOI] [PubMed] [Google Scholar]
- Urry HL, van Reekum CM, Johnstone T, Kalin NH, Thurow ME, Schaefer HS, Jackson CA, Frye CJ, Greischar LL, Alexander AL, Davidson RJ. Amygdala and ventromedial prefrontal cortex are inversely coupled during regulation of negative affect and predict the diurnal pattern of cortisol secretion among older adults. J Neurosci. 2006;26:4415–4425. doi: 10.1523/JNEUROSCI.3215-05.2006. [DOI] [PMC free article] [PubMed] [Google Scholar]
- Vogt BA. Pain and emotion interactions in subregions of the cingulate gyrus. Nat Rev Neurosci. 2005;6:533–544. doi: 10.1038/nrn1704. [DOI] [PMC free article] [PubMed] [Google Scholar]
- Vogt BA, Wiley RG, Jensen EL. Localization of Mu and delta opioid receptors to anterior cingulate afferents and projection neurons and input/output model of Mu regulation. Exp Neur. 1995;135:83–92. doi: 10.1006/exnr.1995.1069. [DOI] [PubMed] [Google Scholar]
- Wang J, Rao H, Wetmore GS, Furlan PM, Korczykowski M, Dinges DF, Detre JA. Perfusion functional MRI reveals cerebral blood flow pattern under psychological stress. Pr Nat Acad Sci. 2005;102:17804–17809. doi: 10.1073/pnas.0503082102. [DOI] [PMC free article] [PubMed] [Google Scholar]
- Williams KD, Cheung CKT, Choi W. Cyberostracism: Effects of being ignored over the Internet. J Pers Soc Psych. 2000;79:748–762. doi: 10.1037//0022-3514.79.5.748. [DOI] [PubMed] [Google Scholar]
- Ziabreva I, Schnabel R, Poeggel G, Braun K. Mother's voice “buffers” separation-induced receptor changes in the prefrontal cortex of octodon degus. Neurosci. 2003;119:433–441. doi: 10.1016/s0306-4522(03)00123-4. [DOI] [PubMed] [Google Scholar]