

Abstract
Sphingosine and sphingosine 1-phosphate (S1P) are sphingolipid metabolites that act as signaling messengers to activate or inhibit multiple downstream targets to regulate cell growth, differentiation, and apoptosis. The amphiphilic nature of these compounds leads to aggregation above their critical micelle concentrations (CMCs), which may be important for understanding lysosomal glycosphingolipid storage disorders. We investigated the aggregation of sphingosine and S1P over a comprehensive, physiologically relevant range of pH values, ionic strengths, and lipid concentrations by means of dynamic light scattering, titration, and NMR spectroscopy. The results resolve discrepancies in literature reports of CMC and pKa values. At physiological pH, the nominal CMCs of sphingosine and S1P are 0.99 ± 0.12 μM (pH 7.4) and 14.35 ± 0.08 μM (pH 7.2), respectively. We find that pH strongly affects the aggregation behavior of sphingosine by changing the ionic and hydrogen-bonding states; the nominal critical aggregation concentrations of protonated and deprotonated sphingosine are 1.71 ± 0.24 μM and 0.70 ± 0.02 μM, respectively. NMR measurements revealed that the NH3+–NH2 transition of sphingosine occurs at pH 6.6, and that there is a structural shift in sphingosine aggregates caused by a transition in the predominant hydrogen-bonding network from intramolecular to intermolecular that occurs between pH 6.7 and 9.9.
Introduction
Sphingosine ((2S,3R,4E)-2-amino-4-octadecene-1,3-diol) and sphingosine 1-phosphate (S1P; (2S,3R,4E)-2-amino-4-octadecene-1,3-diol-1-phosphate) are bioactive metabolites that are produced in the course of sphingolipid turnover induced by platelet-derived growth factors. S1P is also generated by de novo biosynthesis at the cytoplasmic face of the endoplasmic reticulum (1–5). The biological activities of sphingosine include activation or inhibition of multiple kinases (6–11), G protein-coupled receptors (12), and channels (13–15) (see Zheng et al. (16) for review). As a consequence of these interactions, sphingosine usually has growth-inhibitory and apoptotic activities (1,17–19). On the other hand, S1P is mitogenic and antiapoptotic (1,5,20,21), serving as both extra- (first) and intracellular (second) messengers to S1P receptors (3,22). The detailed signaling mechanisms of these molecules remain unclear, but the opposing functions of sphingosine and S1P have been likened to a “rheostat” that determines cell survival versus death pathways (21,23). Plasma or serum concentrations of sphingosine and S1P are maintained by sphingolipid catabolism (1), and abnormal changes have been implicated in cancer (3,24) and liver fibrosis (25). An important feature of sphingosine-related molecules (sphingoid bases), which include sphingosine and S1P, is that they are amphiphilic due to a hydrophobic alkyl chain and a hydrophilic headgroup rich in polar groups (OH and NH2). This amphiphilicity promotes the formation of micellar aggregates above a critical micelle concentration (CMC). Here we show that these aggregates can form under physiologically relevant conditions, which may be important for understanding lysosomal glycosphingolipid storage disorders. For example, Lloyd-Evans et al. (26) showed that sphingosine storage is an initiating factor in neurodegenerative Niemann-Pick type C1 disease.
Sphingosine is a basic building block of most mammalian sphingolipids (Fig. 1). In addition to sphingosine, more than 60 different species of sphingoid bases have been reported (1,27,28). These are distinguished by chain length (14–22 carbon atoms), the number and position of the double bonds, and the number of hydroxyls (1,16,28). Although different organisms display considerable variation in sphingoid bases (27,28), there are usually only a few structural variants in any one species; for example, humans have primarily sphingosine, sphinganine (dihydrosphingosine), and 4-hydroxysphinganine, plus small amounts of longer-chain-length homologs (16). Of particular biological interest is S1P, which is a phosphorylated form of sphingosine (position 1, Fig. 1) catalyzed by sphingosine kinases (3). The CMC of S1P has not been reported, and sphingosine's CMC has been estimated from fluorescence measurements (29,30) involving the partitioning of fluorophores into micelles. The inherent limitation of CMC determinations using fluorophores, such as 8-aminonaphthalene-1,3,6-trisulfonic acid (ANTS) and 1,6-diphenyl-1,3,5-hexatriene (DPH), are the assumptions that 1), fluorophore and amphiphile mix ideally; and 2), the fluorophore does not perturb the CMC. These problems are likely the cause of the large disparity in sphingosine CMC values reported in the literature (18 μM (30) to 112 μM (29)).
Figure 1.
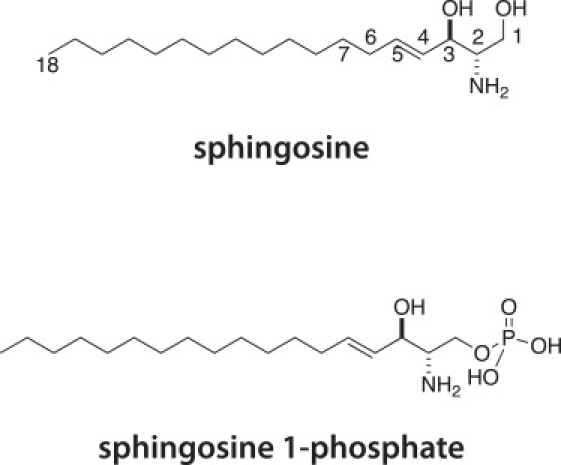
Chemical structures of sphingosine and S1P. Both molecules are bioactive metabolites produced in the course of an agonist-induced sphingolipid turnover and de novo biosynthesis.
In addition to the range of CMC values reported for sphingosine, there are also inconsistencies in the reported pKa values for sphingosine. The apparent pKa obtained from pH titration of sphingosine in Triton X-100 micelles was 6.7 (31). On the other hand, the pKa determined by the pH-dependent change of the gel-to-liquid crystalline phase transition temperature in a sphingosine/dipalmitoylphosphatidylserine (DPPS) mixture was found to be 9.1 (32,33). López-García et al. (33) pointed out that a possible explanation for these conflicting pKa values was the difference in hydration level and hydrogen bonding (both of which shift the pKa of the amino group) between sphingosines in Triton X-100 micelles and in bilayers. Because of the biological importance of sphingoid bases, we systematically examined the aggregation behavior of sphingosine and S1P using dynamic light scattering, pH titration, and NMR to resolve the disparate values of CMC and pKa reported in the literature. We discovered in the course of the measurements that the apparent sphingosine CMC depends upon pH due to changes in the ionization and hydrogen-bonding states of sphingosine.
Materials and Methods
Materials
Sphingosine (>99%) was a kind gift from Dr. Alfred Merrill (obtained from Avanti Polar Lipids, Alabaster, AL). S1P was also obtained from Avanti. Ethanol, triethylamine, and 3-cyclohexylamino-1-propanesulfonic acid (CAPS) were purchased from Acros Organics (Geel, Belgium). Dulbecco's PBS (DPBS) buffer without Ca2+ and Mg2+ was purchased from HyClone (Logan, UT). n-Dodecyl β-D-maltoside, 2-(N-morpholino)ethanesulfonic acid (MES), and sodium azide were obtained from Sigma Chemical Co. (St. Louis, MO), and 4-(2-hydroxyethyl)-1-piperazineethanesulfonic acid (HEPES) was purchased from Fisher Scientific (Pittsburgh, PA). Glycine was purchased from Mallinckrodt Baker (Phillipsburg, NJ). Deuterium oxide (D2O), sodium deuteroxide (NaOD) and deuterium chloride (DCl) were purchased from Cambridge Isotope Laboratories (Andover, MA). All chemicals were used as purchased without further purification.
Sample preparation
For dynamic light scattering experiments, various concentrations of sphingosine and S1P were prepared by mixing stock solution with buffer. The stock solution of sphingosine (10 mM) was prepared by diluting sphingosine with ethanol. Because the solubility of S1P in organic solvent is quite low, we used a modified version of the procedure described on Avanti's web site (http://www.avantilipids.com/SyntheticSphingosine-1-phosphate.asp): S1P was solubilized with methanol-triethylamine (20:3 v/v) to prepare 14 mM stock solution of S1P. The buffers used for the light scattering experiments with sphingosine were composed of 10 mM HEPES, 2 mM MES, 2 mM glycine, 10 mM CAPS, 140 mM NaCl, and 3 mM sodium azide. The buffer for the light scattering studies of S1P was DPBS.
For pH titration experiments, sphingosine stock solution (10 mM) was mixed with 0.25 mM HCl(aq) containing 140 mM NaCl. The initial concentration of sphingosine was 200 μM.
For NMR measurements, appropriate amounts of sphingosine (powder) and NaCl were suspended with D2O (1 mL) to replace exchangeable protons of sphingosine with deuterium. Because several sphingosine signals resonate near the strong hydrogen deuterium oxide signal, the samples were exchanged into D2O a second time. After the samples were vortexed to achieve a homogeneous dispersion, they were lyophilized and resuspended with D2O or 20 mM dodecyl maltoside in D2O (500 μL) to the desired concentrations. The pH values of the samples were adjusted by adding NaOD or DCl in D2O.
Dynamic light scattering measurements
Dynamic light scattering measurements were performed on a DAWN HELEOS (Wyatt, Santa Barbara, CA; laser wave length: 658 nm) using the same procedure as described in a previous study (34). In brief, the measured intensity of scattered light from each sample was normalized to that of the buffer. The polydispersity parameter (μ2) and averaged hydrodynamic radius (Rh) were determined from the intensity-intensity correlation function using the cumulants method (35,36). The accuracy of determinations of Rh was checked by means of control experiments using bovine serum albumin, whose Rh is well known.
pH titration experiments
pH titration experiments were performed by adding NaOH(aq) (with 140 mM NaCl, pH 11) to sphingosine solution at room temperature.
NMR measurements
1H NMR and 1H-13C heteronuclear multiple-quantum coherence (HMQC) measurements were performed at 35°C on an INOVA 800 MHz NMR spectrometer (Varian, Palo Alto, CA) equipped with a triple-axis gradient triple-resonance (1H13C15N) 5-mm probe. Nonspinning spectra were collected with a recycle delay of 2 s. Water suppression was achieved using WATERGATE (37). 1H NMR spectra were collected with 16,384 complex points, 128 scans, and a spectral width of 10,000 Hz. Natural-abundance 1H-13C HMQC spectra were collected with 4096 points for proton, 128 increments for carbon, and 256 scans. Chemical shifts were referenced to 2,2-dimethyl-2-silapentane-5-sulfonic acid. Data were processed with NMRPipe (38) using a polynomial filter for solvent elimination. Observation of the signal/noise (S/N) ratio (measured with respect to baseline) of the NMR signal provided information on aggregation, because line widths correlate with the size of aggregates. After excitation, larger aggregates with slower thermal motion undergo faster relaxation, mainly via the spin-spin (T2) relaxation pathway, which broadens the signal line width. In the extreme case of very large aggregates, lines become so broad that they are undetectable.
Results
The aggregation behavior of sphingosine and S1P over a comprehensive range of physiological pH values and lipid concentrations were analyzed by dynamic light scattering using the cumulants method (Fig. 2), which provides the hydrodynamic radius (Rh) and a parameter (μ2) that correlates with the polydispersity of the solution (the higher the μ2, the higher the polydispersity). The μ2 of transitional phases comprised of coexisting monomers and aggregates is much higher than that of an aggregated phase in which aggregates predominate. Hence, aggregation can be detected by an increase in the hydrodynamic radius and a decrease in the polydispersity parameter (34,39). At neutral pH, the concentrations at which half-aggregation of sphingosine or S1P occur (C50, defined as the CMC) were determined to be 0.99 ± 0.12 μM (pH 7.4) and 14.35 ± 0.08 μM (pH 7.2), respectively (Fig. 2 A).
Figure 2.
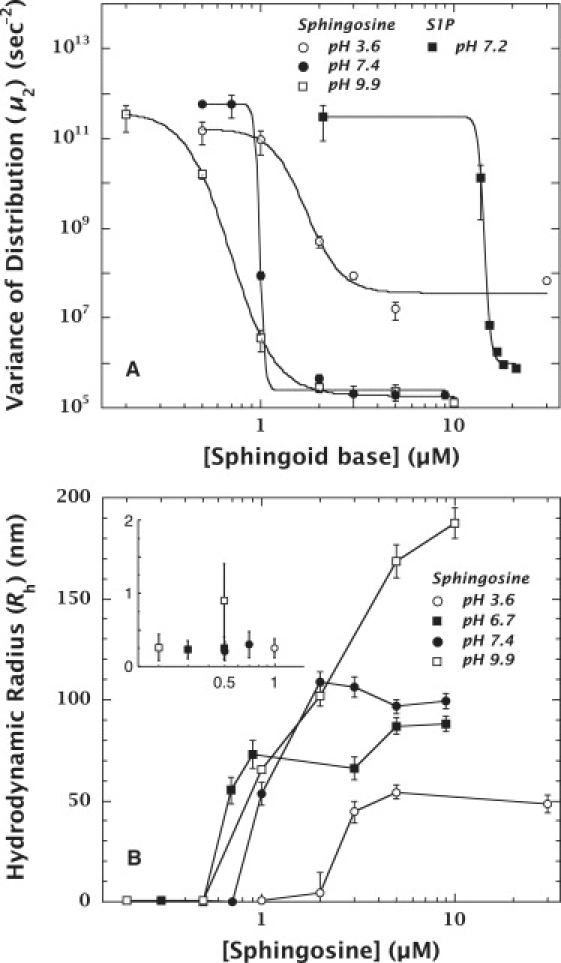
Aggregation behaviors of sphingosine and S1P at various pH values. (A) Change in μ2 values at 25°C of sphingosine and S1P. The data for sphingosine at pH 3.6, 7.4, and 9.9 are depicted by open circles, solid circles, and open squares, respectively. The data for S1P at pH 7.2 are represented by solid squares. Aggregation is indicated by the decrease in the polydispersity parameter (μ2) (34,39). These data suggest that pH has a strong effect on the aggregation behavior of sphingosine, and that the concentrations at which half-aggregations occur (C50) are 1.71 ± 0.24 μM (pH 3.6), 0.99 ± 0.12 μM (pH 7.4), and 0.70 ± 0.02 μM (pH 9.9). These data also demonstrate that the attachment of a phosphate group to sphingosine increases the solubility of S1P. The C50 at physiological pH (7.2) of S1P (14.35 ± 0.08 μM) was 14-fold higher than that of sphingosine. (B) Rh of sphingosine in buffers (pH 3.6, 7.4, and 9.9) at different concentrations at 25°C. The data for pH 3.6, 7.4 and 9.9 are depicted by open circles, solid circles, and open squares, respectively. The inset shows the small, but nonzero, values of Rh at concentrations below the CMC. These data show that the sphingosine aggregates formed at pH 9.9 are larger than those formed at pH 3.6 or 7.4, and continued to increase in size depending on the concentration between 0.5 μM and 10 μM. Compared with panel A, the aggregation ranges at both pH values revealed by the changes in Rh were consistent with those shown by μ2.
pH affects the ionic state of sphingosine and consequently its aggregation. The main objective of this study was to clarify the pH dependence of sphingosine aggregation. Our first step was to examine aggregation under conditions in which we could be reasonably sure of the sphingosine's ionic state. The reported pKa values of sphingosine are 6.7 and 9.1 (31–33). If the NH3+–NH2 transition occurs at pH 6.7 (31), the predominant ionic state of sphingosine should be the neutral form above pH 6.7, implying that the CMC should be approximately constant between pH 6.7 and pH 9.1. On the other hand, if the NH3+–NH2 transition occurs at pH 9.1 (32,33), the predominant ionic form should be the charged form below pH 9.1. In that case, raising the pH above 9.1 should neutralize the NH3+, lower the solubility of sphingosine, and consequently decrease the CMC. Our data show, however, that the CMC did not decrease significantly when the pH was raised from 7.4 to 9.9. The C50 at pH 9.9 was 0.70 ± 0.02 μM (Fig. 2 A), about the same as at pH 7.4. Unlike at pH 7.4, however, the CMC transition occurs over a wider concentration range, suggesting a new physical behavior. This is emphasized by Fig. 2 B, which shows that the mean micelle radius at pH 9.9 is larger than those at pH 3.6 or 7.4. Furthermore, Rh continues to increase as the concentration rises from 0.5 to 10 μM.
These results suggest a more complex aggregation behavior than expected. Specifically, the continued addition of sphingosine resulted in growth of the aggregate size rather than the numbers of fixed-size aggregates. We then measured C50 and Rh at pH 3.6 to ensure full ionization of the sphingosine amine group. We found that C50 = 1.71 ± 0.24 μM, and that the μ2 for aggregates was 107 s−2 (Fig. 2 A), which is significantly larger than the values (∼105 s−2) observed at pH 7.4 and 9.9. The mean micelle radius at pH 3.6 was ∼50 nm (Fig. 2 B).
The previously reported pKa of sphingosine was obtained in the presence of Triton X-100 (31) or DPPS (33). To clarify further the pH-dependent aggregation of sphingosine, we determined directly, by simple pH titrations, the pKa of sphingosine in buffer in the absence of detergent or other lipids (Fig. 3). The experiments were necessarily performed at a high sphingosine concentration at which sphingosine exists as aggregates. The pKa was determined to be 6.61 ± 0.03, and did not change as a function of salt concentration (3 mM to 1 M; data not shown). The pKa of monomeric sphingosine could not be determined because the buffering capacity of monomeric sphingosine is too small at very low concentrations (<0.5 μM; data not shown).
Figure 3.
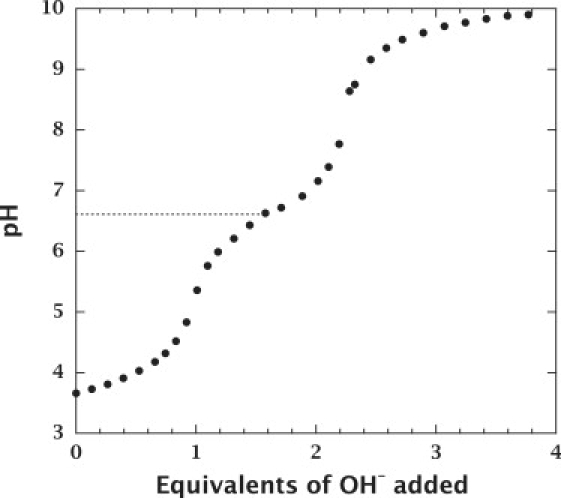
The pH titration curve of sphingosine. The initial concentration of sphingosine was 200 μM. The concentration of sphingosine decreased along with the increase in volume (up to 1.7-fold) during titration, but sphingosine exists as aggregates over the entire pH range (see Fig. 2A). The NaCl concentration was constant at 140 mM during titration. The pKa of aggregated sphingosine was determined to be 6.61 ± 0.03.
Our titration and CMC data suggested a significant structural rearrangement of sphingosine aggregates under basic conditions. We therefore carried out an NMR structural analysis of sphingosine. Despite the aggregation, the S/N ratio of the NMR spectrum (see Materials and Methods) at pH 6.7 was quite high (Fig. 4 A). All peaks were assigned by means of the 1H-13C HMQC experiment. Fig. 4 B shows 1H NMR spectra of aggregated sphingosine at three different pH values: pH 2.0 < pKa, pH 6.7 ≈ pKa, and pH 10.6 > pKa (shown in spectra a–c, respectively, of Fig. 4 B). A comparison of the spectra in panels a and b reveals that the ionic environment changed at the pKa, causing a shift of the aliphatic proton peaks located at positions 1–3 (H1–3; Fig. 1) without significant changes in the other peaks (Fig. 4 B and Table 1).
Figure 4.
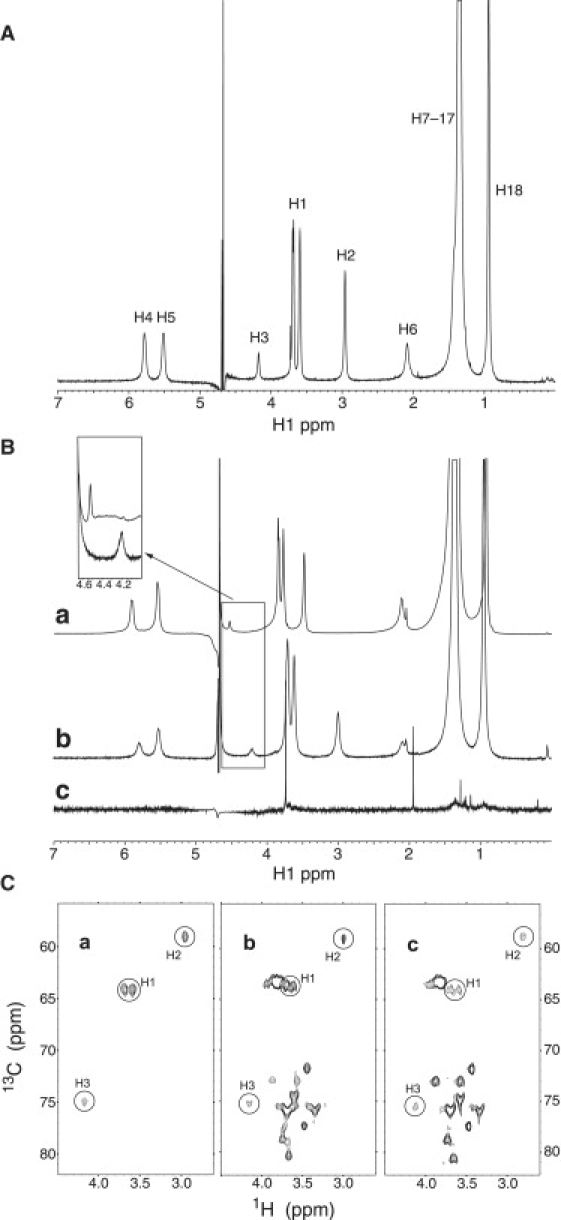
pH-dependent changes of sphingosine aggregates in bulk buffer, and mixed micelles with dodecyl maltoside. (A) 1H NMR spectrum of aggregated sphingosine (12 mM) in D2O with 26 mM NaCl (pH 6.7) at 35°C. Signals were assigned as denoted using the results of the 1H-13C HMQC experiment. (B) 1H NMR spectra of aggregated sphingosine (24 mM) at different pH values in D2O with 26 mM NaCl at 35°C. The spectra collected at pH 2.0 (< pKa), 6.7 (∼pKa), and 10.6 (>pKa) are shown as a, b, and c, respectively. The inset shows the magnified spectra at pH 2.0 and 6.7 around the peak of methine proton located at position 3 in Fig. 1 (H3). Spectra a and b suggest that the pH change around pKa influences the chemical shifts of the peaks that correspond to H1–3, whereas those of other peaks do not change significantly. This spectral change indicates that the NH3+–NH2 transition occurs on sphingosine at pKa. Notably, spectrum c is completely different from spectra a and b, and is missing sphingosine peaks. The scale for spectrum c was increased fivefold compared to spectra a and b to visualize peaks that may be in the baseline. The sharp singlet signals at 1.15, 1.30, 1.95, and 3.75 ppm in spectrum c are from a trace amount of contaminants. This suggests that a global change in the organization of aggregates occurs between pH 6.7 and 10.6. (C) 1H-13C HMQC spectra of sphingosine (12 mM) in D2O with 26 mM NaCl (pH 6.7) at 35°C (a), and sphingosine (2 mM) in the presence of dodecyl maltoside micelles (20 mM) at pH 7 (b) and 12 (c) in D2O with 25 mM NaCl at 35°C. The circles show the signals that originated from sphingosine, and the letters refer to the assignment of each signal. Other signals shown in spectra b and c are from dodecyl maltoside. These data show that, in the presence of dodecyl maltoside micelles, a pH change between pH 7 and 12 induces no significant change in the S/N ratio or in the chemical shifts of the peaks that correspond to H1–3. This suggests that the sphingosine molecules that are surrounded by the detergent molecules in micelles do not undergo morphological changes in this pH range.
Table 1.
1H chemical shifts (δ) of the NMR peaks from H1–3 in aggregated sphingosine (24 mM) at different pH values
| pH | δH1 | δH2 | δH3 |
|---|---|---|---|
| 2.0 | 3.78, 3.85 | 3.49 | 4.53 |
| 6.7 | 3.61, 3.71 | 3.00 | 4.21 |
H1–3 are the protons at positions 1–3 of sphingosine, which is adjacent to amine group at position 2. pH values of 2.0 and 6.7 are below and slightly above the pKa (6.6) of sphingosine, respectively (Fig. 3).
The spectra collected at pH 10.6 (Fig. 4 B, spectrum c) revealed broadening of all sphingosine signals to the point of being undetectable. This was reversed when the pH was lowered to pH 6.7. The S/N ratio difference between pH 6.7 and 10.6 is consistent with the change in aggregate size in this pH range detected by light scattering (Fig. 2 B). Merrill et al. (31) suggested that intramolecular hydrogen bonds are an important feature of sphingosine at acidic pH, because sphingosine contains both a donor and acceptor of hydrogen bonds. This characteristic structure is conserved in all sphingolipids. At basic pH values, this intramolecular hydrogen bonding should be reduced, possibly leading to predominant intermolecular hydrogen bonding between monomers and the stabilization of larger aggregates.
To assess the effect of intermolecular hydrogen bonding on aggregate size, experiments were carried out using sphingosine dispersed with dodecyl maltoside to disrupt possible intermolecular hydrogen bonding at all pH values. Ignoring the dodecyl maltoside peaks, Fig. 4 C shows that the spectra of sphingosine dispersed in the detergent are identical at pH 7 (Fig. 4 C, spectrum b) and pH 12 (Fig. 4 C, spectrum c), and that both are identical to the spectrum of aggregated sphingosine at pH 6.7 (Fig. 4 C, spectrum a). In contrast to the NMR data in bulk water (Fig. 4 B), in the presence of dodecyl maltoside micelles, the pH change from 7 to 12 induced no significant change in the S/N ratio or in the chemical shifts of the peaks that correspond to H1–3 of sphingosine (Fig. 4 C). These results support the idea that intermolecular hydrogen bonding is crucial for the growth of aggregate size (Fig. 2 B, pH 9.9).
Discussion
We used dynamic light scattering measurements (Fig. 2) to determine the aggregation behavior of sphingosine and S1P. This approach avoids the artifacts that might accompany indirect fluorescence measurements based on fluorophore partitioning (29,30). The measurements reveal a somewhat complex dependence of aggregation on pH. This is important because cells are not composed of organelles that have a uniform neutral pH. For example, lysosomes and endosomes have acidic pH and play important roles in sphingolipid catabolism; endocytic vesicles of sphingolipids are sorted in early endosomes and recycled back to the plasma membrane or transported to lysosomes, where they are degraded into sphingoid bases like sphingosine (1,16).
Fig. 2 A presents what we believe to be the first report of the CMC of S1P at physiological pH. The C50 of S1P, 14.35 μM, is 14-fold higher than that of sphingosine due to the attachment of phosphoryl group to the position 1 of sphingosine (Fig. 1). This may explain why S1P can serve as an effective extracellular (first) messenger, because the concentration of S1P in blood (0.1–1 μM (16)) is lower than the C50, meaning that S1P can exist as monomers in the bloodstream.
The situation for sphingosine is more complex. The pKa of sphingosine (6.61) as determined here by simple pH titration of aggregates is consistent with the value reported for Triton X-100 micelles (31). Consequently, the hypothesis that sphingosine has a net positive charge at neutral pH (1,32) is not correct for sphingosine aggregates. Approximately 86% of sphingosine molecules are in the electrically neutral (deprotonated) form in aggregates at the physiological pH of 7.4. The total concentration of sphingosine in cells is probably in the range of 0.1–1.0 μM (16), but the unbound concentration of sphingosine is uncertain. This range corresponds roughly to the range over which sphingosine aggregates in our experiment. The critical question, which cannot be answered at this time, is whether sphingosine's free energy is lower in aggregates or partitioned into other membrane components like lipoproteins. Nevertheless, understanding the aggregation of sphingosine in vitro provides a reference point for explorations of aggregation in vivo.
Fig. 2 B reveals that the ratio between aggregate and monomer can change dramatically in the submicromolar concentration range. Our finding that most sphingosine molecules in aggregates are electrically neutral at physiological pH may explain why sphingoid bases can readily move among membranes and across bilayers (1), unless transmembrane movement is impeded by acidic pH, such as in lysosomes (pH < 5.2). At pH values of 3.6 and 9.9, the protonated fractions of sphingosine are 99.9% and 0.1%, respectively. Hence, the aggregation curves at pH 3.6 and 9.9 can be taken as those for protonated and deprotonated sphingosine, respectively. Protonated sphingosine has a 2.4-fold higher C50 than deprotonated sphingosine. Furthermore, the μ2 of the aggregates composed of protonated sphingosine is higher than that of deprotonated sphingosine aggregates, which reflects the poor stability of protonated sphingosine aggregates due to the Coulombic repulsion of charged sphingosine.
The structure of the aggregates depends critically on pH values in the neighborhood of pH 7, as shown in Fig. 2 B. If the sphingosine is completely deprotonated, increases in sphingosine concentration will lead to unrestrained growth in aggregate size (pH 9.9 curve). Small amounts of protonated sphingosine, however, restrict the growth of aggregate size and cause reversion to a CMC-like behavior (pH 6.7 and pH 7.4 curves) in which increases in concentration increase the concentration rather than the size of the aggregates.
NMR data provided structural insights into the pH-dependent change of sphingosine as detected by light scattering and pH titration measurements. At the NH3+–NH2 transition, deprotonation of cationic NH3+ to neutral NH2 increases the electron densities of the atoms adjacent to the amine moiety, which causes an upfield shift in the NMR signals from those atoms (Fig. 4). Our finding that the upfield shifts were exclusively observed in the NMR peaks from H1–3 accompanying the pH increase (Fig. 4 B, spectra a and b; Table 1), supports the idea that the NH3+–NH2 transition occurs in aggregated sphingosine at pH = pKa, because sphingosine has an amine group at position 2 (Fig. 1). The line widths in NMR spectra of aggregates are strongly influenced by the particle size: slower thermal motion of larger aggregates leads to faster relaxation predominantly in the T2 relaxation pathway and, consequently, a smaller S/N ratio. The larger aggregate size at pH 9.9 compared to pH 7.4 (Fig. 2 B) supports the considerable decrease in S/N ratio induced by the pH increase from 6.7 to 10.6 (Fig. 4 B, spectra b and c).
Sphingosine can form an intramolecular hydrogen-bonding network (Fig. 5 B) (31), because it contains both a donor and acceptor of hydrogen bonds. Because this characteristic structure is conserved in all sphingolipids, we expect that sphingosine should also form intermolecular hydrogen bonds under the right circumstances, namely deprotonation of the amine group. Our data suggest that the most plausible explanation for the changes in the aggregation structure of sphingosine between pH 6.7 and 9.9 is a shift in the predominant hydrogen-bonding network from intramolecular to intermolecular (Fig. 5 C). This shift must play a key role in the formation of larger sphingosine aggregates. The finding that sphingosine surrounded by dodecyl maltoside in micelles does not demonstrate a spectral change between pH 7 and 12 (Fig. 4 C) supports this idea, because intermolecular hydrogen bonds are formed efficiently only when sphingosine molecules exist as near neighbors. This novel aggregation behavior suggests that the pKa value of 9.1 reported in a previous differential scanning calorimetry study (33) reflects the structural transition of sphingosine from an intramolecular to an intermolecular hydrogen-bonding network, because differential scanning calorimetry is sensitive to the morphological changes in aggregates rather than to direct changes in ionic state.
Figure 5.
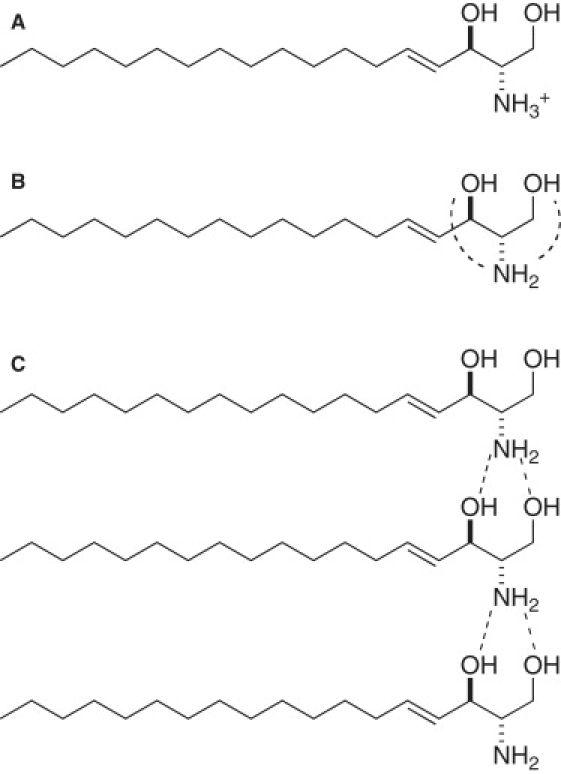
Predominant molecular states of aggregated sphingosine at different pH values suggested by the data shown in this study. (A) At pH below pKa (6.6), NH2 moiety of sphingosine is protonated. At pH slightly above pKa, sphingosine exists as an electrically neutral molecule with a deprotonated amine group. (B) As reported by Merrill et al. (31), intramolecular hydrogen bonds are formed between OH and NH2 groups of sphingosine (broken lines). (C) Between pH 6.7 and 9.9, intermolecular hydrogen bonding becomes predominant (broken lines); such bonds are efficiently formed only when sphingosine molecules exist in close proximity, which increases the mean aggregate radius.
Acknowledgments
We appreciate the gift of sphingosine from Dr. Alfred Merrill (Georgia Institute of Technology, Atlanta, GA). We thank Dr. Richard Chamberlin (University of California, Irvine, CA) for useful discussion, Dr. Evgeny Fadeev for assistance in the NMR measurements, and Michael Myers for editorial assistance.
This work was supported by LIPID MAPS Large-Scale Collaborative Grant GM-069338 from the National Institutes of Health.
References
- 1.Merrill A.H., Jr., Sandhoff K. Sphingolipids: metabolism and cell signaling. In: Vance D.E., Vance J.E., editors. Biochemistry of Lipids, Lipoproteins and Membranes. Elsevier; Amsterdam, The Netherlands: 2002. pp. 373–407. [Google Scholar]
- 2.Spiegel S., Merrill A.H., Jr. Sphingolipid metabolism and cell growth regulation. FASEB J. 1996;10:1388–1397. doi: 10.1096/fasebj.10.12.8903509. [DOI] [PubMed] [Google Scholar]
- 3.Hait N.C., Oskeritzian C.A., Paugh S.W., Milstien S., Spiegel S. Sphingosine kinases, sphingosine 1-phosphate, apoptosis and diseases. Biochim. Biophys. Acta. 2006;1758:2016–2026. doi: 10.1016/j.bbamem.2006.08.007. [DOI] [PubMed] [Google Scholar]
- 4.Merrill A.H., Jr., Sullards M.C., Wang E., Voss K.A., Riley R.T. Sphingolipid metabolism: roles in signal transduction and disruption by fumonisins. Environ. Health Perspect. 2001;109:283–289. doi: 10.1289/ehp.01109s2283. [DOI] [PMC free article] [PubMed] [Google Scholar]
- 5.Olivera A., Spiegel S. Sphingosine-1-phosphate as second messenger in cell proliferation induced by PDGF and FCS mitogens. Nature. 1993;365:557–560. doi: 10.1038/365557a0. [DOI] [PubMed] [Google Scholar]
- 6.Chang H.-C., Tsai L.-H., Chuang L.-Y., Hung W.-C. Role of AKT kinase in sphingosine-induced apoptosis in human hepatoma cells. J. Cell. Physiol. 2001;188:188–193. doi: 10.1002/jcp.1108. [DOI] [PubMed] [Google Scholar]
- 7.Hannun Y.A., Loomis C.R., Merrill A.H., Jr., Bell R.M. Sphingosine inhibition of protein kinase C activity and of phorbol dibutyrate binding in vitro and in human platelets. J. Biol. Chem. 1986;261:12604–12609. [PubMed] [Google Scholar]
- 8.King C.C., Zenke F.T., Dawson P.E., Dutil E.M., Newton A.C. Sphingosine is a novel activator of 3-phosphoinositide-dependent kinase 1. J. Biol. Chem. 2000;275:18108–18113. doi: 10.1074/jbc.M909663199. [DOI] [PubMed] [Google Scholar]
- 9.Ma Y., Pitson S., Hercus T., Murphy J., Lopez A. Sphingosine activates protein kinase A type II by a novel cAMP-independent mechanism. J. Biol. Chem. 2005;280:26011–26017. doi: 10.1074/jbc.M409081200. [DOI] [PubMed] [Google Scholar]
- 10.McDonald O.B., Hannun Y.A., Reynolds C.H., Sahyoun N. Activation of casein kinase II by sphingosine. J. Biol. Chem. 1991;266:21773–21776. [PubMed] [Google Scholar]
- 11.Megidish T., Cooper J., Zhang L., Fu H., Hakomori S. A novel sphingosine-dependent protein kinase (SDK1) specifically phosphorylates certain isoforms of 14–3-3 protein. J. Biol. Chem. 1998;273:21834–21845. doi: 10.1074/jbc.273.34.21834. [DOI] [PubMed] [Google Scholar]
- 12.Paugh S.W., Cassidy M.P., He H., Milstien S., Sim-Selley L.J. Sphingosine and its analog, the immunosuppressant 2-amino-2-(2-[4-octylphenyl]ethyl)-1,3-propanediol, interact with the CB1 cannabinoid receptor. Mol. Pharmacol. 2006;70:41–50. doi: 10.1124/mol.105.020552. [DOI] [PubMed] [Google Scholar]
- 13.Grimm C., Kraft R., Schultz G., Harteneck C. Activation of the melastatin-related cation channel TRPM3 by D-erythro-sphingosine. Mol. Pharmacol. 2005;67:798–805. doi: 10.1124/mol.104.006734. [DOI] [PubMed] [Google Scholar]
- 14.Titievsky A., Titievskaya I., Pasternack M., Kaila K., Törnquist K. Sphingosine inhibits voltage-operated calcium channels in GH4C1 cells. J. Biol. Chem. 1998;273:242–247. doi: 10.1074/jbc.273.1.242. [DOI] [PubMed] [Google Scholar]
- 15.Sabbadini R.A., Betto R., Teresi A., Fachechi-Cassano G., Salviati G. The effect of sphingosine on sarcoplasmic reticulum membrane calcium release. J. Biol. Chem. 1992;267:15475–15484. [PubMed] [Google Scholar]
- 16.Zheng W., Kollmeyer J., Symolon H., Momin A., Munter E. Ceramides and other bioactive sphingolipid backbones in health and disease: lipidomic analysis, metabolism and roles in membrane structure, dynamics, signaling and autophagy. Biochim. Biophys. Acta. 2006;1758:1864–1884. doi: 10.1016/j.bbamem.2006.08.009. [DOI] [PubMed] [Google Scholar]
- 17.Sweeney E.A., Sakakura C., Shirahama T., Masamune A., Ohta H. Sphingosine and its methylated derivative N,N-dimethylsphingosine (DMS) induce apoptosis in a variety of human cancer cell lines. Int. J. Cancer. 1996;66:358–366. doi: 10.1002/(SICI)1097-0215(19960503)66:3<358::AID-IJC16>3.0.CO;2-7. [DOI] [PubMed] [Google Scholar]
- 18.Ohta H., Yatomi Y., Sweeney E.A., Hakomori S., Igarashi Y. A possible role of sphingosine in induction of apoptosis by tumor necrosis factor-α in human neutrophils. FEBS Lett. 1994;355:267–270. doi: 10.1016/0014-5793(94)01218-0. [DOI] [PubMed] [Google Scholar]
- 19.Stevens V.L., Nimkar S., Jamison W.C.L., Liotta D.C., Merrill A.H., Jr. Characteristics of the growth inhibition and cytotoxicity of long-chain (sphingoid) bases for Chinese hamster ovary cells: evidence for an involvement of protein kinase C. Biochim. Biophys. Acta. 1990;1051:37–45. doi: 10.1016/0167-4889(90)90171-9. [DOI] [PubMed] [Google Scholar]
- 20.Hannun Y.A., Obeid L.M. The ceramide-centric universe of lipid-mediated cell regulation: stress encounters of the lipid kind. J. Biol. Chem. 2002;277:25847–25850. doi: 10.1074/jbc.R200008200. [DOI] [PubMed] [Google Scholar]
- 21.Spiegel S., Milstien S. Sphingosine 1-phosphate, a key cell signaling molecule. J. Biol. Chem. 2002;277:25851–25854. doi: 10.1074/jbc.R200007200. [DOI] [PubMed] [Google Scholar]
- 22.Spiegel S., Milstien S. Sphingosine-1-phosphate: signaling inside and out. FEBS Lett. 2000;476:55–57. doi: 10.1016/s0014-5793(00)01670-7. [DOI] [PubMed] [Google Scholar]
- 23.Cuvillier O. Sphingosine in apoptosis signaling. Biochim. Biophys. Acta. 2002;1585:153–162. doi: 10.1016/s1388-1981(02)00336-0. [DOI] [PubMed] [Google Scholar]
- 24.Maceyka, M., S. Milstien, and S. Spiegel. Sphingosine-1-phosphate: the Swiss army knife of sphingolipid signaling. J. Lipid Res. n press. [DOI] [PMC free article] [PubMed]
- 25.Ikeda, H., N. Watanabe, I. Ishii, T. Shimosawa, Y. Kume, et al. Sphingosine 1-phosphate regulates regeneration and fibrosis after liver injury via sphingosine 1-phosphate receptor 2 (S1P2). J. Lipid Res. n press. [DOI] [PMC free article] [PubMed]
- 26.Lloyd-Evans E., Morgan A.J., He X., Smith D.A., Elliot-Smith E. Niemann-Pick disease type C1 is a sphingosine storage disease that causes deregulation of lysosomal calcium. Nat. Med. 2008;14:1247–1255. doi: 10.1038/nm.1876. [DOI] [PubMed] [Google Scholar]
- 27.Karlsson K.-A. On the chemistry and occurrence of sphingolipid long-chain bases. Chem. Phys. Lipids. 1970;5:6–43. doi: 10.1016/0009-3084(70)90008-3. [DOI] [PubMed] [Google Scholar]
- 28.Pruett S.T., Bushnev A., Hagedorn K., Adiga M., Haynes C.A. Biodiversity of sphingoid bases (“sphingosines”) and related amino alcohols. J. Lipid Res. 2008;49:1621–1639. doi: 10.1194/jlr.R800012-JLR200. [DOI] [PMC free article] [PubMed] [Google Scholar]
- 29.Deguchi H., Yegneswaran S., Griffin J.H. Sphingolipids as bioactive regulators of thrombin generation. J. Biol. Chem. 2004;279:12036–12042. doi: 10.1074/jbc.M302531200. [DOI] [PubMed] [Google Scholar]
- 30.Contreras F.-X., Sot J., Alonso A., Goñi F.M. Sphingosine increases the permeability of model and cell membranes. Biophys. J. 2006;90:4085–4092. doi: 10.1529/biophysj.105.076471. [DOI] [PMC free article] [PubMed] [Google Scholar]
- 31.Merrill A.H., Jr., Nimkar S., Menaldino D., Hannun Y.A., Loomis C. Structural requirements for long-chain (sphingoid) base inhibition of protein kinase C in vitro and for the cellular effects of these compounds. Biochemistry. 1989;28:3138–3145. doi: 10.1021/bi00434a004. [DOI] [PubMed] [Google Scholar]
- 32.Goñi F.M., Alonso A. Bophysics of sphingolipids I. Membrane properties of sphingosine, ceramides and other simple sphingolipids. Biochim. Biophys. Acta. 2006;1758:1902–1921. doi: 10.1016/j.bbamem.2006.09.011. [DOI] [PubMed] [Google Scholar]
- 33.López-García F., Micol V., Villalaín J., Gómez-Fernández J.C. Interaction of sphingosine and stearylamine with phosphatidylserine as studied by DSC and NMR. Biochim. Biophys. Acta. 1993;1153:1–8. doi: 10.1016/0005-2736(93)90269-6. [DOI] [PubMed] [Google Scholar]
- 34.Sasaki H., White S.H. Aggregation behavior of an ultra-pure lipopolysaccharide (LPS) that stimulates TLR-4 receptors. Biophys. J. 2008;95:986–993. doi: 10.1529/biophysj.108.129197. [DOI] [PMC free article] [PubMed] [Google Scholar]
- 35.Patty P.J., Frisken B.J. The pressure-dependence of the size of extruded vesicles. Biophys. J. 2003;85:996–1004. doi: 10.1016/S0006-3495(03)74538-X. [DOI] [PMC free article] [PubMed] [Google Scholar]
- 36.Frisken B.J. Revisiting the method of cumulants for the analysis of dynamic light-scattering data. Appl. Opt. 2001;40:4087–4091. doi: 10.1364/ao.40.004087. [DOI] [PubMed] [Google Scholar]
- 37.Piotto M., Saudek V., Sklenar V. Gradient-tailored excitation for single-quantum NMR spectroscopy of aqueous solutions. J. Biomol. NMR. 1992;2:661–665. doi: 10.1007/BF02192855. [DOI] [PubMed] [Google Scholar]
- 38.Delaglio F., Grzesiek S., Vuister G.W., Zhu G., Pfeifer J. NMRPipe: a multidimensional spectral processing system based on UNIX pipes. J. Biomol. NMR. 1995;6:277–293. doi: 10.1007/BF00197809. [DOI] [PubMed] [Google Scholar]
- 39.Santos N.C., Silva A.C., Castanho M.A.R.B., Martins-Silva J., Saldanha C. Evaluation of lipopolysaccharide aggregation by light scattering spectroscopy. ChemBioChem. 2003;4:96–100. doi: 10.1002/cbic.200390020. [DOI] [PubMed] [Google Scholar]