

Abstract
Ligand-induced receptor aggregation is a well-known mechanism for initiating intracellular signals but oligomerization of distal signaling molecules may also be required for signal propagation. Formation of complexes containing oligomers of the transmembrane adaptor protein, linker for the activation of T cells (LAT), has been identified as critical in mast cell and T cell activation mediated by immune response receptors. Cross-linking of LAT arises from the formation of a 2:1 complex between the adaptor Grb2 and the nucleotide exchange factor SOS1, which bridges two LAT molecules through the interaction of the Grb2 SH2 domain with a phosphotyrosine on LAT. We model this oligomerization and find that the valence of LAT for Grb2, which ranges from zero to three, is critical in determining the nature and extent of aggregation. A dramatic rise in oligomerization can occur when the valence switches from two to three. For valence three, an equilibrium theory predicts the possibility of forming a gel-like phase. This prediction is confirmed by stochastic simulations, which make additional predictions about the size of the gel and the kinetics of LAT oligomerization. We discuss the model predictions in light of recent experiments on RBL-2H3 and Jurkat E6.1 cells and suggest that the gel phase has been observed in activated mast cells.
Introduction
Ligand-induced receptor aggregation is a ubiquitous method for triggering intracellular signals. The growth factor receptors (1), the cytokine receptors (2), and the immune recognition receptors (with the possible exception of the T cell receptor (TCR)) (3) all initiate signaling in this way. Within these families, multiple mechanisms have been elucidated by which ligands promote the aggregation of their cognate receptors and cause the cytoplasmic domains of the aggregated receptors to remain in proximity for times much longer than random motions of diffusing receptors permit. The role of aggregation in cell signaling is not confined to bringing together the cytoplasmic domains of receptors. Aggregation of nonreceptor molecules also play a role in propagating the cell-signaling cascade. Here, we focus on the aggregation of a scaffolding protein, the linker for the activation of T cells (LAT), which is essential for full mast cell and T cell function (4). The aggregation of LAT differs from the aggregation of receptors by external ligands in a fundamental way—LAT has a variable valence for binding the complex that induces its aggregation depending on the number of binding-site tyrosines that are phosphorylated.
LAT, which is localized primarily in microdomains (5), can be thought of as a major signaling hub in the signaling networks initiated by the activation of the high affinity receptor for IgE (FcɛRI) on mast cells and the TCR on T cells. LAT is a single-chain transmembrane protein whose cytoplasmic domain contains nine tyrosines conserved among mouse, rat, and human (6,7). The distal four LAT tyrosines are essential for both T cell (8) and mast cell function (9). The distal three tyrosines are located in motifs of the form YXNX that bind the SH2 domain of the adaptor Grb2 when phosphorylated (10). Thus, the valence of LAT for Grb2 can vary from zero to three, depending on the number of phosphorylated LAT tyrosines.
Grb2 mediates the recruitment of the nucleotide exchange factor Son of sevenless-1 (SOS1) from the cytosol to the plasma membrane where it activates Ras by inducing the exchange of GDP for GTP (11,12). Grb2 contains one SH2 domain flanked on each side by a Src homology 3 (SH3) domain (13,14) (see Fig. 1). The two SH3 domains of Grb2 bind to proline-rich regions on SOS1 to form a 1:1 Grb2-SOS1 complex. A second Grb2 can bind through both its SH3 domains to this complex to form a Grb2-SOS1-Grb2 dimer that is capable of bridging two phosphorylated LAT molecules (15) (see Fig. 2). The interaction of this bivalent ligand (Grb2-SOS1-Grb2) with a trivalent scaffolding protein (LAT with its three distal tyrosines phosphorylated) can induce formation of large aggregates. The formation of large clusters of LAT has been observed in T cells following T cell engagement (15,16) and in mast cells following the aggregation of IgE-FcɛRI complexes (17,18).
Figure 1.
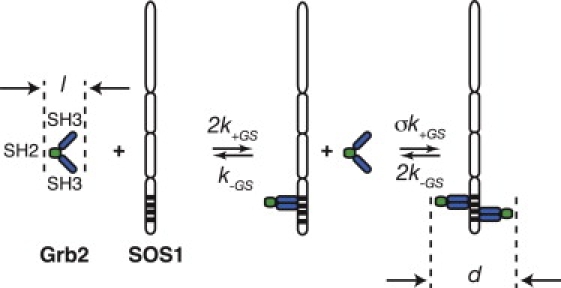
Model for the interactions of Grb2 with SOS1 and the formation of a Grb2-SOS1-Grb2 dimer. For Grb2 to form a stable complex with SOS1, both SH3 domains of Grb2 must simultaneously bind to SOS1. The value σ is the factor by which the presence of a Grb2 bound to SOS1 reduces the equilibrium constant for the binding of the second Grb2 to SOS1. The value l is the length of a Grb2 and d is the length between the SH2 domains of Grb2 in a Grb2-SOS1-Grb2 dimer.
Figure 2.
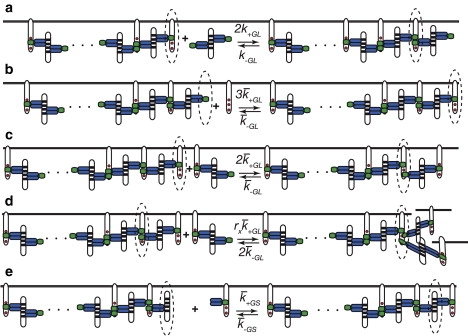
Reactions in the oligomerization of LAT. The dotted ellipse indicates the molecule in the complex involved in the reaction. Only the C-terminal domain of SOS1, which contains the binding sites for the SH3 domains of Grb2, is shown. (a) Solution to surface binding: The binding of a bivalent ligand in solution to a LAT with two sites free that is at the end of a chain. (b) Surface to surface cross-linking that extends a chain: The binding of a free LAT to a Grb2 dimer that is part of a surface complex. (c) Surface to surface cross-linking that extends a chain: A bivalent ligand bound to LAT binds through its free SH2 domain to a free site on a LAT at the end of a chain. (d) Surface-to-surface cross-linking that adds a branch to a complex: A bivalent ligand bound to LAT binds through its free SH2 domain to a free site on a LAT in the complex. The value rx is a steric hindrance factor. (e) Surface to surface cross-linking that extends a chain: A Grb2-LAT complex binds through the free Grb2 SH3 domain to a SOS1 at the end of a chain.
Previously, an equilibrium theory for the binding of trivalent ligands to bivalent receptors was developed to study cross-linking of IgE on the surface of mast cells (19). One interesting prediction of the theory was that for a range of ligand and receptor concentrations, extremely large aggregates, i.e., superaggregates, could form on the cell surface. The theory predicted that if the receptor concentration were high enough, then as the ligand concentration was increased a critical ligand concentration would be reached where superaggregates would form, corresponding to a sol-gel phase transition. Superaggregates do not form for ligands with a valence of one or two interacting with bivalent receptors. Upon exposure to ligands of valence greater than two, gel-like formation was observed on liposomes into which high densities of mobile receptors were inserted (20,21). In the case of LAT, these results suggest that a similar phase transition could arise from valence-switching brought about by increased LAT phosphorylation in response to ligand-induced receptor aggregation. However, there are significant differences between the two systems beyond LAT aggregation occurring on the plasma membrane's inner surface and receptor aggregation occurring on its outer surface. When fully phosphorylated, LAT acts as a trivalent receptor for the SH2 domain of Grb2, but Grb2 is present in three forms that can bind LAT—two monovalent (Grb2 and Grb2-SOS1) and one bivalent (Grb2-SOS1-Grb2)—the relative and absolute concentrations of which change in response to LAT phosphorylation (15).
Here, we present a chemical kinetic model for the oligomerization of LAT mediated by interaction with the 2:1 Grb2:SOS1 complex. We solve the model using two methods that complement each other. Following Goldstein and Perelson (19), we develop an analytic equilibrium theory that allows us to predict the equilibrium LAT oligomer size distribution, given the total cellular concentrations of LAT, Grb2, and SOS1. We also use the theory to map the boundaries of the sol-gel concentration space to give us precise predictions of the conditions under which superaggregates can form. The equilibrium theory is exact for an infinite system, but for a system with a finite number of particles, such as a cell, the question arises whether the effects of finite system size (e.g., an upper limit on the number of molecules in a superaggregate) will lead to significant deviations from the continuum limit. Although the equilibrium theory predicts the fraction of LAT molecules in the sol-gel coexistence region, it makes no prediction about size distribution of superaggregates. Thus, to check the validity of the equilibrium theory, to make additional predictions about the size distribution of superaggregates, and to follow the kinetics of LAT oligomerization, we also solve the model using a kinetic Monte Carlo method designed to simulate well mixed-biochemical networks governed by rules describing molecular interactions (22). The equilibrium theory and the simulation results are in good agreement. Both predict the formation of superaggregates of LAT over certain concentration ranges of the interacting components with disparities arising only at the edges of these ranges.
The organization of the remainder of this article is as follows. First, we present the model of LAT aggregation and describe simplifying assumptions. We then describe the two methods of solution, providing overviews of both the equilibrium theory and the stochastic simulations, which are elaborated in the Appendices and in the Supporting Material. Finally, we present the results obtained using the two methods and discuss them in light of recent experiments.
Model of Lat Oligomerization
We consider a cell with a cytosolic volume, V, and a surface area, A. The total number of LAT molecules associated with the plasma membrane is ALT, while the total number of Grb2 and SOS1 available to interact with LAT and each other are VGT and VST. The surface concentrations of free LAT, and the solution concentrations of free Grb2 and SOS1, are L, G, and S. Their nondimensional concentrations we define as l = L/LT, g = G/GT, and s = S/ST. The definitions of the parameters and concentrations used in the article are listed in Table 1. The model consists of two parts: the interactions in the cytosol between Grb2 and SOS1 (see Fig. 1); and the interactions at the plasma membrane that lead to the formation of complexes containing LAT (see Fig. 2).
Table 1.
Glossary of mathematical symbols and terms
| Symbol | Definition | |
|---|---|---|
| V | Cytosolic volume of the cell. | |
| A | Surface area of the cell. | |
| ALT | Total number of phosphorylated LAT on the plasma membrane. | |
| VGT | Total number of Grb2 per cell. | |
| VST | Total number of SOS1 per cell. | |
| L | Surface concentration of LAT with all phosphorylated sites free. | |
| l = L/LT | Fractional concentration of free LAT. | |
| G | Cytosolic concentration of Grb2 not bound to SOS1. | |
| g = G/GT | Fractional concentration of free Grbg2. | |
| S | Cytosolic concentration of SOS1 not bound to Grb2. | |
| s = S/ST | Fractional concentration of free SOS1. | |
| C | Cytosolic concentration of the Grb2-SOS1-Grb2 dimer. | |
| Wn = LTwn | Concentration of aggregates containing n LAT molecules. | |
| w ≡ w1 | Fraction of LAT not in aggregates. | |
| wn, m | Fraction of LAT in aggregates contain n LAT and m branch points. | |
| KGS = k+GS/k−GS | Solution equilibrium binding constant for both Grb2 SH3 domains to bind to a free SOS1. | |
| σ | Negative cooperativity factor (see Fig. 1). | |
| σKGS = σK+GS/k−GS | Solution equilibrium binding constant for both Grb2 SH3 domains to bind to a SOS1-Grb2 complex. | |
| KGL = k+GL/k−GL | Solution equilibrium binding constant for a Grb2 SH2 domain to bind to a binding site on LAT. | |
| Surface equilibrium cross-linking constant for a free end of a Grb2 dimer attached to a LAT to bind to a binding site on a LAT at the end of a chain. | ||
| rx | Steric hindrance factor (see Fig. 2). | |
| Surface equilibrium branching constant for a free end of a Grb2 dimer attached to a LAT to bind to a binding site on another LAT with one site free and start a new chain. | ||
| γ | Branching parameter defined by Eq. 22. | |
| fg | Fraction of LAT in the gel phase. |
Formation of Grb2-SOS1-Grb2 dimers
Grb2 is a highly flexible 25 kDa protein that contains an SH2 domain flanked by two SH3 domains (13,14). SOS1 (153 kDa) is a complex multidomain nucleotide exchange factor that contains a number of proline-rich sequences in its N-terminal domain that are binding sites for the SH3 domains of Grb2. Fig. 1 shows the kinetic scheme, based on the Grb2-SOS1 equilibrium binding studies of Houtman et al. (15), that we use to model the interactions between Grb2 and SOS1 in the cytosol. For appropriate concentrations, these interactions result in the formation of bivalent ligands containing two Grb2 SH2 domains that are capable of bridging two phosphorylated LAT molecules (see Fig. 1). The equilibrium constant for the binding of the first Grb2 to a free SOS1 is 2KGS. The binding of a second Grb2 to a 1:1 Grb2-SOS1 complex is taken to be negatively cooperative with equilibrium constant σKGS and the cooperativity factor σ < 1 (15). From the law of mass action, it follows that at equilibrium the concentration of the bivalent ligand Grb2-SOS1-Grb2 in the cytosol is
| (1) |
We have simplified the dimerization model by assuming that Grb2, bound through both its SH3 domains to SOS1, is much more stable than Grb2 bound through a single SH3 domain. In the binding scheme in Fig. 1, we have therefore ignored states where Grb2 is bound to SOS1 through a single SH3 domain.
Interactions involving LAT
LAT is a 26-kDa integral membrane protein with nine conserved tyrosines (6,7). The distal three tyrosines, Y171, Y191, and Y 226 on human LAT, when phosphorylated, are binding sites for Grb2 (23,24). Phosphorylated Y171 and Y191 are also binding sites for the adaptor Gads (8,24); however, in the model we ignore Gads and assume the only protein that can interact with these sites is Grb2. We further simplify by treating the three Grb2 binding sites as identical and noninteracting so that one equilibrium constant, KGL, describes the binding of a LAT phosphotyrosine in a Grb2-binding motif to the SH2 domain of a free Grb2. (The difference between the smallest and largest equilibrium constant for the three sites is no greater than a factor of four (23,25).) Making this equivalent-site approximation simplifies the equilibrium theory we will develop. We further simplify the model by assuming the binding properties of the Grb2 SH2 domain are the same whether Grb2 is free or in a complex with SOS1. These approximations ignore the following: that the binding of SOS1 or the SOS1-Grb2 complex to Grb2 reduces the equilibrium binding constant for the binding of Grb2 to a singly-phosphorylated LAT; and that the binding of Grb2-SOS1 to a doubly-phosphorylated LAT is positively cooperative (25).
Depending on its state of phosphorylation, a LAT molecule may be mono-, bi-, or trivalent with respect to Grb2. When mast cells are exposed to an external ligand that causes the aggregation of FcɛRI on their surface, LAT is rapidly phosphorylated (17). Similarly for the T cell, aggregation of the TCR is rapidly followed by LAT phosphorylation (26). We expect that the number of phosphorylated Grb2 binding sites will change with time and with the concentration of the external ligand. However, here we only consider homogeneous populations of phosphorylated LAT, and compare the oligomerization properties of bi- and trivalent LAT in the presence of Grb2 and SOS1.
In Fig. 2, a–d, we show various reactions involved in the oligomerization of LAT: the addition of a bivalent ligand from solution to a LAT complex (Fig. 2 a); the cross-linking of a LAT to extend a chain in a LAT complex (Fig. 2, b and c); and the cross-linking of a LAT to a LAT in the complex that results in the initiation of a new branch (Fig. 2 c). At equilibrium, these reactions are characterized by a solution equilibrium binding constant, KGL, a surface equilibrium cross-linking constant, , and a surface equilibrium branching constant, , where rx is a steric hindrance factor. If rx = 0, the binding of two sites on LAT blocks the third site and branching cannot occur, whereas if rx = 1, there is no steric hindrance and cross-linking and branching have identical equilibrium constants. There are no experiments measuring rx and none that show directly that a single LAT can bind three Grb2 molecules simultaneously. However, it has been shown that the three Grb2 binding site tyrosines as well as two additional tyrosines must be present on the same LAT molecule to achieve Erk activation (27). We assume three Grb2 molecules can bind to a single LAT and take rx = 1.
The reaction in Fig. 2 e introduces the surface equilibrium cross-linking constant, . From detailed balance, it follows that
| (2) |
For the equilibrium theory, there is no need to introduce this constant, but for our simulations we will need the rate constants for this reaction. For the simulations, we will take and therefore, .
A major assumption of the model is that reactions that lead to the formation of closed structures (loops) can be ignored. A special case of this assumption is that the dimer Grb2-SOS1-Grb2 cannot have its two Grb2 molecules bound simultaneously through their SH2 domains to the same LAT molecule. If structures with loops in them have a strong propensity to form, then the theory we present will overestimate the concentration of large aggregates. In a solution binding study of a bivalent receptor (IgG) interacting with a synthetic trivalent ligand, small ring formation completely prevented the formation of large aggregates (28). That does not appear to be the case for LAT aggregation, because large aggregates of LAT, i.e., >100 LAT molecules in a cluster, have been observed in stimulated mast cells (17).
Parameter values
The parameter values of the model are given in Table 2. The solution equilibrium binding constants for the binding of the SH3 domains of Grb2 to SOS1 (15,29) and the binding of Grb2 to its three binding sites on LAT (15,23,25) have been well studied. Not surprisingly, however, there are no experimental estimates of the surface equilibrium cross-linking constant , which characterizes the bridging of two LAT molecules by a Grb2-SOS1-Grb2 dimer. is proportional to KGL because the cross-link is formed when a Grb2 SH2 domain binds to a Grb2 binding site on LAT. If, when a bivalent ligand has one end bound to a receptor its free end can still search the surface in its vicinity in a relatively unrestricted way, then an estimate of the surface equilibrium cross-linking constant is given by (30)
| (3) |
where φ is a constant of order one and d is the effective length of the cross-linking species Grb2-SOS1-Grb2. From the Grb2 crystal structure (31), the length of a Grb2 from its SH2 to its SH3 domain (l in Fig. 1) is ∼50 Å, so that d = 100 Å+ (length of the section of SOS1 involved in the dimer) ≈150 Å. Because SOS1 is approximately six times larger than LAT, we expect that the size of SOS1 will hinder cross-linking and reduce compared with a single dimeric protein of length d. A larger value of d/φ reduces . To estimate , we take d/φ = 200 Å.
Table 2.
Parameters used in the simulations and the equilibrium model calculations
| Parameter | Value | Reference | |
|---|---|---|---|
| V | 3.6 × 10⁻¹⁰ cm3 | (53) | |
| A | 8.0 × 10⁻⁶ cm2 | (53) | |
| σ | 0.5 | (15) | |
| KGL | 3.4 × 10⁶ M−1 | (15, 23, 25) | |
| k−GL | 0.31 s−1 | (54) | |
| k+GL = k−GLKGL | 1.1 × 10⁶ M−1 s−1 | ||
| KGS | 2.7 × 10⁶ M−1 | (15) | |
| k+GS | 9.5 × 10⁴ M−1 | (29) | |
| k−GS = k+GS/KGS | 0.03 s−1 | ||
| 1.7 × 10¹⁵ mole−1 cm2 | ∗ | ||
| 0.31 s−1 | |||
| 5.3 × 10¹⁴ mole−1 cm2 s−1 | |||
| 6.75 × 10¹⁴ mole−1 cm2 | |||
| 0.31 s−1 | |||
| 2.1 × 10¹⁴ mole−1 cm2 s−1 |
The equilibrium constants for the binding of Grb2 to one of the three terminal phosphotyrosines on LAT range from 1–4 × 10⁶ M−1 (15,23,25). In our model the affinities for these three binding sites are identical. We take KGL = 3.4 × 10⁶ M−1. The value for k−GL is from a Biacore study of the binding of the SH2 domain in a Grb2-SOS1 complex to an eleven peptide sequence from the cytoplasmic domain of EGFR that includes the Grb2 binding site pY1068 (54). We assume the dissociation rate constant is similar for Grb2 dissociating from a phosphorylated site on LAT. The values of the rate constants have no effect on any equilibrium results. The dissociation constants for the binding of the Grb2 SH3 domain to the N-terminal and C-terminal proline-rich regions of SOS1 are 260 nM and 510 nM, respectively (15). In our model we do not distinguish between the two SH3 binding sites on SOS1 and take Kd = 364 nM which is close to the geometric mean of the two values.
The value of the equilibrium cross-linking constant is estimated from Eq. 3 by taking d/ϕ = 200 Å. To obtain we assume . The diameter of the Jurkat cell, 2a, has been measured by Rosenbluth et al. (53) to be 11.5 μm with the cytosol taking up ∼45% of the total cell volume. V = 0.45 × 4πa3/3 is the cytosolic volume. The surface area of the Jurkat cell is taken to be approximately twice the area of a sphere of diameter 11.5 μm. In the stochastic simulations, only unimolecular rate constants can be used directly so the solution bimolecular rate constants are scaled by the cytosolic volume V and the surface bimolecular rate constants are scaled by A.
Concentration values
In addition to the values of the parameters, we need to specify the concentrations of LAT, Grb2, and SOS1 that are available to interact with each other. For both RBL-2H3 cells and Jurkat E6.1 cells, it has been estimated that there are ∼1.1 ± 0.1 × 10⁶ LAT molecules/cell (I. Reischl and H. Metzger, unpublished results), although not all of these LATs may be on the plasma membrane. This estimate places an upper bound on the number of phosphorylated LATs in our model. Based on four experiments with Grb2 and two with SOS1, the concentration in Jurkat E6.1 cells of Grb2 was estimated to be 1.3 ± 0.4 × 10⁶ molecules/cell and of SOS1 to 1.3 ± 0.4 × 10⁵ molecules/cell (J. C. Houtman and L. E. Samelson, unpublished results). For RBL cells, we know of no determination of these concentrations. These values are listed in Table 3. Grb2, through its SH2 or SH3 domains, can bind to numerous signaling molecules besides SOS1 (32). Thus, its concentration listed in Table 3 is an upper bound on the concentration of Grb2 available to interact with SOS1.
Table 3.
Estimated cellular concentrations
| Parameter | Jurkat E6.1 human T cells (molecules/cell) | RBL-2H3 cells (molecules/cell) |
|---|---|---|
| LT | 1.1 ± 0.1 × 10⁶ | 1.1 ± 0.1 × 10⁶ |
| GT | 1.3 ± 0.4 × 10⁶ | ND |
| ST | 1.3 ± 0.4 × 10⁵ | ND |
The concentrations of LAT in the two cell lines are unpublished results determined by I. Reischl and H. Metzger. The concentration of Grb2 and SOS1 in Jurkat cells are unpublished results determined by J. C. Houtman and L. E. Samelson.
Equilibrium Theory
To develop the equilibrium theory, we follow the same approach as Perelson and Goldstein (19). We enumerate and assign the correct statistical weights (the relative concentrations) to all possible complexes involving Grb2, SOS1, and LAT. The sum of these weights is the partition function. From the partition function, we can easily obtain the conservation laws for Grb2, SOS1, and LAT, the solution of which yields their free concentrations. Knowing these quantities, we can calculate all quantities of interest.
Bivalent LAT
We start by considering a homogeneous population of bivalent LAT, i.e., each LAT has only two of its three Grb2 binding sites phosphorylated, so that only linear chains of LAT can form. In Fig. 3, all linear chains that begin and end with a LAT with one site free are shown. For linear chains of the form shown in Fig. 3, the equilibrium concentration of a complex of two LATs cross-linked by a Grb2-SOS1-Grb2 is , whereas the equilibrium concentration of a complex of n LATs cross-linked by n-1 Grb2 dimers is . Each end of a linear chain can be unbound, or bound to a single Grb2, a Grb2-SOS1, or a Grb2-SOS1-Grb2. The concentration of all complexes containing only one LAT can be written as E2L and the concentration of complexes containing n LATs as , where
| (4) |
Figure 3.
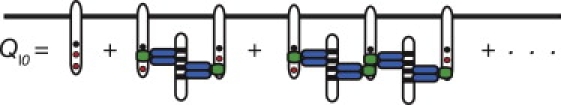
For bivalent LAT, the partition function Ql0 for linear chains that begin and end with a LAT with one site free. Solid circles indicate phosphorylated Grb2 binding sites on LAT.
We will use the notation that Wn is the concentration of LAT molecules that are in aggregates of size n, i.e., in aggregates that contain n LAT molecules, and that wn = Wn/LT. We denote the fraction of all species containing only one LAT by w,
| (5) |
The fraction of LAT in aggregates having n LATs is
| (6) |
It is useful to introduce the following nondimensional parameters:
| (7) |
| (8) |
Equation 6 can be rewritten
| (9) |
where
| (10) |
We can now obtain the normalized partition function ql, which we define as the sum of the fractional concentrations of all LAT-containing species, i.e.,
| (11) |
To obtain the conservation laws for LAT, Grb2, and SOS1 we note that each term in ql is of the form Ωi,j,kSiGjLk/LT, where i, j, and k are the number of SOS1, Grb2, and LAT molecules in the species and Ωi,j,k is a statistical weighting factor. Recognizing this, we can, for example, express the conservation law for SOS1 as
| (12) |
where the terms multiplied by V represent the concentrations of SOS1 and its complexes in solution and the terms multiplied by A represent the concentrations of SOS1 in complexes with LAT at the surface. In terms of the nondimensional parameters, Eq. 7, the conservation laws can be written as
| (13) |
| (14) |
| (15) |
The same conservation laws hold for trivalent LAT when ql is replaced by q, the partition function, which is the sum of the fractional concentrations of all aggregates that can be formed with trivalent LAT.
Trivalent LAT
Linear chains
We now obtain expressions for the concentrations of all aggregates that can form among LAT, SOS1, and Grb2 when LAT has three binding sites for Grb2. Once this is done, we can obtain the partition function, q, and then, the conservation laws by replacing ql with q in Eqs. 13–15. We start by considering all linear chains that contain two or more LAT molecules. It is instructive to consider the linear chain of LATs shown on the right side of the reaction in Fig. 2 a. Note that for this chain the interior LATs have one free site each and each of the two LATs at the ends of the chain has two free sites. As discussed for the bivalent case, in general, the binding sites on LAT not involved in cross-linking can be free, or bound to Grb2, or Grb2-SOS1, or Grb2-SOS1-Grb2. Thus, we expect the concentration of all linear chains containing n LATs to be proportional to En+2 = (1 + β)n+2 for n ≥ 2, where E is defined by Eq. 4. We show in Appendix A that the sum of the concentrations of all linear chains (n ≥ 2) is
| (16) |
where β is given by Eq. 4. We define the dimensionless linear chain partition function as q0 = Q0/LT.
| (17) |
The above equation can be rewritten as
| (18) |
For trivalent LAT, the fraction of all LAT molecules not in aggregates with other LAT is
| (19) |
Recall that for bivalent LAT, w is given by Eq. 5. With the above expression for w and the definition of δ, Eq. 18 can be rewritten as
| (20) |
Branched chains
To obtain the partition function, q, which includes both linear and branched structures, we follow the procedure for counting aggregates used by Goldstein and Perelson (19). We only give a brief outline of the method. (For references and details, see (19).) As discussed at the end of Modeling of LAT Oligomerization, we only consider structures that do not contain rings. In graph theory, these are called “trees”. The method starts by considering a subset of all trees called “planted-plane” trees. As its name implies, a planted-plane tree is a tree with one end, its root, distinguished from all other ends. Goldstein and Perelson (19) showed that a way to count and assign the correct statistical weight to molecular aggregates that contain no loops is to first count and weight planted-plane trees and then to correct for the degeneracy that arises by having chosen one particular end at which to begin the counting. The procedure to enumerate and weight all possible trees, starts by defining a planted-plane tree of order zero as a linear chain, and a planted-plane tree of order one as a linear chain or a planted-plane tree with a single branch point (see Fig. 3 in (19)). A planted-plane tree of order k is defined to be either a linear chain or a planted-plane tree that starts with a linear chain and then bifurcates into two planted trees that are each of order k − 1. Defined in this way, a planted-plane tree of order k is the sum of all trees of all orders up to, and including, k. Thus, in the limit that k → ∞, all possible planted-plane trees are represented.
All planted-plane trees start with a linear chain whose rooted end has two Grb2 binding sites that are not cross-linked to another LAT. These may be free (as, for example, the leftmost ends of the linear chains in Fig. 2) or bound (to Grb2, Grb2-SOS1, or Grb2-SOS1-Grb2). To form a branch point, we start by considering a linear chain with one end rooted and the other end having a LAT with two unoccupied Grb2 binding sites. Chains of all lengths with these ends contribute a term q0/(1 + β)2 to the partition function. (We divide by (1 + β)2, because the chains we consider have one end with two free sites, while q0 is the sum of concentrations for all possible linear chains.) A branch point is formed at the end of a chain when the reaction in Fig. 2 c is followed by the reaction in Fig. 2 d. The equilibrium concentration of the Grb2-SOS1-Grb2-LAT species is 6KGLLC. Hence, the binding of a Grb2-SOS1-Grb2-LAT ligand to the first Grb2 binding site (Fig. 2 c) contributes a term to the partition function, while the binding to the second Grb2 binding site on LAT contributes a term (Fig. 2 d with rx = 1). Thus, for a linear chain with a branch point leading to two LAT molecules, one obtains the nondimensional partition function . To count all planted plane trees with a single branch point, we need to allow the two arms that bifurcate from the linear planted chain to be of arbitrary length, and to allow the two Grb2 binding sites on each of the two LAT molecules at the ends of the two arms to be either free or bound. Formally, we do this by replacing 6KGLLC with . Consequently, q1, the partition function for a tree of order 1, is given by
| (21) |
where the branching parameter γ is defined as
| (22) |
Using Eq. 19, γ can be rewritten as
| (23) |
Equation 21 is identical in form to Eq. 8 in Goldstein and Perelson (19), and thus, the derivation of the full partition function that follows from this equation holds as well. Therefore, from Goldstein and Perelson (19) we have
| (24) |
Given the functional forms of w, γ, and q0, q can be expressed as a function of the concentrations g, s, and l, which can be determined by solving the conservation equations, Eqs. 13 and 14.
Concentration of LAT aggregates containing n receptors
We are interested in obtaining the LAT aggregate size distribution for any set of concentrations of Grb2, SOS1, and LAT. Recall that we have denoted the fractional concentration of aggregates containing n LAT by wn and for n = 1 we have set w1 ≡ w. For n ≥ 2, we obtain, in Appendix B, a general expression for wn,m, the fractional concentration of aggregates containing n LAT and m branch points. Then, for n ≥ 2, , where wn, m and mmax are given by Eqs. 59 and 62 in Appendix B. To illustrate, we evaluate wn for LAT aggregates up to hexamers, i.e., n = 6. From Eq. 62, the values of mmax for (n = 2, 3), (n = 4, 5), and n = 6 are 0, 1, and 2, respectively:
| (25) |
| (26) |
| (27) |
| (28) |
| (29) |
and
| (30) |
It should be noted that the wn, 0 values obtained from Eq. 59 refer to linear chains containing n LAT molecules and hence are identical to the terms in the expansion of q0 in Eq. 20. The average size of a LAT aggregate containing two or more LAT molecules is given by
| (31) |
The presence of a monovalent Inhibitor for LAT
To directly test whether LAT oligomerization plays a role in signaling, Houtman et al. (15) inhibited LAT oligomerization in Jurkat E6.1 cells by expressing a C-terminal fragment of SOS1 (CSOS1) that contained a single C-terminal proline-rich domain. The fragment bound the Grb2 with a 1:1 stoichiometry so that the Grb2-CSOS1 complex could not bridge two LAT molecules. The expression of the SOS1 fragment reduced the size of clusters of phosphorylated LAT and the activation of downstream signaling pathways.
We add CSOS1 to the model by first defining IT and I as the total and free concentrations of CSOS1. We let
| (32) |
and
| (33) |
In the presence of CSOS1, the resulting Grb2-CSOS1 complex acts as a chain terminator, as it cannot bridge two LAT molecules. Hence, to account for the presence of CSOS1, we replace β in Eq. 4 by
| (34) |
When CSOS1 is present, the partition function is still given by Eq. 24 but with β in the expressions for q0, γ, and w replaced by βI. Calling the partition function for LAT qI when the inhibitor CSOS1 is present, the conservation equations for LAT, Grb2, SOS1, and CSOS1 become
| (35) |
| (36) |
| (37) |
| (38) |
Solving Eqs. 35–38 yields g, s, l, and ι, which in turn can be used to determine the size distribution of LAT aggregates and the average LAT aggregate size in the presence of CSOS1.
Formation of a gel-like phase for trivalent LAT
When bivalent LAT interacts with a bivalent ligand, only linear aggregates can form and no gel-like state is possible (19). However, for trivalent LAT, where branched aggregates can form, the possibility arises that a gel-like state, i.e., a superaggregate, can form.
We define M1 and M2 as the first and second moments, respectively, of the trivalent LAT aggregate distribution. Then,
| (39) |
and
| (40) |
The first moment is the fraction of trivalent LAT in finite-sized aggregates. In the absence of infinite aggregates, M1 = 1, which is tantamount to the conservation law for trivalent LAT. The second moment is the average size of all entities containing trivalent LAT. Consider now a situation where we can vary the concentration of LAT. Below a certain critical value of LAT, all the aggregates are finite. It is possible, however, that for appropriate concentrations of SOS1 and Grb2, when the LAT concentration is increased beyond the critical value, a superaggregate will form. In increasing LAT, one has gone from a pure sol phase where only finite size aggregates are present, to a phase where sol and gel (a superaggregate) coexist. At the gel point where the transition occurs, M1 = 1 but M2 diverges, indicating the presence of superaggregates. In the sol-gel region, M1 < 1, and 1 − M1 is the fraction of LAT in the gel phase.
Using the conditions that M1 = 1 and M2 blows up at the boundary between of the sol-gel region, we show in Appendix C that the following three equations hold at the boundary:
| (41) |
| (42) |
| (43) |
Given the total number of LAT and Grb2 molecules present in the system, we can use the above three equations to predict whether gel formation is possible and if it is, over what range of SOS1 concentrations the superaggregate formation can occur. Equations 41–43 can be simultaneously solved for . For some values of GT and LT these three equations have no physically acceptable roots, indicating that for these values of GT and LT there is no concentration of SOS1 for which gel-like aggregates can form. For the pair at which gel-formation is possible, we obtain two physically acceptable solution sets of , which correspond to the boundaries in parameter space where the gel-formation sets in. Given the values, the higher ST value corresponding to a gel point we denote by SuT, and the lower ST value corresponding to a second gel point we denote by SlT. Thus, along the line segment in the parameter space joining the points and , we have small aggregates of LAT coexisting with a gel-like phase (see Fig. 7 a).
Figure 7.
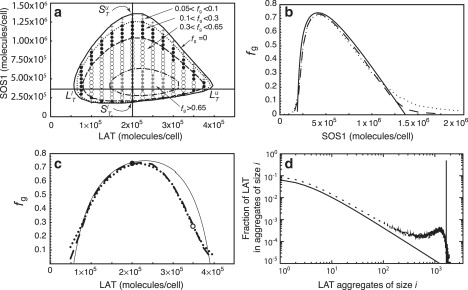
(a–d) GT = 7.5 × 10⁵. (a) Contour plots of fg, the fraction of LAT molecules in the gel phase, from theory and simulations. The boundary enclosing the sol-gel region (solid line) is the same as in Fig. 6b. In the gel phase, four regions are shown that are characterized by different theoretical ranges of fg. These are separated by dotted, dashed and dotted-dashed lines. Symbols show the simulation results: 0.05 < fg < 0.1 (crosses), 0.1 < fg < 0.3 (dots), 0.3 < fg < 0.65 (open dots), and fg > 0.65 (stars). The simulation results were obtained using one simulation run per pair of (LT, ST) values, with Fx = 10. (b) Comparison of theory and simulations for LT = 2.0 × 10⁵ (vertical line in a). SlT and SuT in panel a are the SOS1 concentrations at the gel points. The simulations are for Fx = 100 (dotted line), and Fx = 10 (dashed line). (c) Comparison of theory and simulations for ST = 3.75 × 10⁵ (horizontal line in a). LlT and LuT are the LAT concentrations at the gel points. As in panel b, simulations are for Fx = 100 (dotted line), and Fx = 10 (dashed line). The solid circle corresponds to the concentrations used in panel b and in Fig. 5b. (d) LAT aggregate size distribution from simulation (dashed line) and theory (solid lines) for LT = 3.5 × 10⁵ and ST = 3.75 × 10⁵ corresponding to the open circle in panel c. Simulations are for Fx = 10.
We can also calculate the fraction of LAT molecules in the gel-like phase (fg). To determine this quantity, we assume as in Goldstein and Perelson (19) that the theoretical framework for describing the LAT aggregates in the absence of the gel-phase is still valid for the LAT aggregates comprising the sol phase in the presence of the gel phase. With this assumption, Eqs. 41 and 42 remain valid throughout the gel phase whereas Eq. 43 holds only at the boundary. We find in Appendix D that the fraction of the total number of LAT molecules in the gel phase is given by
| (44) |
Once we have the SlT and SuT values for a given pair, we can solve Eqs. 41 and 42 for g and s, using values of ST between SlT and SuT, and keeping GT and LT fixed at the values for which SlT and SuT have been evaluated. These solutions in g and s not only yield the gel-phase fraction fg from Eq. 44, but as shown in Appendix D, ws, the fraction of LAT in the sol phase that is not in aggregates:
| (45) |
Using the above expression of ws, we can calculate the aggregate size distribution of the sol phase following the procedure outlined in Appendix D.
Stochastic Simulations
To simulate LAT-Grb2-SOS1 interactions numerically, we use a recently developed rule-based, kinetic Monte Carlo approach (22). A detailed description of the application of the method to the LAT-Grb2-SOS1 model is provided in the Supporting Material. Here, we present an overview. The main advantage of the rule-based kinetic Monte Carlo approach over standard methods for simulation of stochastic dynamics of biochemical systems (33,34), is that it avoids the combinatorial explosion of the number of possible species and reactions that arises from the interactions of multivalent molecules (35,36). In particular, dynamical simulation of LAT aggregation in the gel phase regime would be impossible using conventional chemical kinetics methods because the number of equations that would need to be integrated is effectively infinite. This combinatorial complexity can be overcome, however, by assuming that the number of distinct reaction types is much smaller than the number of possible interacting species (an assumption that matches our current technological limitations in measuring biochemical reaction rates), and by simulating the system as a set of discrete objects rather than using continuum equations (as in the conventional formulation using ordinary differential equations). Rules are introduced that describe how reactivity depends on the identity of interacting sites, the local context of interacting molecules (e.g., the binding or modification states of neighboring sites), and whether the reactants are in solution or tethered to a membrane. For each rule, corresponding lists of the possible reactive sites in the system are maintained. For rules describing unimolecular transformations, e.g., dissociation of a bond or phosphorylation, a single reactant list is maintained, whereas for rules describing bimolecular association, two lists are maintained. Cumulative reaction rates for each rule are calculated as a function of the rate constant for the rule and the size of the reactant list or lists. The system is then simulated using an extended version of the Gillespie direct method (33,34), which includes additional steps for selecting the specific molecules and sites undergoing reaction and for rejecting reactions if the reactants fail to meet additional criteria (22). At each step in the simulation, the size of the next time step and the next reaction to occur are selected using Gillespie's direct method. Reactant sites are then chosen at random among the sites available to react. If the chosen reactants satisfy any additional reaction criteria (e.g., that the reactant sites may not belong to the same complex), the transformation specified by the rule is applied to the reactants and the reactive sites lists are updated. In addition to lists involving sites directly affected by the rule, lists associated with adjacent sites may also require updates. The largest number of lists that must be updated for the current model is three (see Supporting Material). The simulation then continues until the end time is reached or some other stopping criterion is satisfied. Previous work has shown that the method is accurate and efficient for simulating the dynamical and steady-state properties of the sol-gel phase transition for a system of trivalent ligands and bivalent receptors (22).
The simulations are used to track the aggregate size distribution in time. The final output is obtained by averaging the data over multiple runs. The system size is set to the total number of molecules, and it can also be rescaled by multiplying bimolecular rate constants by a volume factor, Fx, and dividing LT, GT, and ST by Fx.
Results
In this section we present results obtained from the equilibrium model and stochastic simulations. Agreement between the two gives us confidence in the theory and the simulation method.
Comparison of bi- and trivalent LAT
In Fig. 4 a, we compare the predicted average size of an aggregate of LAT molecules as a function of either bivalent or trivalent LAT concentration, when the concentrations of Grb2 and SOS1 are those estimated for a Jurkat E6.1 cell (Table 3). The upper and lower solid lines are the predicted values from the equilibrium theory for trivalent and bivalent LAT. The dashed line is for a trivalent LAT concentration that is two-thirds that of the upper curve and therefore has the same number of Grb2 binding sites as the dimer curve. The open circles and triangles are predicted from simulation and are in excellent agreement with the theory. We see that for trivalent LAT, the average aggregate size goes through a maximum and then decreases with increasing LAT concentration. For high enough values of LAT, this follows, because as LT → ∞, all LAT aggregates become dimers. As expected, trivalent LAT forms larger aggregates than divalent LAT at the same LAT concentrations. However, for the Grb2 and SOS1 concentrations used in Fig. 4 a, there is no dramatic difference in aggregate size. The ratio of Grb2 to SOS1 is 10:1, which is far from the optimal value for maximizing LAT aggregation. If the ratio of Grb2 to SOS1 is >>2, there will be a large pool of Grb2 not bound to SOS1 that can bind to LAT and block aggregation. In Fig. 4 b we plot the quantity x (Eq. 65), which is a measure of how close the system is to the gel point. In Appendix C we show that x ≥ 1 with x = 1 at the gel point. We assume that throughout the region where the sol and gel coexist, x = 1. (We shall see that simulations agree with the predictions of the theory in the sol-gel region and therefore support this assumption.) As we see in Fig. 4 b, x is minimal but not equal to one when trivalent LAT aggregation is maximal. As the LAT concentration is increased further, the average LAT aggregate size decreases and x diverges from one. We consider a second case in Fig. 4 c, taking the ratio of Grb2 to SOS1 to be 2:1 with the Grb2 concentration reduced approximately to one-half of that used in Fig. 4 a. Here we see a significant difference between the average aggregate size formed by bivalent and trivalent LAT, with the average aggregate size growing much more rapidly for trivalent than bivalent LAT as the LAT concentration is increased. This is because, for the concentrations of Grb2 and SOS1 we have chosen in Fig. 4 c, the gel point is reached when LT = 5.758 × 10⁴ trivalent LAT/cell. As we noted earlier, superaggregate formation does not occur for bivalent LAT. Thus, for appropriate concentrations, switching the valence of LAT from two to three can dramatically increase the size of the aggregates of LAT that form.
Figure 4.
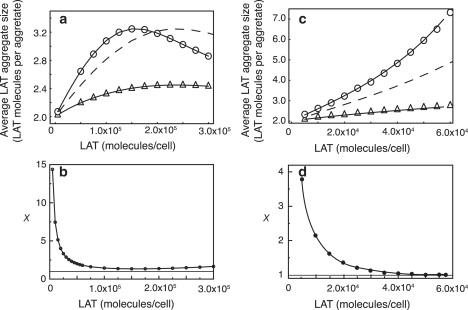
(a) Predicted average aggregate size for bi- and trivalent LAT when the number of Grb2 and SOS1 molecules per cell are those estimated for Jurkat E6.1 cells, GT = 1.3 × 10⁶ molecules/cell and ST = 1.3 × 10⁵ molecules/cell. (a and c) Open circles (trivalent LAT) and open triangles (bivalent LAT) are simulation results. The solid curves in panels a and c were obtained by solving Eqs. 13–15 simultaneously and then calculating the average aggregate size from Eq. 31. The dashed lines are for a trivalent LAT concentration that is two-thirds that of the upper curve and therefore has the same number of Grb2 binding sites as the dimer curve. (b) The quantity x = (1 − 2δw)/(2δw) for the same set of concentrations of Grb2 and SOS1 used in panel a. The quantity x is a measure of how close the system is to the sol-gel coexistence region. At the gel point, x = 1. (c) Predicted average aggregate size for bi- and trivalent LAT when number of Grb2 and SOS1 molecules per cell were 7.5 × 10⁵ and 3.75 × 10⁵, respectively. (d) For the concentrations used in panel c, the quantity x asymptotically approaches one with increasing LAT concentration.
Properties of the sol-gel coexistence region
We next look in more detail at the formation of gel-like superaggregates in a homogeneous population of trivalent LAT. Given the total concentrations of Grb2 and SOS1, we can solve Eqs. 41–43 for g∗, s∗, and LT. There will either be two solutions or none. If there are none, then for the values of the Grb2 and SOS1 concentrations chosen there is no LAT concentration for which sol and gel coexist. If there are two solutions, the two values of LT correspond to the lowest and highest concentrations of LAT at which superaggregation can occur. For GT = 7.5 × 10⁵ and ST = 3.75 × 10⁵, the first gel point occurs when LT ≈ 5.758 × 10⁴. As LT is increased beyond this value, a gel-like superaggregate coexists with the sol phase comprising smaller LAT aggregates, as indicated by simulation results in Fig. 5, a and b. In the sol phase, we expect good agreement between theory and simulation for the predicted fractional LAT aggregate size distribution, unless the reduction in system size is so large as to prevent formation of aggregate sizes that have a significant probability of forming in the unreduced system. In Fig. 5 a, the agreement between theory and simulation is excellent. In Fig. 5 b, gel formation is indicated by the appearance of a peak in the LAT aggregate size distribution at a large aggregate size. This contrasts with the decaying tail of the distribution in Fig. 5 a, where the LAT concentration is too low for superaggregate formation. Again, for the sol phase, we get excellent agreement between theory and simulation (see Appendix D for how the LAT size distribution in the sol phase is calculated when sol and gel coexist). In the simulations we define the number of LAT molecules in the gel phase as the number of LAT in the largest aggregate averaged over time, following an initial equilibration period. The reduction in the system size in the simulations reduces the size of the superaggregate compared to the full system, but the predicted fraction of LAT in the gel phase converges rapidly. For the parameters used in Fig. 5 b, theory predicts fg = 0.74, and simulations give a value of 0.71 for a value of Fx = 100. The second gel point occurs at LT ≈ 3.926 × 10⁵ LAT per cell. As the simulations show in Fig. 5 c, at a concentration of LAT higher than this, when LT = 4.25 × 10⁵, there is no longer a gel phase.
Figure 5.
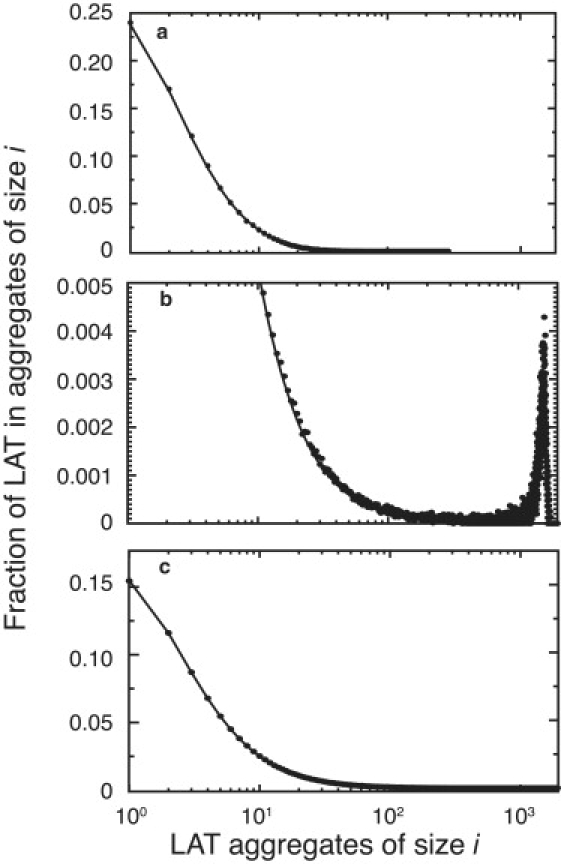
Aggregate size distribution for trivalent LAT from theory (solid lines) and simulation (solid circles), (a) below the gel point, (b) in the sol-gel phase, and (c) above the gel point. (a–c) GT = 7.5 × 10⁵ and ST = 3.75 × 10⁵. (a) LT = 3.0 × 10⁴. (b) LT = 2.0 × 10⁵. (c) LT = 4.25 × 10⁵. The appearance of a peak in the distribution at large aggregate sizes in panel b corresponds to gel formation in the simulation system of finite size. Each of the plots was generated by averaging over 30 simulations taking Fx = 100.
Fig. 6 a shows the boundaries separating the sol region from sol-gel coexistence regions, calculated from the equilibrium theory, for four values of GT. As the Grb2 concentration decreases, the area of the sol-gel region decreases until, below a critical value of Grb2 (GT ≈ 2.6 × 10⁵ Grb2/cell), the two-phase region disappears. The three circles in Fig. 6 b correspond to the three cases considered in Fig. 5, a–c, and are consistent with Fig. 5 b having both a sol and gel phase. In Fig. 6 c, the horizontal line corresponds to the estimated SOS1 concentration in Jurkat E6.1 cells. Because the line does not intersect a boundary, the model predicts for the set of parameters we have chosen that a cell with the average concentrations of a Jurkat E6.1 cell (Table 3) cannot form superaggregates, no matter how much LAT is phosphorylated, given the current values of equilibrium constants. However, the magnitude of the surface equilibrium cross-linking constant can strongly influence the size of the sol-gel coexistence region and we have no experimental estimate of this parameter. In Fig. S3, we show that for a value of that is 10 times higher than in Table 2, a small coexistence region exists for trivalent LAT in the range LT ≈ 5 × 10⁴ − 1.5 × 10⁵ for the experimental value of SOS1 concentration in Jurkat E6.1 cells. Further, there are other proteins, such as c-Cbl (37) and HPK1 (38), that can bind to Grb2 and cross-link LAT. These would effectively contribute to the SOS1 concentration in our model.
Figure 6.
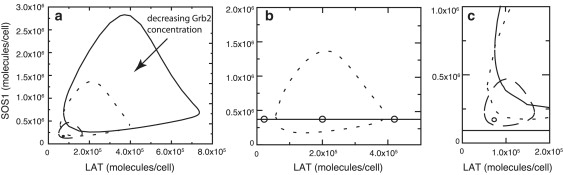
(a) Sol and gel coexistence regions for four values of the total Grb2 concentration: GT = 1.3 × 10⁶, 7.5 × 10⁵, 3.75 × 10⁵, and 2.625 × 10⁵ molecules/cell. The total area of the sol-gel coexistence region is a decreasing function of GT. (b) Boundary of the sol-gel coexistence region for GT = 7.5 × 10⁵. The horizontal line corresponds to ST = 3.75 × 10⁵. The open circles correspond to the concentrations used in Fig. 5, a–c, respectively. (c) The lower-left corner of panel a is replotted. The horizontal line corresponds to the SOS1 concentration, ST = 1.3 × 10⁵ molecules per cell, the estimated average value for Jurkat E6.1 cells.
In Fig. 7 a, we explore the properties of the sol-gel coexistence region by plotting contour lines for fg, the fraction of LAT in the gel phase. The symbols indicate results from simulation, whereas the contour lines are derived from the equilibrium theory. In Fig. 7 b, we plot fg versus the number of SOS1 per cell for a trivalent LAT concentration LT = 2.0 × 10⁵, which corresponds to the vertical line in Fig. 7 a. The solid line is the prediction from the equilibrium theory, while the dotted line and the dashed line are simulation results for Fx = 100 and Fx = 10. (Recall that Fx is the factor by which the volume is reduced in the simulation.) For finite systems there is no true transition from sol to sol plus gel, and this is reflected in the way the simulated curves approach the x axis. As the system size is increased (Fx is decreased), a sharpening is seen and the deviation between simulation and theory is reduced.
In Fig. 7 c, we plot fg versus the number of LAT per cell for a SOS1 concentration ST = 2.0 × 10⁵, which corresponds to the horizontal line in Fig. 7 a. There is clearly a discrepancy between the theory and simulation at the higher LAT concentrations with the theory overestimating the amount of LAT in the gel phase. Fig. 7 d shows the LAT aggregate size distribution for LT = 3.5 × 10⁵ (open circle in Fig. 7 a), where there is the largest deviation between predictions from theory and simulation (Fig. 7 b). As can be seen, the theory underestimates the concentration of LAT in the sol phase (solid line) and overestimates the amount of LAT in the gel phase. It is puzzling why the discrepancy between theory and simulation occurs only at the large LAT concentrations.
Kinetics of LAT aggregation in the absence and presence of inhibitor
To inhibit LAT oligomerization, Houtmann et al. (15) transiently expressed a C-terminal fragment of SOS1 in Jurkat E6.1 cells that we refer to as CSOS1. This fragment could form a 1:1 complex with Grb2, which could bind to phosphorylated Grb2 binding sites on LAT but could not aggregate LAT (15). The cells were stimulated at two concentrations of anti-CD3 antibodies, 0.02 μg/mL and 1.0 μg/mL, and Ca2+ influx measured. At the low stimulating concentration, the Ca2+ influx was reduced and its time course was slowed. At the high stimulating concentration, there was a very modest reduction in the level of the Ca2+ influx with no change in the time course. This was presumably because at high concentrations of phosphorylated LAT, the monovalent inhibitor Grb2-CSOS1 could only block a small fraction of the Grb2 binding sites on LAT. These experiments lead us to introduce CSOS1 into our model to assess its influence on LAT aggregation. In Fig. 8, we compare LAT aggregation in the presence (dashed line) and absence (solid line) of CSOS1 for two values of trivalent LAT corresponding to low and high activation. For the low value, a gel cannot form, whereas for the high value, it can. In the simulations, the systems were allowed to equilibrate before activated LAT was introduced.
Figure 8.
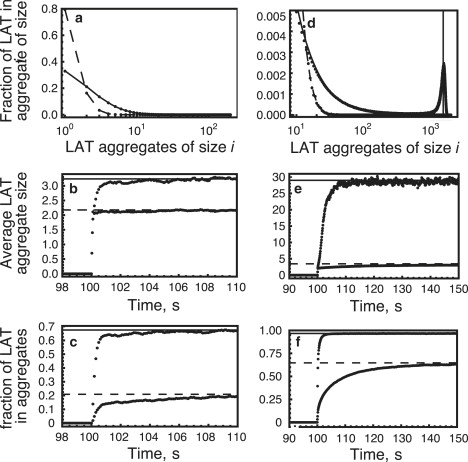
LAT aggregation in the absence (solid line) and presence (dashed line) of a SOS1 fragment that binds only one Grb2 (CSOS1). The concentration of CSOS1 is 1.5 × 10⁶, GT = 7.5 × 10⁵, and ST = 3.75 × 10⁵ molecules/cell. In all panels, the solid and dashed lines are predictions from the theory and the solid circles are simulation results. (a–c) LT = 2 × 10⁴ molecules/cell and (d–f) LT = 2 × 10⁵ molecules/cell. The simulations are the averages of 40 runs with Fx = 100. (b, c, e, and f) Trivalent LAT is introduced at t = 100 s. The solid and dashed lines are the predicted equilibrium values from the theory.
At the low LAT concentration the inhibitor is highly effective, reducing the total amount of LAT in aggregates by >70% (Fig. 8 c) and blocking the formation of essentially all aggregates of LAT >2 (Fig. 8, a and b). At the high LAT concentration, the inhibitor blocks the formation of the gel phase as seen by the absence of the sharp peak in the LAT aggregate size distribution (Fig. 8 d) and the dramatic reduction of LAT aggregate size (Fig. 8 e). However, there is significant formation of small aggregates with a net reduction of LAT aggregation of ∼40%.
The kinetics of fully phosphorylated LAT aggregate formation is fast (Fig. 8, b, c, e, and f), primarily because Grb2-SOS1-Grb2 dimers are present in large concentrations in the cytosol before the addition of activated LAT. The inhibitor slows aggregation because it reduces the concentration of these dimers. It should be kept in mind that, in the simulations, LAT phosphorylation is instantaneous, but in an experiment, a number of steps must occur before LAT becomes phosphorylated. Nevertheless, in Jurkat E6.1 cells, phosphorylation of LAT tyrosine 191 was detected within 10 s after stimulation (26).
Discussion
The scaffolding protein LAT plays a central role in both mast cell and T cell signaling. When its three terminal tyrosines are phosphorylated, they become binding sites for the adaptor protein Grb2, which, through its SH2 domain, binds to phosphorylated LAT, and through its two SH3 domains, binds to the proline-rich regions of SOS1 (15). Two Grb2 molecules can bind to SOS1 to form a Grb2-SOS1-Grb2 dimer, which is capable of bridging two tyrosine-phosphorylated LAT molecules. External stimuli, by controlling the level of activation of Syk family kinases, modulate the valence of LAT for Grb2 from zero to three. The formation of large clusters of LAT has been observed in T cells after T cell stimulation with anti-CD3 antibodies (16,15), and in mast cells after the aggregation of IgE-FcɛRI complexes (17,18).
We have presented a simplified model for Grb2-SOS1-Grb2 mediated LAT oligomerization in homogeneous populations of either bi- or trivalent LAT and developed an equilibrium theory for the model. The theory allows us to determine the steady-state distribution of finite size aggregates of LAT as well as the number of LAT in aggregates and the average size of a LAT aggregate. To check the results of the equilibrium theory, to account for finite size effects and to extend our results to the kinetics of LAT aggregation, we used a recently developed kinetic Monte Carlo method to simulate the model (22). The simulations are in good agreement with predictions of the equilibrium theory (see Figs. 4, 5, and 7), giving us confidence that the theory has been correctly formulated for the model and that the simulation method correctly simulates the model. We find that the valence of LAT for binding Grb2, i.e., the number of LAT phosphotyrosines that can bind the Grb2 SH2 domain, is a critical factor in determining both the nature and extent of aggregation (Fig. 4). If an external stimulus produces substantial amounts of LAT that are trivalent for binding Grb2 (a phenomenon we call “valence switching”), a dramatic rise in LAT oligomerization can occur, provided the concentrations of LAT, Grb2, and SOS1 are properly matched.
For a range of concentrations of Grb2, SOS1, and trivalent but not bivalent LAT, the equilibrium theory predicts the formation of Grb2-SOS1-Grb2 mediated superaggregates of LAT and simulations agree with these predictions. The range of concentrations over which this occurs corresponds to a sol-gel coexistence region where the sol phase consists of LAT monomers and small aggregates and the gel phase consists of superaggregates of LAT (see Fig. 5). Such a two-phase region appears to have been observed in stimulated RBL-2H3 cells where Wilson et al. determined the distribution of LAT clusters after cross-linking of FcɛRI-bound IgE by the addition of a multivalent antigen (see Fig. 8 in (17)). As early as 1 min after stimulation, a distribution of LAT aggregate sizes was observed with one aggregate much larger than the rest. At 2 min after stimulation, the outlying aggregate contained >160 LAT molecules. Because the efficiency of labeling of LAT in the experiment was not determined, 160 is a lower bound on the number of LAT in the aggregate.
We mapped the predicted boundary of the region where sol and gel coexist for a set of Grb2 concentrations (see Fig. 6). Only for concentrations of SOS1 and trivalent LAT within the sol-gel coexistence region, is superaggregate formation predicted to occur. For a Grb2 concentration <∼2.6 × 10⁵ Grb2/cell (∼1.2 × 10⁻⁶ M for a Jurkat cell), the model predicts that no superaggregate formation can occur. In the model the only adaptor that can bind to SOS1 and form a dimer is Grb2, but at least one other adaptor, Grap (Grb-2-like accessory protein), may do so as well. Grap, which like Grb2 has a central SH2 domain flanked by two SH3 domains, binds phosphorylated LAT through its SH2 domain and SOS1 through at least one of its SH3 domains (39,40). The adaptor Gads binds phosphorylated LAT at one and possibly two sites that are also binding sites for Grb2 (8,24). However, it does not appear to bind to SOS1, and thus it may act as a monovalent inhibitor of gel formation, reducing the range of concentrations over which superaggregate formation can occur.
The fraction of LAT that is in superaggregates, fg, depends on the Grb2, SOS1, and LAT concentrations (see Fig. 7). The theory and simulations predict that superaggregate formation can occur when the trivalent LAT concentration is in the range LT ≈ 5 × 10⁴ − 8 × 10⁵ LAT/cell, providing the Grb2 and SOS1 concentrations are also in the appropriate ranges (Fig. 6). This means that even for an fg = 0.10, we predict 103–104 LAT in superaggregates. This is an overestimate, because the model considers only oligomerization and includes no mechanisms that limit the size of aggregates. Recently it has been shown for T cells that the ubiquitin ligase c-Cbl, that can bind to LAT by first binding through its proline-rich region to Grb2, can mediate the internalization of LAT (41). In mutant cells lacking c-Cbl or transfectants with a mutant c-Cbl lacking its proline-rich domain, LAT clustering persists for longer times than for the wild-type (41).
Maintaining LAT aggregation in mast cells requires the constant presence of activated Syk to phosphorylate binding sites on LAT that become exposed through the dissociation of Grb2. Dephosphorylation is blocked when an SH2 domain is bound to a phosphorylated site (42), but upon dissociation the site is subject to rapid dephosphorylation by membrane, and to a lesser extent, by cytosolic phosphatases (43). In RBL cells the intrinsic rate of dephosphorylation of an exposed phosphotyrosine has been estimated to be 20 s−1, corresponding to a mean lifetime of 0.05 s (44). When a multivalent antigen is used to aggregate IgE on RBL cells, rapid phosphorylation of FcɛRI, Syk, and LAT, as well as other proteins, occurs. Upon addition of a high concentration of a monovalent hapten that blocks receptor aggregation, receptor disaggregation follows, accompanied by the dephosphorylation of the receptor, Syk, and LAT, all with comparable half-lives of 10–15 s (43,45). Although the extent of LAT aggregation was not assayed in the experiments of Peirce and Metzger (45), the rapid dephosphorylation of LAT indicates that LAT aggregation is a highly reversible process. For the parameters we have used (Table 2), this is true for the model as well. If in the model we allow a superaggregate to form and then, once steady state is established, introduce a dephosphorylation step with rate constant kd = 20 s−1, the superaggregate breaks up in seconds (data not shown). In formulating the model, we assumed that reactions that lead to the formation of closed structures (loops) could be ignored. We expect that including these reactions would at best marginally increase the stability of aggregates because dephosphorylation is so fast.
Although it is clear that large aggregates of LAT form in activated T cells and mast cells, what the role of these large aggregates is, in cell signaling, remains a subject of debate. One possibility is that large clusters of LAT enhance the efficiency of LAT ubiquitylation mediated by c-Cbl and the subsequent downregulation of LAT. If c-Cbl were in low concentration compared to SOS1, c-Cbl would tend to be found in large aggregates of LAT, where it would be in proximity to multiple LAT molecules and the proteins associated with LAT.
We have confined our discussion to the aggregation of LAT by Grb2-SOS1-Grb2 dimers, but there are other transmembrane proteins that, when fully phosphorylated, have valences ≥3 for Grb2 and where we might expect to see similar large aggregate formation corresponding to a sol-gel coexistence region. These include members of the epidermal growth factor (EGF) family of receptors (46,47), the non-T cell activation linker (NTAL) (48), and LAX (49). Aggregation is ubiquitous in cell signaling, manifesting itself at many levels. Carefully constructed models of aggregation can contribute to our understanding of its multiple roles in cell signaling.
Acknowledgments
We thank J. Houtman and L. Samelson for most helpful interactions and for determining the concentrations of Grb2 and SOS1 in Jurkat E6.1 cells.
This work was supported by the Department of Energy through contract No. W-7405-ENG-36, and National Institutes of Health grant No. R37-GM035556. The authors have no financial conflict of interest.
Appendix A
In this Appendix, we calculate the partition function Q0 for the linear chains of trivalent LAT molecules, cross-linked by the Grb2-SOS1-Grb2 species. The equilibrium concentration of a linear chain with two LAT molecules, where the two non-cross-linking sites on either LAT are free, is . To include the contribution from linear chains in which any of the four non-cross-linking sites on the two LAT molecules can be bound, we have to multiply by E4, where E is defined in the bivalent LAT model (Eq. 4) as
| (46) |
The term E can be alternatively written as (1 + β), where
| (47) |
Thus, the contribution to the partition function of all chains with two LAT molecules is . The equilibrium concentration of a linear chain with three LAT molecules, where the five non-cross-linking sites on the three LAT molecules are free, is . To include the contribution from linear chains in which any of the five non-cross-linking sites on the three LAT molecules can be bound, we have to multiply by (1 + β)5, so that the contribution to the partition function of all chains with three LAT molecules is . Similarly, it can be shown that the contribution to the partition function of all linear chains with four LAT molecules is , and so on. Hence, it results that
| (48) |
Appendix B
In this Appendix, we obtain a general expression for wn,m that denotes the nondimensional concentration of aggregates of n trivalent LAT molecules with m branch points. From the literature (19,50), we obtain
| (49) |
In Wiegel and Perelson (50), the term qn,m is given by
| (50) |
where Q(z, ξ) is given by
| (51) |
The ξ-integral can be performed by noting that the quantity
in Eq. 50 equals the coefficient of ξm in Q(z, ξ). Using Eq. 51 and the binomial expansion
| (52) |
one finds
| (53) |
Substitution of this into Eq. 50 yields
| (54) |
We replace w by z in the definitions of q0 and γ in Eqs. 20 and 22, respectively, and substitute the resulting q0(z) and γ(z) in the above equation to yield
| (55) |
The z integral inside the square brackets in the above equation is the coefficient of z(n−2m−2) in (1 − 2δz)−(2m+1), which is given by (51)
| (56) |
Using the z integral from the above equation in Eq. 55, we get
| (57) |
or
| (58) |
Substituting the value of qn, m from the above equation in Eq. 49, we get
| (59) |
For this equation to hold, n ≥ 2. It is also evident from this equation that the largest physically acceptable value of m for a given value of n should obey the relation
| (60) |
The above equation can be rewritten as
| (61) |
It can be easily shown that for a given value of n, the largest possible value of m is given by
| (62) |
where denotes the integer division (52) of n − 2 by 2. Hence for n ≥ 2, the fraction of LAT molecules in aggregates of size n, wn can be expressed as
| (63) |
Appendix C
In this Appendix, we derive Eqs. 41–43. These equations characterize the gel point.
Using the definitions of γ (Eq. 22) and q0 (Eq. 20), the partition function q in Eq. 24 can be written as
| (64) |
We define
| (65) |
It has been shown in Fig. 4 d that x asymptotically approaches unity at the gel point, and the farther the system is from the gel point, the larger the value of x. The partition function q can be expressed in terms of x and w as
| (66) |
or
| (67) |
Then,
| (68) |
The conservation equation for LAT can be written as
| (69) |
Substituting from Eq. 68 in the above equation, we obtain
| (70) |
At the gel point , but because the large aggregates are prevalent, diverges. Hence, the values of w and δ for which M1 = 1 and M2 → ∞, are the gel-point values.
Let us express M2 in terms of w and δ. Equation 68 can be rewritten as
| (71) |
Using Eq. 67, the above equation can be written as
| (72) |
Therefore,
| (73) |
From Eq. 65, one can obtain
| (74) |
From Eqs. 73 and 74, we get
| (75) |
Using the conservation law (Eq. 69), we obtain
| (76) |
From the above equation, we find by observation that for x2 = 1, M2 → ∞. Thus, at the gel point,
| (77) |
The above equation in x has two roots of which only the positive root x = 1 is physically acceptable. We adopt the general notation that any expression with an asterisk as a superscript denotes the value of that expression at the gel point. Thus, at the gel point,
| (78) |
From Eq. 65,
| (79) |
From Eq. 79, we get
| (80) |
At the gel point, M1 is still 1. Substituting x = 1 in Eq. 70, we obtain
| (81) |
or
| (82) |
Substituting the value of w∗ from Eq. 82 into Eq. 80, we obtain
| (83) |
The conservation equations for g and s still hold at the gel point. Therefore, from Eqs. 14 and 15, respectively, we get
| (84) |
and
| (85) |
From Eq. 67, we obtain
| (86) |
Similarly,
| (87) |
At the gel point, x = 1. Therefore, at the gel point, Eqs. 86 and 87, respectively, yield
| (88) |
and
| (89) |
Using the definitions of w (Eq. 19) and δ (Eq. 10), we can write from Eq. 65 that
| (90) |
Taking the partial derivative of both sides of the above equation with respect to g and multiplying both sides by g, we get
| (91) |
From Eq. 80,
| (92) |
Substituting the value of α∗l∗c∗(1 + β∗) from Eq. 92 into Eq. 91, we obtain for the gel point
| (93) |
From the definition of w, we obtain
| (94) |
Therefore at the gel point,
| (95) |
We multiply both sides of Eq. 88 by g∗, and substitute the expressions of and from Eqs. 95 and 93, respectively, to yield
| (96) |
Now from Eqs. 82 and 83,
| (97) |
so that from Eq. 96, we obtain
| (98) |
Along very similar lines, it can be shown that
| (99) |
Substituting the values of and from Eqs. 98 and 99, respectively, into Eqs. 84, we obtain Eqs. 41 and 42. Using Eq. 10, Eq. 83 can be rewritten as Eq. 43.
Appendix D
In this Appendix, we derive the equations for the fraction of the total number of trivalent LAT molecules in the gel phase.
Let the total number of LAT molecules present in the sol phase, i.e., as small aggregates, be denoted by LS, and the fraction of the total number of LAT molecules present in the sol phase by fs. Then, fs = LS/LT, and the fraction of total number of LAT molecules in the gel phase, fg, is given by 1 − fs. We define
| (100) |
From the definition of δ (Eq. 10) it follows that
| (101) |
As mentioned in Formation of a Gel-Like Phase for Trivalent LAT, we assume that the theoretical framework for describing the LAT aggregates in the absence of the gel-phase is still valid for the LAT aggregates comprising the sol phase in coexistence with the gel phase. Under this assumption, the conservation equation for LAT in sol phase is obtained by replacing w, δ, and x in Eq. 70 by ws, δs, and xs, respectively,
| (102) |
where the fraction of LAT molecules in sol that are not in aggregates is designated by ws, and
| (103) |
To calculate ws, we need to know Ls or, equivalently, fs. This is equivalent to finding an additional equation that describes the coexistence of sol and gel. The equation that we choose is
| (104) |
I.e., we assume that xs = 1 holds throughout the sol-gel region, not simply at the boundary of the sol-gel region. Because, xs = 1 and the conservation law (Eq. 102) are both assumed to hold in the two-phase sol-gel region, δs satisfies Eq. 83. Substituting δs for δ∗ in Eq. 83 and solving for fs, we find
| (105) |
Then the fraction of the total number of LAT molecules in the gel phase is given by
| (106) |
so that we obtain Eq. 44. The assumption xs = 1 is also tantamount to Eqs. 41 and 42 being valid not only at the gel points but also for the sol phase coexisting with the gel. Hence, once we have the SlT and SuT values for a given pair, we can solve Eqs. 41 for g and s, using values of ST between SlT and SuT, and keeping GT and LT fixed at the values for which SlT and SuT have been evaluated. These solutions in g and s can not only yield the gel-phase fraction fg from Eq. 44, but also the fraction of the total number of LAT molecules in the sol phase that present in species containing one LAT molecule. This fraction ws can be obtained from
| (107) |
The above equation is obtained by replacing w∗ and δ∗ by ws and δs, respectively, in Eq. 82, and then substituting δs by (ασχμθg2sfs/(1 + β)2) using Eqs. 10 and 101. The fraction of the total number of LAT molecules present as species containing only one LAT molecule is given by
| (108) |
using Eq. 107. We estimate wn values for n ≥ 2 as
| (109) |
where mmax is given by Eq. 62 in Appendix B, and wsn,m is obtained by substituting w and δ in Eq. 59 of Appendix B by ws and δs, respectively. As shown by Fig. 5 b, the estimates show excellent agreement with simulation results for the sol phase. The determination of wn for the sol phase, in presence of the gel phase, enables us to define the average aggregate size in presence of the gel phase. The average aggregate size is defined as in Eq. 31. In presence of the gel phase, the above expression can be approximated as , where N is the largest value of n for which nwnLT ≥ 1. The value of N turns out to be 1257 for the case in Fig. 8 e. In addition to contributions from the sol phase, we consider the contribution fg, to , from a single aggregate, the gel phase, of size (fgLT), and the contribution, 1/LT, to to obtain the final expression for the average aggregate size in presence of the gel phase. It should be noted that the average aggregate size does not change, for all practical purposes, on increasing the upper limit of the summations beyond N.
Supporting Material
References
- 1.Schlessinger J. Cell signaling by receptor tyrosine kinases. Cell. 2000;103:211–225. doi: 10.1016/s0092-8674(00)00114-8. [DOI] [PubMed] [Google Scholar]
- 2.Ozaki K., Leonard W.J. Cytokine and cytokine receptor pleiotropy and redundancy. J. Biol. Chem. 2002;277:29355–29358. doi: 10.1074/jbc.R200003200. [DOI] [PubMed] [Google Scholar]
- 3.Metzger H. Transmembrane signaling: the joy of aggregation. J. Immunol. 1992;149:1477–1487. [PubMed] [Google Scholar]
- 4.Samelson L.E. Signal transduction mediated by the T cell antigen receptor: the role of adapter proteins. Annu. Rev. Immunol. 2002;20:371–394. doi: 10.1146/annurev.immunol.20.092601.111357. [DOI] [PubMed] [Google Scholar]
- 5.Zhang W.G., Trible R.P., Samelson L.E. LAT palmitoylation: its essential role in membrane microdomain targeting and tyrosine phosphorylation during T cell activation. Immunity. 1998;187:239–246. doi: 10.1016/s1074-7613(00)80606-8. [DOI] [PubMed] [Google Scholar]
- 6.Weber J.R., Orstavik S., Torgersen K.M., Danbolt N.C., Berg S.F. Molecular cloning of the DNA encoding pp36, a tyrosine-phosphorylated adaptor protein selectively expressed by T cells and natural killer cells. J. Exp. Med. 1998;187:1157–1161. doi: 10.1084/jem.187.7.1157. [DOI] [PMC free article] [PubMed] [Google Scholar]
- 7.Zhang W., Sloan-Lancaster J., Kitchen J., Trible R.P., Samelson L.E. LAT, the ZAP-70 tyrosine kinase substrate that links T cell receptor to cellular activation. Cell. 1998;92:83–92. doi: 10.1016/s0092-8674(00)80901-0. [DOI] [PubMed] [Google Scholar]
- 8.Zhang W.G., Trible R.P., Zhu M., Liu S.K., McGlade C.J. Association of Grb2, Gads, and phospholipase C-γ1 with phosphorylated LAT tyrosine residues. Effect of LAT tyrosine mutations on T cell antigen receptor-mediated signaling. J. Biol. Chem. 2000;275:23355–23361. doi: 10.1074/jbc.M000404200. [DOI] [PubMed] [Google Scholar]
- 9.Saitoh S., Arudchandran R., Manetz T.S., Zhang W., Sommers C.L. LAT is essential for FcɛRI mediated mast cell activation. Immunity. 2000;12:525–535. doi: 10.1016/s1074-7613(00)80204-6. [DOI] [PubMed] [Google Scholar]
- 10.Songyang Y., Shoelson S.E., McGlade J., Olivier P., Pawson T. Specific motifs recognized by the SH2 domains of Csk, 3BP2, Fps/Fes, GRB-2, HCP, Syk, and Vav. Mol. Cell. Biol. 1994;14:2777–2785. doi: 10.1128/mcb.14.4.2777. [DOI] [PMC free article] [PubMed] [Google Scholar]
- 11.Nimnual A.S., Yatsula B.A., Bar-Sagi D. Coupling of Ras and Rac guanosine triphosphatases through the Ras exchanger SOS. Science. 1998;279:560–563. doi: 10.1126/science.279.5350.560. [DOI] [PubMed] [Google Scholar]
- 12.Vetter I.R., Wittinghofer A. Signal transduction—the guanine nucleotide-binding switch in three dimensions. Science. 2001;294:1299–1304. doi: 10.1126/science.1062023. [DOI] [PubMed] [Google Scholar]
- 13.Lowenstein E.J., Daly R.J., Batzer A.G., Li W., Margolis B. The SH2 and SH3 domain-containing protein GRB2 links receptor tyrosine kinases to Ras signaling. Cell. 1992;70:431–442. doi: 10.1016/0092-8674(92)90167-b. [DOI] [PubMed] [Google Scholar]
- 14.Yuzawa S., Yokochi M., Hatanaka H., Ogura K., Kataoka M. Solution structure of GRB2 reveals extensive flexibility necessary for target recognition. J. Mol. Biol. 1992;306:527–537. doi: 10.1006/jmbi.2000.4396. [DOI] [PubMed] [Google Scholar]
- 15.Houtman J.C., Yamaguchi H., Barda-Saad M., Braiman A., Bowden B. Oligomerization of signaling complexes by the multipoint binding of GRB2 to both LAT and SOS1. Nat. Struct. Mol. Biol. 2006;13:798–805. doi: 10.1038/nsmb1133. [DOI] [PubMed] [Google Scholar]
- 16.Bunnell S.C., Hong D.I., Kardon J.R., Yamazaki T., McGlade C.J. T cell ligation induces the formation of dynamically regulated signaling assemblies. J. Cell Biol. 2002;158:1263–1275. doi: 10.1083/jcb.200203043. [DOI] [PMC free article] [PubMed] [Google Scholar]
- 17.Wilson B.S., Pfeiffer J.R., Surviladze Z., Gaudet E.A., Oliver J.M. High resolution mapping of mast cell membranes reveals primary and secondary domains of FcɛRI and LAT. J. Cell Biol. 2001;154:645–658. doi: 10.1083/jcb.200104049. [DOI] [PMC free article] [PubMed] [Google Scholar]
- 18.Wilson B.S., Pfeiffer J.R., Oliver J.M. FcɛRI signaling observed from the inside of the mast cell membrane. Mol. Immunol. 2002;38:1259–1268. doi: 10.1016/s0161-5890(02)00073-1. [DOI] [PubMed] [Google Scholar]
- 19.Goldstein B., Perelson A.S. Equilibrium theory for the clustering of bivalent cell surface receptors by trivalent ligands: application to histamine release from basophils. Biophys. J. 1984;45:1109–1123. doi: 10.1016/S0006-3495(84)84259-9. [DOI] [PMC free article] [PubMed] [Google Scholar]
- 20.Peacock B.G., Barisas B.G. Photobleaching recovery studies of T-independent antigen mobility on antibody-bearing liposomes. J. Immunol. 1983;131:1924–1931. [PubMed] [Google Scholar]
- 21.Barisas B.G. Aggregation and gelation of divalent cell surface receptors by rigid polyvalent ligands: examination by theoretical, kinetic and thermodynamic techniques. Thermochim. Acta. 2003;400:1–20. [Google Scholar]
- 22.Yang J., Monine M.I., Faeder J.R., Hlavacek W.S. Kinetic Monte Carlo method for rule-based modeling of biochemical networks. Phys. Rev. E Stat. Nonlin. Soft Matter Phys. 2008;78:1–7. doi: 10.1103/PhysRevE.78.031910. [DOI] [PMC free article] [PubMed] [Google Scholar]
- 23.Houtman J.C., Higashimoto Y., Dimasi N., Cho S., Yamaguchi H. Binding specificity of multiprotein signaling complexes is determined by both cooperative interactions and affinity preferences. Biochemistry. 2004;43:4170–4178. doi: 10.1021/bi0357311. [DOI] [PubMed] [Google Scholar]
- 24.Cho S., Velikovsky C.A., Swaminathan C.P., Houtman J.C., Samelson L.E. Structural basis for differential recognition of tyrosine-phosphorylated sites in the linker for activation of T cells (LAT) by the adaptor GADS. EMBO J. 2004;23:1441–1451. doi: 10.1038/sj.emboj.7600168. [DOI] [PMC free article] [PubMed] [Google Scholar]
- 25.Houtman J.C., Brown P.H., Bowden B., Yamaguchi H., Appella E. Studying multisite binary and ternary protein interactions by global analysis of isothermal titration calorimetry data in SEDPHAT: application to adaptor protein complexes in cell signaling. Protein Sci. 2007;16:30–42. doi: 10.1110/ps.062558507. [DOI] [PMC free article] [PubMed] [Google Scholar]
- 26.Houtman J.C., Houghtling R.A., Barda-Saad M., Toda Y., Samelson L.E. Early phosphorylation kinetics of proteins involved in proximal TCR-mediated signaling pathways. J. Immunol. 2005;175:2449–2458. doi: 10.4049/jimmunol.175.4.2449. [DOI] [PMC free article] [PubMed] [Google Scholar]
- 27.Lin J., Weiss A. Identification of the minimal tyrosine residues required for linker for activation of T cell function. J. Biol. Chem. 2001;276:29588–29595. doi: 10.1074/jbc.M102221200. [DOI] [PubMed] [Google Scholar]
- 28.Bilgicer B., Moustakas D.T., Whitesides G.M. A synthetic trivalent hapten that aggregates anti-2,4-DNP IgG into bicyclic trimers. J. Am. Chem. Soc. 2007;129:3722–3728. doi: 10.1021/ja067159h. [DOI] [PMC free article] [PubMed] [Google Scholar]
- 29.Sastry L., Lin W., Wong W.T., Di Fiore P.P., Scoppa C.A. Quantitative analysis of GRB2-SOS1 interaction: the N-terminal SH3 domain of GRB2 mediates affinity. Oncogene. 1995;11:1107–1112. [PubMed] [Google Scholar]
- 30.Goldstein B., Wofsy C. Aggregation of cell surface receptors. Lect. Math Life Sci. 1994;24:109–135. [Google Scholar]
- 31.Maignan S., Guilloteau J.P., Fromage N., Arnoux B., Becquart J. Crystal structure of the mammalian Grb2 adaptor. Science. 1995;268:291–293. doi: 10.1126/science.7716522. [DOI] [PubMed] [Google Scholar]
- 32.Koretzky G.A. The role of GRB2-associated proteins in T-cell activation. Immunol. Today. 1997;18:401–406. doi: 10.1016/s0167-5699(97)01088-8. [DOI] [PubMed] [Google Scholar]
- 33.Gillespie D.T. Exact stochastic simulation of coupled chemical reactions. J. Phys. Chem. 1977;81:2340–2361. [Google Scholar]
- 34.Cao Y., Li H., Petzold L. Efficient formulation of the stochastic simulation algorithm for chemically reacting systems. J. Chem. Phys. 2004;121:4059–4067. doi: 10.1063/1.1778376. [DOI] [PubMed] [Google Scholar]
- 35.Hlavacek W.S., Faeder J.R., Blinov M.L., Perelson A.S., Goldstein B. The complexity of complexes in signal transduction. Biotechnol. Bioeng. 2003;84:783–794. doi: 10.1002/bit.10842. [DOI] [PubMed] [Google Scholar]
- 36.Hlavacek W.S., Faeder J.R., Blinov M.L., Posner R.G., Hucka M. Rules for modeling signal-transduction systems. Sci. STKE. 2006;344:re6. doi: 10.1126/stke.3442006re6. [DOI] [PubMed] [Google Scholar]
- 37.Meisner H., Conway B.R., Hartley D., Czech M.P. Interactions of CBl with GRB2 and phosphatidylinositol 3′-kinases in activated Jurkat cells. Mol. Cell. Biol. 1995;15:3571–3578. doi: 10.1128/mcb.15.7.3571. [DOI] [PMC free article] [PubMed] [Google Scholar]
- 38.Boomer J.S., Tan T.-H. Functional interactions of HPK1 with adaptor proteins. J. Cell. Biochem. 2005;95:34–44. doi: 10.1002/jcb.20401. [DOI] [PubMed] [Google Scholar]
- 39.Feng G.-S., Ouyang Y.-B., Hu D.-P., Shi Z.-Q., Gentz R. Grap is a novel SH3-SH2-SH3 adaptor protein that couples tyrosine kinases to the Ras pathway. J. Biol. Chem. 1996;271:12129–12132. doi: 10.1074/jbc.271.21.12129. [DOI] [PubMed] [Google Scholar]
- 40.Trüb T., Frantz J.D., Miyazaki M., Band H., Shoelson S.E. The role of a lymphoid-restricted GRB2-like SH3-SH2-SH3 protein in T cell receptor signaling. J. Biol. Chem. 1997;272:894–902. doi: 10.1074/jbc.272.2.894. [DOI] [PubMed] [Google Scholar]
- 41.Balagopalan L., Barr V.A., Sommers C.L., Barda-Saad M., Goyal A. c-Cbl-mediated regulation of LAT-nucleated signaling complexes. Mol. Cell. Biol. 2007;27:8622–8636. doi: 10.1128/MCB.00467-07. [DOI] [PMC free article] [PubMed] [Google Scholar]
- 42.Rotin D., Margolis B., Mohammadi M., Daly R.J., Daum G. SH2 domains prevent tyrosine dephosphorylation of the EGF receptor: identification of Tyr992 as the high-affinity binding-site for SH2 domains of phospholipase c-γ. EMBO J. 1992;11:559–567. doi: 10.1002/j.1460-2075.1992.tb05087.x. [DOI] [PMC free article] [PubMed] [Google Scholar]
- 43.Mao S.-Y., Metzger H. Characterization of protein-tyrosine phosphatases that dephosphorylate the high affinity IgE receptor. J. Biol. Chem. 1997;272:14067–14073. doi: 10.1074/jbc.272.22.14067. [DOI] [PubMed] [Google Scholar]
- 44.Faeder J.R., Hlavacek W.S., Reischl I., Blinov M.L., Metzger H. Investigation of early events in FcɛRI-mediated signaling using a detailed mathematical model. J. Immunol. 2003;170:3769–3781. doi: 10.4049/jimmunol.170.7.3769. [DOI] [PubMed] [Google Scholar]
- 45.Peirce M., Metzger H. Detergent-resistant microdomains offer no refuge for proteins phosphorylated by the IgE receptor. J. Biol. Chem. 2000;275:34976–34982. doi: 10.1074/jbc.M005819200. [DOI] [PubMed] [Google Scholar]
- 46.Morimatsu M., Takagi H., Ota K.G., Iwamoto R., Yanagida T. Multiple-state reactions between the epidermal growth factor receptor and GRB2 as observed by using single-molecule analysis. Proc. Natl. Acad. Sci. USA. 2007;104:18013–18018. doi: 10.1073/pnas.0701330104. [DOI] [PMC free article] [PubMed] [Google Scholar]
- 47.Tan P.K., Wang J., Littler P.-L.H., Wong K.K., Sweetnam T.A. Monitoring interactions between receptor tyrosine kinases and their downstream effector proteins in living cells using bioluminescence resonance energy transfer. Mol. Pharmacol. 2007;72:1440–1446. doi: 10.1124/mol.107.039636. [DOI] [PubMed] [Google Scholar]
- 48.Koonpaew S., Janssen E., Zhu M., Zhang W. The importance of three membrane-distal tyrosines in the adaptor protein NTAL/LAB. J. Biol. Chem. 2004;279:11229–11235. doi: 10.1074/jbc.M311394200. [DOI] [PubMed] [Google Scholar]
- 49.Zhu M.H., Janssen E., Leung K., Zhang W. Molecular cloning of a novel gene encoding a membrane-associated adaptor protein LAX in lymphocyte signaling. J. Biol. Chem. 2002;277:46151–46158. doi: 10.1074/jbc.M208946200. [DOI] [PubMed] [Google Scholar]
- 50.Wiegel F.W., Perelson A.S. Statistical mechanics of red blood cell aggregation: the distribution of rouleaux in thermal equilibrium. J. Stat. Phys. 1982;29:813–848. [Google Scholar]
- 51.Weisstein, E.W. http://mathworld.wolfram.com/BinomialSeries.html. MathWorld-A Wolfram Web Resource, 2006.
- 52.Weisstein, E.W. http://mathworld.wolfram.com/IntegerDivision.html. MathWorld-A Wolfram Web Resource, 2007.
- 53.Rosenbluth M.J., Lam W.A., Fletcher D.A. Force microscopy of nonadherent cells: a comparison of leukemia cell deformability. Biophys. J. 2006;90:2994–3003. doi: 10.1529/biophysj.105.067496. [DOI] [PMC free article] [PubMed] [Google Scholar]
- 54.Chook Y.M., Gish G.D., Kay C.M., Pai E.F., Pawson T. The GRB2-MSOS1 complex binds phosphopeptides with higher affinity than Grb2. J. Biol. Chem. 1996;271:30472–30478. doi: 10.1074/jbc.271.48.30472. [DOI] [PubMed] [Google Scholar]
Associated Data
This section collects any data citations, data availability statements, or supplementary materials included in this article.