

Abstract
The most commonly used optical-trapping assays are coupled to surfaces, yet such assays lack atomic-scale (∼0.1 nm) spatial resolution due to drift between the surface and trap. We used active stabilization techniques to minimize surface motion to 0.1 nm in three dimensions and decrease multiple types of trap laser noise (pointing, intensity, mode, and polarization). As a result, we achieved nearly the thermal limit (<0.05 nm) of bead detection over a broad range of trap stiffness (kT = 0.05–0.5 pN/nm) and frequency (Δf = 0.03–100 Hz). We next demonstrated sensitivity to one-basepair (0.34-nm) steps along DNA in a surface-coupled assay at moderate force (6 pN). Moreover, basepair stability was achieved immediately after substantial (3.4 pN) changes in force. Active intensity stabilization also led to enhanced force precision (∼0.01%) that resolved 0.1-pN force-induced changes in DNA hairpin unfolding dynamics. This work brings the benefit of atomic-scale resolution, currently limited to dual-beam trapping assays, along with enhanced force precision to the widely used, surface-coupled optical-trapping assay.
Introduction
Detection of single-molecule motion at or near the atomic-scale (∼0.1 nm) reveals previously inaccessible details about biomolecular dynamics (1). Surface-coupled trapping assays have measured the one-codon step of the ribosome that, with mechanical amplification, corresponds to a 2.7-nm displacement (2). To resolve smaller motions, such as the one-basepair (0.34-nm) step of RNA polymerase (3), researchers decoupled their experiments from the surface using dual-beam optical-trapping assays (3,4) to reduce surface-induced noise. Yet, the vast majority of single-molecule optical-trapping assays are coupled to surfaces (5–11). What is needed is a general method that permits surface-coupled optical-trapping assays to achieve positional precision at or near the atomic scale.
Measurements of biological motion by optical-trapping nanometry are corrupted by various noise sources (thermal, mechanical, laser, etc.). Thermally driven Brownian motion is dominant on short timescales (<0.01–0.1 s). Such motion, which has a zero mean, can be averaged to atomic-scale dimensions at the expense of temporal resolution and sets a theoretical limit for positional precision (i.e., the thermal limit; see the next section). To achieve this thermal limit, other noise sources must be reduced to maintain atomic-scale instrumental stability over the same (or ideally longer) time period.
Current surface-coupled optical-trapping assays lack such atomic-scale instrumental stability. A surface-coupled assay is physically connected to its local environment (e.g., coverslip or micropipette) and thus is sensitive to mechanical perturbations through this connection. One common application of this class of assays has a DNA molecule attached to a surface at one end while attached to an optically trapped bead at the other (Fig. 1 A). As a first step toward a surface-coupled optical-trapping instrument with atomic-scale sensitivity, we stabilized an optical microscope to 0.1 nm in three dimensions (12). In applying this technique to optical traps, two detection lasers (one monitoring the trapped bead, the other measuring fiducial position) establish a local, differential measurement reference frame (Fig. 1 B). Local detection suppresses motion (e.g., thermal expansion) unmeasured by sensors in closed-loop stages. Differential measurement suppresses noise (e.g., air currents, objective drift) common to both lasers (13). The ultimate limit on instrumental stability is set by the differential pointing stability between the detection lasers (<0.065 nm laterally, Δf = 0.1–50 Hz).
Figure 1.

Experimental diagram. (A) A DNA molecule is held between two points, a coverslip and a trapped bead (purple). One laser (orange) monitors the position of a fiducial mark in three dimensions (e.g., xfid) to actively suppress mechanical perturbations. A second laser (green), collinear to the trap, measures bead position (xbd). The xstage is the distance between the DNA's anchor point to the coverslip and the center of the optical trap. (B) Optical layout for stabilized optical trapping. Two detection lasers (DL, λ = 785 nm and 850 nm) were stabilized using an acousto-optic modulator (AOM) based feedback loop (12). The trap laser (TL, purple) was stabilized using a modified version of this method that imaged the AOM onto the fiber-coupling lens (optically conjugate planes shown in light green). All three lasers were combined with dichroics to couple them into the objective (Obj). Mirrors in conjugate planes (light blue) to the back-focal plane of the objective enabled independent beam steering of the three beams. We measured bead and sample position in three dimensions using back-focal-plane detection. Acronyms represent the following: OI, optical isolator; PBS, polarizing beamsplitter; PD, photodiode; BS, beam sampler; PZT, piezo-electric; QPD, quadrant photodiode; and λ/2, half-wave plate.
Mechanical stabilization of the surface alone was insufficient to achieve atomic-scale resolution in our optical-trapping apparatus. The trapping laser was also a significant source of instrumental noise. To achieve basepair resolution, dual-beam assays not only decoupled their assay from the surface, they reduced laser pointing instability by either encasing the optics in a helium enclosure (3) or by using a differential measurement (4). In contrast with these passive methods, we adopted an active method (Fig. 1 B). We translated pointing, mode, and polarization noise into intensity noise through the combination of a single-mode, polarization-maintaining fiber and a polarizing beam splitter. The resulting intensity was sampled and actively stabilized with a feedback loop to an acousto-optic modulator (AOM) positioned before the fiber. Minimization of intensity was motivated, in part, by our analysis that shows that trap intensity fluctuations of 1% induce apparent motion of 1 bp for a 1-μm-long DNA molecule (see the next section).
For studying the dynamics of molecular motors and nucleic acid structures, we sought to achieve atomic-scale stability immediately after substantial (3.4 pN) changes in applied force. Previous work has only reported basepair stability at constant force, presumably after any thermal perturbations caused by changes in the trap laser power have subsided. Minimization of laser noise during changes in laser power was not straightforward. Large changes in the requested laser power led to a gain inversion in our feedback system and unpredictable results. The root cause was a thermal transient in the AOM induced by a change in the radio-frequency power used to modulate the laser power. Such transients took tens of seconds to ∼10 min to subside. Understanding the origin of this pointing error allowed us to add extra optics to minimize its effect. With this enhanced active stabilization of the trapping laser in conjunction with active stabilization of the stage, we demonstrated sensitivity to 1-bp steps along DNA at moderate force and 1-bp stability immediately after a substantial change in force as well as sensitivity to 0.1-pN force-induced changes in DNA hairpin-unfolding dynamics.
Noise in Optical-Trapping Assays
Thermal noise limit
Brownian motion of a trapped bead has a zero mean, so time-averaging the bead position (xbd) reduces the uncertainty in position as long as instrumental drift is negligible over the time span averaged (τavg). On short timescales (<1/f0; f0 is the roll-off frequency of the trapped bead motion), bead motion is correlated and thus, not statistically independent. However, by averaging N independent data points spaced at the correlation time (1/f0), the standard deviation of the data (; kBT is thermal energy and kT is the trap stiffness (14)) decreases by to achieve the thermal limit of detection. The uncertainty in xbd after averaging over τavg is given by the standard error of the mean (σSEM), i.e.,
| (1) |
where kT = 12π2ηrbdf0, η is the viscosity of the liquid, and rbd is the radius of the bead. We note that this calculation is for an isolated trapped bead removed from the surface. Theoretically, in an optical trap with a high trap stiffness of kT = 0.53 pN/nm and rbd = 165 nm, this uncertainty reduces to 1 bp in 2.5 ms. At a moderate kT of 0.086 pN/nm, the time to average to σSEM = 1 bp increases to 95 ms. Experimentally, we achieved one-basepair resolution in 2.5 ms and 103 ms, at the respective kT. Thus, averaging of thermal noise can quantitatively match the theoretically predicted results, achieving basepair precision in xbd at reasonable bandwidths.
Intensity fluctuations affect measurements of DNA length
Multiple types of laser noise degrade trap performance and therefore instrumental stability. Laser pointing noise causes motion of the trap relative to the detection laser and thus erroneous measurements in xbd. Historically, methods to reduce laser noise have primarily focused on laser pointing instability (3,4), because such motion has a 1:1 coupling with bead motion. However, under load, fluctuations in intensity lead to fluctuations in bead position since the bead is offset from the trap center (Fig. 2 A). Here we calculate the effect intensity fluctuations have on both xbd and the contour length (L) in a DNA-tethered particle assay (Fig. 2 B).
Figure 2.
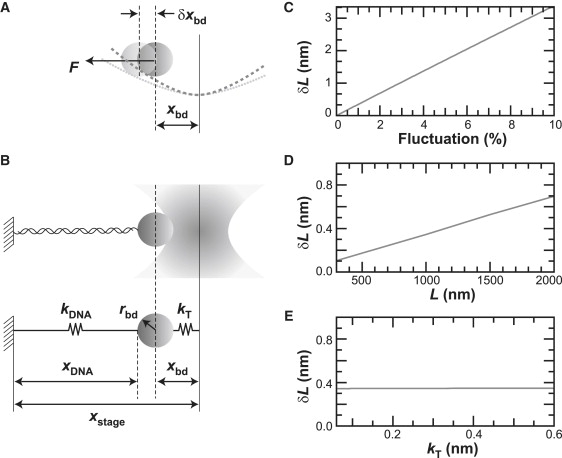
Intensity noise affects trapped bead position (xbd) and measurements of DNA contour length (L). (A) Unwanted bead motion (δxbd) occurs under constant load (F) when an intensity fluctuation (δI) decreases the trapping potential. (B) A one-dimensional diagram of the experiment and its mechanical analog. Variables represent the following: kDNA is the stiffness of the DNA molecule, kT is the trap stiffness, xstage is the distance between the tether point and the trap center, xDNA is the end-to-end extension of the DNA, and rbd is the bead radius. (C–E) Based on a first-order calculation (Eq. 8), the uncertainty in DNA contour length (δL) is linear in intensity fluctuation (C) and DNA length (D) but independent of kT at constant force (E). Calculations were performed with a constant trap force of 6 pN and rbd of 165 nm. When parameters were not varied, they were held fixed at the following values: dI/I = 1%, kT = 0.086 pN/nm, kDNA = 0.187 pN/nm, xbd = 70 nm, and L = 1000 nm.
We use a simplified one-dimensional model where the forces on the bead are balanced. The force exerted by the DNA (FDNA) is equal to the force exerted by the trap (FT), i.e.,
| (2) |
Initially, FDNA is equal to F0DNA = k0Tx0bd, where F0DNA is the initial force, x0bd is the initial bead position, and k0T is the initial trap stiffness. If the intensity of the trap (I) fluctuates by δI, there will be a fluctuation in the trap stiffness () that moves the bead (δxbd) and changes FDNA. To calculate the current FDNA, we use a Taylor series to expand around the initial extension of the DNA (x0DNA), i.e.,
| (3) |
where we define the initial DNA stiffness as . Thus, after the intensity fluctuation, the balance of forces in Eq. 2 can now be rewritten as
| (4) |
Solving for δxbd gives
| (5) |
After calculating δxbd, we calculate the apparent change in the contour length, δL. We determine the fractional extension of the DNA (), which is the ratio of the DNA extension to the contour length. To determine f, we use a simple inverse formula valid at moderate force 1 pN < F <10 pN (15) where enthalpic stretching is not significant (16),
| (6) |
Here kBT is thermal energy (4.1 pN-nm), and p is the persistence length of the DNA (40 nm) at our ionic conditions and contour length (1000 nm) (17). Then, we can use f to find L,
| (7) |
where xstage is the distance between the trap center and the tether point of the DNA. Given Eqs. 6 and 7, δL can be found by calculating the initial contour length and subtracting it from the current contour length:
| (8) |
As expected in a first-order approximation, we find that δL ∝ δI (Fig. 2 C) and δL ∝ L (Fig. 2 D). We note that at constant force, δL is independent of kT (Fig. 2 E). Given the parameters (F0DNA = 6 pN, k0T = 0.086 pN/nm, L = 1000 nm, k0DNA = 0.187 pN/nm, rbd = 165 nm), we calculate that a 1% fluctuation in intensity creates a |δxbd| of 0.22 nm and a |δL| of 0.34 nm. Thus, this 1-bp apparent motion due to a 1% intensity fluctuation (a typical specification for commercial lasers) motivated us to minimize intensity noise in combination with pointing noise to improve long-term instrumental stability.
Materials and Methods
Optical trapping microscope
Our highly stable optical-trapping system, based on earlier work (12,13), consisted of a high-powered 1064-nm laser for trapping, a 785-nm laser for detecting bead motion, and an 850-nm laser for detecting stage drift (Fig. 1 B). We used both passive and active methods to improve the stability of the apparatus.
Passive stabilization of the instrument reduced mechanical, thermal, and laser noise. We improved the mechanical stability of the microscope (TE-2000; Nikon, Tokyo, Japan) by stiffening the condenser pillar with an aluminum trapezoid (12.5-mm thick). In addition, the objective and stage were mounted with custom-built monolithic parts, and the whole apparatus was mounted on a research-grade optical table. We reduced thermal noise by coupling the lamp to the microscope with a liquid light guide (3-mm diameter; Rofin, Dingley Victoria, Australia). To minimize laser noise, optics external to the microscope were enclosed in a box, and the beam path was further enclosed in 25-mm diameter tubing where possible. Measurements were made in an acoustically quiet (NC30), temperature-regulated room (±0.2°C).
Active stabilization was used to minimize the instrumental drift of the lasers and the sample. We actively stabilized the sample by measuring a fiducial mark on the surface (a low-index glass post (12) or a silicon disk (18)). We then used this position in a feedback loop to a piezo-electric (PZT) stage (P517.3CD; Physik Instrumente, Karlsruhe, Germany) to keep the surface position constant relative to the detection laser. We actively stabilized the detection lasers, as reported earlier (12).
We detected bead and fiducial marks using back-focal-plane detection (19–21); detection electronics were the same as in previous work (12). Trap stiffness was controlled by a computer-generated voltage to the trap intensity servo. Trap stiffness, at 10 different laser intensities, was calibrated using the equipartition theorem at a trap height of ∼400 nm from the surface and verified to within 10% using power spectral analysis.
Active reduction of trap laser noise
To reduce trap laser noise, we also used active stabilization. Specifically, we minimized multiple types of laser noise by transforming pointing, mode, and polarization noise into intensity noise using the combination of a single-mode, polarization-maintaining fiber and a polarizing beam splitter, as was previously done for the detection lasers (12). We then sampled 10% of the light onto a photodiode (YAG-444-A; PerkinElmer Optoelectronics, Fremont, CA). The photodiode signal was converted to voltage using an analog transimpedance amplifier with a resistance of 10 kΩ (see (22) and for more advanced circuits (23)) and was analyzed using custom-built electronics. Specifically, we used a low-delay, proportional-integral analog servo controller with a 200 kHz bandwidth (24) that output a voltage signal to the AOM (1205C, lead molybdate crystal; Isomet, Springfield, VA). The 1064-nm trap laser was 10 W (Millennia IR; Spectra-Physics, Mountain View, CA). Critical to our success was disabling the fan in the head unit and replacing it with a ducted, 18.6-L/s fan to reduce transient heating of the Nd:YVO4 crystal.
Simple application of our previous active stabilization method resulted in a gain inversion when the output intensity of the AOM was changed substantially. The gain inversion was caused by transient heating of the AOM crystal, resulting in index changes that shifted the diffraction angle (Δθ) of the beam. Previous measurements of pointing instability after large intensity changes (almost the full range) in a different AOM crystal (germanium) have been as large as 4 mrad in just 2 s (25). In our experimental geometry, the transient pointing error was converted into a time- and history-dependent intensity error. In other systems, this AOM-induced error would lead to translations of the trap laser focus. For the germanium AOM error, this pointing fluctuation would correspond to an 8 μm lateral motion (Δx = fΔθ, where f is the effective focal length of the objective (2 mm)).
To minimize the effects of the AOM pointing instability, we imaged the AOM crystal onto the fiber coupling lens. This eliminated the lateral translations of the laser beam onto the coupling lens that degraded fiber coupling efficiency. With these added optics, we decreased the steady-state trap intensity noise to 0.01% root mean-square (RMS) at moderate laser powers (200 mW, Δf = 0.03–100 Hz (Fig. 3 A)). Importantly, similar trap intensity control of 0.01% RMS was achieved immediately after changes in intensity (Fig. 3, B–D). Without feedback, there was a substantial, time-dependent, AOM-induced error between the requested and actual laser intensity that was not present with feedback (Fig. 3, B and C). This long-term systematic error could take from tens of seconds (Fig. 3 B) to ∼10 min (at the highest change in laser power) to stabilize. We note that the large (up to 45%) systematic error reported here before stabilization (Fig. 3 C) was achieved only after imaging the AOM onto the optical fiber coupling lens. In addition to this long-term error, there was also a short-term (Δf = 0.2–2000 Hz) AOM-induced error of ∼10% (RMS) after an intensity change that was reduced by three orders of magnitude to 0.01% (RMS) with active intensity stabilization (Fig. 3 D). Absolute intensity stability is limited by the combination of room temperature variation (±0.2°C) and the photodiode's temperature-dependent responsivity (0.1%/°C (manufacturer's specification)).
Figure 3.

Reduction of intensity noise. (A) Steady-state normalized power of the trap laser with (green) and without (red) stabilization. Data was taken after 1 h of equilibration time. (B) A step increase in laser power from 150 to 300 mW with and without feedback. Such steps led to a slow (>10 s), substantial (>3%) systematic error. Intensity stabilization effectively minimized this error. Traces offset for clarity. Inset is a zoom-in of the transient noise where the data was normalized. (C) Records of power versus time during rapid (5 s) changes in power with and without stabilization. Without stabilization, the final measured power was only 55% of the intended value (750 mW). Only after ∼10 min at the desired power did the unstabilized trace equilibrate to within 1% of the requested power (data not shown). (D) The short-term (5 s) fractional standard deviation (σ) as a function of each power as in panel C. The intensity-stabilized trace shows approximately three orders-of-magnitude improvement over the unstabilized trace and is <0.1% (black dashed line) over the full range. Traces in panels A–C are at 2 kHz and color in panels B–D is the same as in panel A.
In summary, prior work (3,4) has emphasized the importance of minimizing pointing noise. Our calculations showed the importance of controlling intensity noise when the bead is offset from the trap center. Moreover, we found that changes in laser intensity using an AOM introduced significant pointing errors. Our feedback system successfully minimized both pointing and intensity noise (as well as other sources) during changes in laser power. In previous experiments with intensity modulated force clamps (16), apparent bead motion due to intensity fluctuations may have gone unnoticed due to a >2-nm instrumental noise (26). However, as researchers make basepair resolution experiments more accessible, it is clear that intensity noise of the trapping beam is a systematic error that is important to address.
Sample preparation
We fabricated fiducial marks (low-index glass posts (12), radius = 500 nm; silicon disks (18), radius = 500 nm) onto coverslips for use in active stabilization. To enhance usability in single-molecule assays, the coverslips were cleaned with a 10-min Piranha etch (100 mL H2SO4 and 15 drops H2O2 at 80°C) after nanofabrication. We constructed epoxy-rigidified flow chambers using double-stick tape (3M, St. Paul, MN) as a spacer and 5-min epoxy (Devcon, Danvers, MA) for rigidity. The epoxy was essential to both stiffening the flow chamber and maintaining its structural integrity over ∼12 h while exposed to aqueous solution. For experiments with only a trapped bead, we used 10-fM polystyrene beads (330-nm diameter; Interfacial Dynamics, Eugene, OR) in wash buffer (25-mM Tris acetate, pH 7.5; 1 mM Mg(OAc)2; 1 mM NaCl; 1 mM dithiothreitol; 0.4% Tween-20 (Bio-Rad, Hercules, CA); and 3-mg/mL bovine serum albumin (concentration cited is that before filtration through a 0.2-μm filter)).
For experiments with DNA, we prepared double-stranded DNA by polymerase chain reaction (GeneAmp XL PCR Kit; Applied Biosystems, Foster City, CA) using one digoxigenin-labeled and one biotin-labeled primer (Integrated DNA Technologies, Coralville, IA). These labels enabled us to attach a DNA molecule (L = 556 or 1007 nm) at one end to a streptavidin-coated bead (320-nm diameter; Spherotech, Lake Forest, IL) and at the other end to an antidigoxigenin-coated coverslip. Coated coverslips were made by incubating 20 μg/mL antidigoxigenin antibody (Roche, Indianapolis, IN) suspended in 0.1 M sodium phosphate buffer for 1 h in flow chambers. Bead-DNA complexes were made by incubating streptavidin-coated beads (900 pM) at a 9:1 molar ratio with labeled DNA at room temperature. After washing the flow chamber with wash buffer, the bead-DNA mixture was flowed into the chamber and allowed to incubate for 1 h before washing again. Preparation of the 20TS06/T4 hairpin followed published protocols (27), and tethers (L = 1020 nm) were made using a protocol similar to the one above. Coverslips were reused (>20 times) by soaking the flow chamber in boiling water for 1 h (to remove the coverslip) and then cleaning the coverslip with a 10-min Piranha etch.
DNA stretching under active stabilization
For a bead-DNA complex, we first determined the vertical location of the surface by monitoring the sum signal as a tethered bead was brought into contact with the surface (28). We then lowered the stage 300 nm. We found the lateral tether point position by performing a two-dimensional elasticity-centering procedure, which also returned the persistence length. Bead-DNA complexes anchored by multiple DNA molecules (determined by a low persistence length) were not studied. We next centered the 850-nm laser on a nearby fiducial mark using a PZT mirror. Finally, we stretched the DNA along the x axis using the PZT stage to a specified force (with a corresponding move of the stage-tracking 850-nm laser). After stretching the tether, we actively stabilized the sample using a simple software-based feedback loop with a 100-Hz update rate and a proportional gain of 0.05. Concurrent with measuring fiducial mark position, the software also measured the trapped bead position.
Contour length was derived using the well-established method of Wang et al., which takes into account both the vertical and horizontal motion of the bead in the trap (16). For this analysis, one needs xstage, xbd, rbd, the ratio of horizontal to vertical trap stiffness (5.2), and ztrap, the height from the coverslip surface to the trap center. As stated above, trap stiffness was calibrated at 10 different stiffness values (up to 0.4 pN/nm) using both the equipartition theorem and power spectral analysis. We also established the linearity of the trap (FT = kT xbd) using hydrodynamic drag, with a <2% deviation from linearity at xbd ∼ 70 nm.
For measuring DNA hairpin dynamics under constant force, we implemented a force-clamp in parallel with the above stage stabilization. We modulated kT at 100 Hz such that the force (FT = kT xbd) was maintained to ∼0.01%. Since we aperiodically modulated kT by ∼20% to maintain constant FT, substantial low-frequency intensity noise would be expected without active stabilization in laser intensity (Fig. 3 B). The benefit of modulating kT over moving the stage is a faster response time and the ability to have two independent servo loops controlling sample position and force.
Results and Discussion
Atomic-scale sensitivity to trapped bead motion
After reducing both surface perturbations and trap laser noise, we first demonstrated the excellent positional stability of the trap laser relative to the detection laser. One useful metric is to plot the power spectral density (PSD) of a trapped bead (Fig. 4 A, inset), which shows the noise as a function of frequency. Another useful metric for calculating noise is to integrate the PSD within a specified bandwidth to produce the integrated noise. This integrated noise (0.17 nm) was a fraction of a basepair over a broadly useful bandwidth (Δf = 0.02–100 Hz) for a 330-nm diameter bead trapped at a stiffness of 0.53 pN/nm (Fig. 4 A). This noise level was within 0.05 nm of the thermal noise limit and was maintained over a wide range of trap stiffness (Fig. 4 B). Interestingly, our integrated trap noise was only ∼0.05 nm higher than the best reported trap stability (3), though our method used a fourfold lower stiffness and did not require the encasement of optics in helium.
Figure 4.
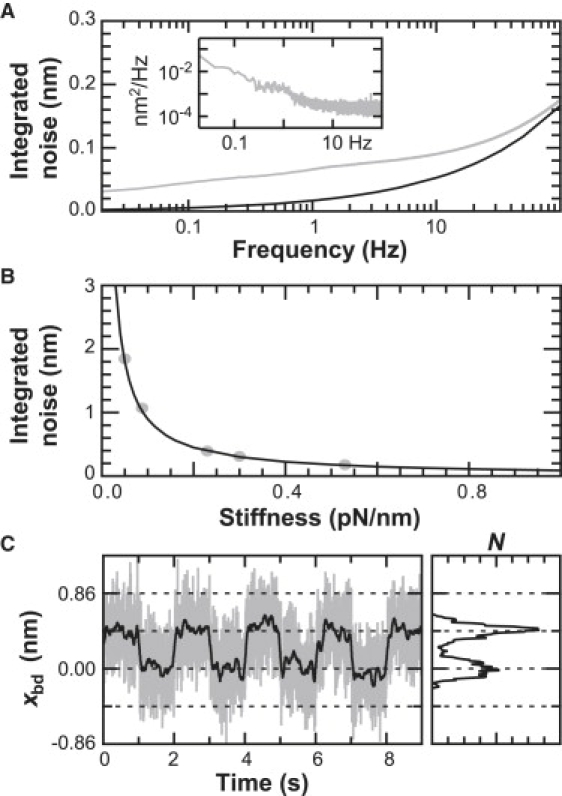
Precise tracking of trapped bead position. (A, inset) The power spectral density (PSD) in xbd for an isolated trapped bead (kT = 0.53 pN/nm). (A) The integrated noise in xbd (shaded) of the PSD is within 0.05 nm of the thermal limit (solid). (B) Likewise, the integrated noise (shaded circles) over a bandwidth of 0.03–100 Hz at different trap-stiffness values follows the thermal noise limit (solid line). (C) Steps in xbd as the trapping laser was moved back and forth relative to the detection laser. Data was filtered with a Savitzky-Golay window to 100 Hz (shaded) and 5 Hz (solid). A histogram of the 5 Hz data shows distinct peaks.
Next, we achieved atomic-scale sensitivity to bead motion. Using a PZT mirror, we generated 0.4-nm trap motion (limited by 1 bit changes in a control voltage). The resulting steps were well resolved (0.43 ± 0.08 nm (peak ± half-width at half maximum, HWHM)) with a signal/noise ratio of 5 in a trace filtered to 5 Hz using a Savitzky-Golay window (Fig. 4 C). Thus, by reducing mechanical perturbations and excess trapped-bead noise, we achieved sufficient stability and precision to measure atomic-scale bead motion.
1-bp sensitivity in a surface-coupled assay
We next achieved 1-bp stability in a surface-coupled DNA assay (Fig. 1 A) over tens of seconds. Measurements of DNA contour length (L = 556 nm) were taken at a moderate force of 6 pN with and without active stabilization of both the surface and trap (Fig. 5 A). Active stabilization resulted in a fourfold decrease in the integrated noise to 0.15 nm at 0.1 Hz (Fig. 5 B). Additionally, we maintained a 1-bp (0.34-nm) positional precision over a useful frequency range (Δf = 0.03–2 Hz). The stability for a 10-fold longer time period (Fig. 5 C) was slightly larger at 0.48 nm (Δf = 0.003–2 Hz). Such long-term traces contain some rapid changes in L of ≥1 bp. At this noise level, only ∼10% of identified steps would be erroneous for a molecular motor stepping in 1-bp increments at the rate of 0.2 s−1. As expected, the spatial precision increased with increasing force (Fig. 5 D) over a broad bandwidth (Δf = 0.1–10 Hz), but is currently limited by the residual error in stage stabilization.
Figure 5.
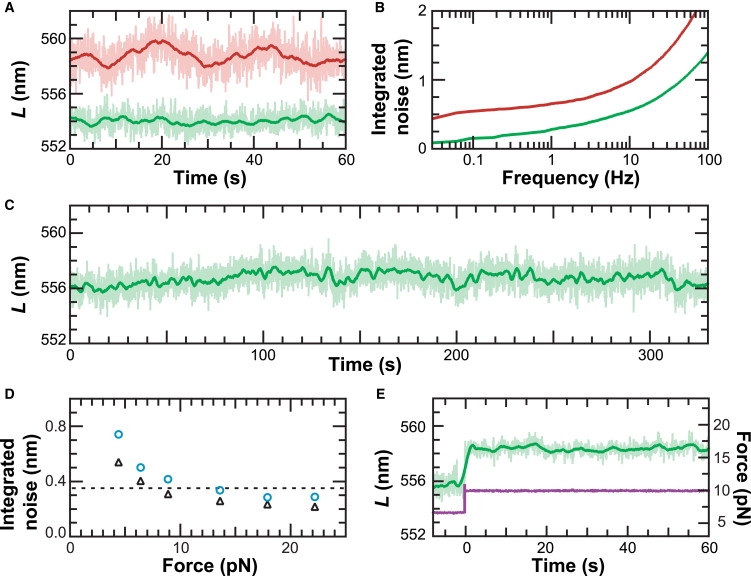
One-basepair positional stability. (A) DNA contour length (L) measurement with (green) and without (red) active stabilization of both the trap and surface. Data taken at F = 6 pN and xbd = 70 nm, and filtered using a Savitzky-Golay window (light = 5 Hz, dark = 0.2 Hz). (B) The integrated noise for traces in panel A. With active stabilization (green), the positional stability of the system increases fourfold at 0.1 Hz and is 1 bp (0.34 nm) over Δf = 0.03–2 Hz. (C) Record of L versus time over 5 min, with the same conditions and trace color as in panel A. (D) The integrated noise in L (Δf = 0.1–10 Hz) as a function of force at two different lengths (556 nm (black triangles), 1007 nm (blue circles)). (E) Record of length versus time during a 3.4-pN increase in force (purple). Trace color and conditions same as in panel A. Traces offset vertically for clarity in panels A, C, and E.
Ideally, we seek to perform high-resolution studies of force-sensitive states. For example, the Escherichia coli RecBCD helicase experiences a force-induced backward slip if exposed to F > 6 pN after a short time (∼1–10 s) (26). To measure RecBCD's motion with basepair resolution during such short-lived states, one would make a step change in the force from less than to greater than 6 pN and take data within this sub-10 s time window—a period much shorter than the thermal equilibrium time of the AOM (∼10–1000 s). Such force jumps have also been used to characterize RNA structures (29).With active stabilization of the lasers and the microscope, we attained 1-bp stability after dynamic force changes generated by modulating kT. Specifically, the spatial precision in the 60 s after a force change of 3.4 pN (Fig. 5 E) yielded a stability of 0.31 nm (RMS) over Δf = 0.1–10 Hz, in quantitative agreement with steady-state measurements (Fig. 5 D). A small (∼2 nm), systematic offset in L accompanied the change in force. Such offsets have been seen previously (26) and are due, in part, to the difficulty in correctly modeling the elasticity of short DNA molecules (17).
Finally, we demonstrated sensitivity to steps along DNA by moving the stage in a series of 0.34-nm increments every 5 s (Fig. 6 A). Conceptually, this stage motion is the signal input (Fig. 6 A, blue). The deduced contour length, calculated without incorporating the stage motion, is the signal corrupted by thermal and mechanical noise. Quantification of steps in single-molecule experiments can be done by a step-fitting algorithm (6). Such fitting of our data recapitulated the input motion over both a few (0.33 ± 0.08 nm (mean ± SD; N = 6)) and many steps (0.38 ± 0.13 nm (mean ± SD; N = 52)). Another metric to demonstrate step detection is a pairwise-distance distribution that revealed a peak at 0.31 ± 0.09 nm (peak ± HWHM) (Fig. 6 B). Experimentally, the signal/noise ratio of the data is ∼4, within the signal/noise threshold for accurate determination of steps (30). Thus, we resolved the smallest known biological step in the widely used surface-coupled assay.
Figure 6.
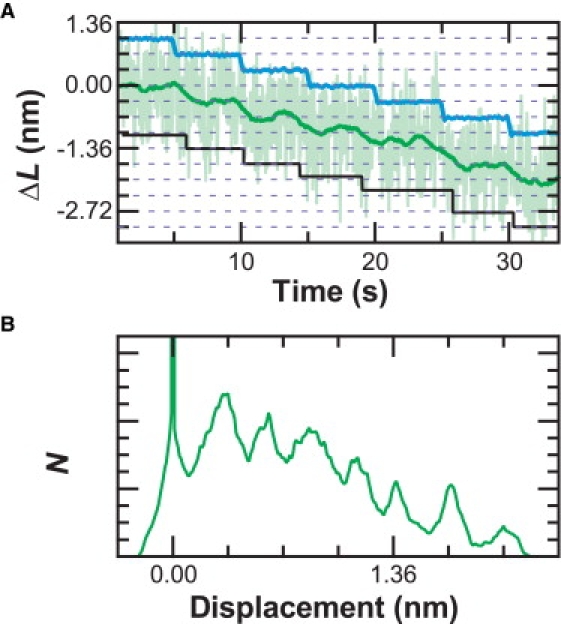
Sensitivity to 1-bp steps. (A) To demonstrate the resolution of the system, the stage was moved in 0.34-nm increments (blue) such that the apparent DNA contour length changes (ΔL). A step-fitting algorithm found steps (black) at 0.33 ± 0.08 nm (mean ± SD, N = 6). Data taken at F = 6 pN and xbd = 70 nm, and then filtered using a Savitzky-Golay window (light green = 5 Hz, dark green = 0.2 Hz). Traces offset for clarity. (B) A pairwise distance distribution of the 0.2-Hz data from A shows a peak at 0.31 ± 0.09 nm (peak ± HWHM).
Precise force control
The precise control of force developed here is beneficial to experiments beyond resolving steps of molecular motors. Biological structures are highly sensitive to changes in the applied force (8,27). To illustrate the importance of steady-state force control, we studied a previously characterized DNA hairpin, 20TS06/T4 (27), and measured its unfolding dynamics (Fig. 7). We obtained an unfolding distance (Δx) of 19.7 nm and a force at which the hairpin has a 50% probability of being unfolded (F1/2) of 12.3 pN, in quantitative agreement with previous results (27). Small force changes (ΔF) of 0.1 pN in either direction substantially shifted the probability of being unfolded (Fig. 7). More quantitatively, a force change of <1% (ΔF/F1/2) shifted the probability of being folded by ∼20%. In such cases where the biological molecule under study is exquisitely sensitive to the applied force, precise force control must be maintained. Yet, commercial lasers rarely specify intensity stability to >1%. Hence, our reduction in intensity noise to ∼0.01% (RMS) provides a biologically useful increase in precision for force measurements.
Figure 7.
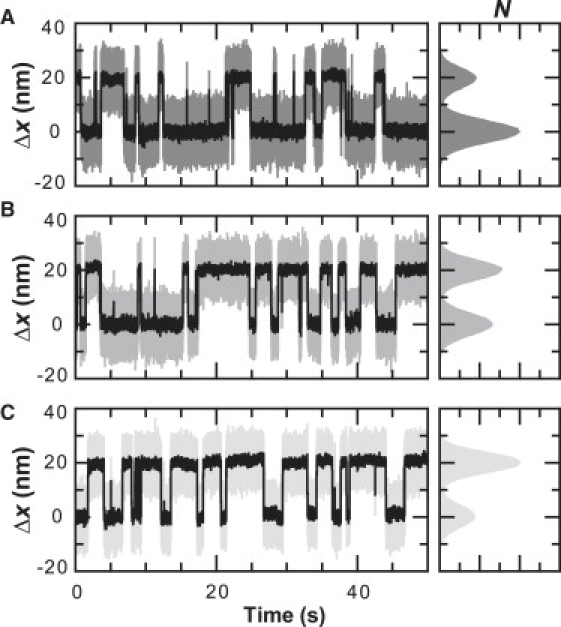
Force precision. DNA hairpin dynamics under a constant load of (A) 12.2 pN, (B) 12.3 pN, and (C) 12.4 pN. Data filtered using a Savitzky-Golay window (2 kHz, shaded; 100 Hz, solid). Histogram of the data shows probability of being unfolded increases from 29% (12.2 pN) to 52% (12.3 pN) and then to 68% (12.4 pN).
Conclusions
We used active stabilization of both the surface and trap to achieve 1-bp positional precision in a surface-coupled optical-trapping assay. By actively stabilizing multiple forms of laser noise, we tracked bead position to within 0.05 nm of the thermal limit and measured 0.1-pN force-induced changes in DNA hairpin unfolding dynamics. Our current short-term (∼1 s) positional precision is limited by the residual error (0.1 nm) in surface stabilization. We expect that it is this noise that prevents us from reaching the theoretical limit under these conditions (30). Further improvements to increase surface stabilization could include a feedback loop with a field-programmable gate array coupled with a stiffer stage to increase the loop closure time (31). To improve long-term stability, differential laser motion could be minimized with a more compact optical design and by launching all three lasers from one fiber. This improved the differential laser stability for two lasers, in a different application, from ∼65 pm laterally to 19 pm (Δf = 0.1–50 Hz) (18).
In comparison with existing high-resolution dual-beam methods (3,4), we achieved 1-bp positional precision at a factor of 1.2–3 lower force with a surface-coupled assay and without the encasement of optics in helium. Dual-beam assays with passive force-clamps enable enhanced measurements, in part, by eliminating the need for a compliance correction (32). Dual-beam assays with differential detection offer a small (), but significant, increase in time resolution (4). In contrast, our active stabilization method increases force sensitivity, stabilizes the geometry in all three dimensions, and is surface-coupled for rapid adoption to a wide variety of existing assays (5–11). Dual-beam assays would also benefit from increased force precision. Future assays could combine single-molecule force and fluorescence assays using total internal reflection fluorescence, a surface-based technique (9), with the enhancements presented here.
Acknowledgments
The authors thank Marileen Dogterom for the step-finding algorithm, Wayne Halsey for DNA preparation, Lora Nugent-Glandorf and Amanda Carpenter for help in the early development of the apparatus, and the JILA shops for custom machining and electronics.
This work was supported by a Burroughs Wellcome Fund Career Award in the Biomedical Sciences (to T.T.P.); a grant from the Optical Science and Engineering Program (National Science Foundation—Interdisciplinary Graduate Education Research Traineeship) (to A.R.C.); a National Physical Science Consortium fellowship (to A.R.C.); grants from the National Science Foundation (Nos. Phy-0404286 and Phy-1551010); a W.M. Keck Initiative in the RNA Sciences; and the National Institute of Standards and Technology (NIST).
Mention of commercial products is for information only; it does not imply NIST's recommendation or endorsement. T.T.P. is a staff member of NIST's Quantum Physics Division.
Footnotes
Present address: Yeonee Seol's present address is Laboratory of Molecular Biophysics, National Institute of Health, Bethesda, MD.
References
- 1.Moffitt J.R., Chemla Y.R., Smith S.B., Bustamante C. Recent advances in optical tweezers. Annu. Rev. Biochem. 2008;77:205–228. doi: 10.1146/annurev.biochem.77.043007.090225. [DOI] [PubMed] [Google Scholar]
- 2.Wen J.D., Lancaster L., Hodges C., Zeri A.C., Yoshimura S.H. Following translation by single ribosomes one codon at a time. Nature. 2008;452:598–603. doi: 10.1038/nature06716. [DOI] [PMC free article] [PubMed] [Google Scholar]
- 3.Abbondanzieri E.A., Greenleaf W.J., Shaevitz J.W., Landick R., Block S.M. Direct observation of basepair stepping by RNA polymerase. Nature. 2005;438:460–465. doi: 10.1038/nature04268. [DOI] [PMC free article] [PubMed] [Google Scholar]
- 4.Moffitt J.R., Chemla Y.R., Izhaky D., Bustamante C. Differential detection of dual traps improves the spatial resolution of optical tweezers. Proc. Natl. Acad. Sci. USA. 2006;103:9006–9011. doi: 10.1073/pnas.0603342103. [DOI] [PMC free article] [PubMed] [Google Scholar]
- 5.Svoboda K., Block S.M. Force and velocity measured for single kinesin molecules. Cell. 1994;77:773–784. doi: 10.1016/0092-8674(94)90060-4. [DOI] [PubMed] [Google Scholar]
- 6.Kerssemakers J.W., Munteanu E.L., Laan L., Noetzel T.L., Janson M.E. Assembly dynamics of microtubules at molecular resolution. Nature. 2006;442:709–712. doi: 10.1038/nature04928. [DOI] [PubMed] [Google Scholar]
- 7.Yin H., Wang M.D., Svoboda K., Landick R., Block S.M. Transcription against an applied force. Science. 1995;270:1653–1657. doi: 10.1126/science.270.5242.1653. [DOI] [PubMed] [Google Scholar]
- 8.Liphardt J., Onoa B., Smith S.B., Tinoco I.J., Bustamante C. Reversible unfolding of single RNA molecules by mechanical force. Science. 2001;292:733–737. doi: 10.1126/science.1058498. [DOI] [PubMed] [Google Scholar]
- 9.Brau R.R., Tarsa P.B., Ferrer J.M., Lee P., Lang M.J. Interlaced optical force-fluorescence measurements for single molecule biophysics. Biophys. J. 2006;91:1069–1077. doi: 10.1529/biophysj.106.082602. [DOI] [PMC free article] [PubMed] [Google Scholar]
- 10.Johnson D.S., Bai L., Smith B.Y., Patel S.S., Wang M.D. Single-molecule studies reveal dynamics of DNA unwinding by the ring-shaped T7 helicase. Cell. 2007;129:1299–1309. doi: 10.1016/j.cell.2007.04.038. [DOI] [PMC free article] [PubMed] [Google Scholar]
- 11.Asbury C.L., Gestaut D.R., Powers A.F., Franck A.D., Davis T.N. The Dam1 kinetochore complex harnesses microtubule dynamics to produce force and movement. Proc. Natl. Acad. Sci. USA. 2006;103:9873–9878. doi: 10.1073/pnas.0602249103. [DOI] [PMC free article] [PubMed] [Google Scholar]
- 12.Carter A.R., King G.M., Ulrich T.A., Halsey W., Alchenberger D. Stabilization of an optical microscope to 0.1 nm in three dimensions. Appl. Opt. 2007;46:421–427. doi: 10.1364/ao.46.000421. [DOI] [PubMed] [Google Scholar]
- 13.Nugent-Glandorf L., Perkins T.T. Measuring 0.1-nm motion in 1 ms in an optical microscope with differential back-focal-plane detection. Opt. Lett. 2004;29:2611–2613. doi: 10.1364/ol.29.002611. [DOI] [PubMed] [Google Scholar]
- 14.Svoboda K., Block S.M. Biological applications of optical forces. Annu. Rev. Biophys. Biomol. Struct. 1994;23:247–285. doi: 10.1146/annurev.bb.23.060194.001335. [DOI] [PubMed] [Google Scholar]
- 15.Marko J.F., Siggia E.D. Stretching of DNA. Macromolecules. 1995;28:8759–8770. [Google Scholar]
- 16.Wang M.D., Yin H., Landick R., Gelles J., Block S.M. Stretching DNA with optical tweezers. Biophys. J. 1997;72:1335–1346. doi: 10.1016/S0006-3495(97)78780-0. [DOI] [PMC free article] [PubMed] [Google Scholar]
- 17.Seol Y., Li J., Nelson P.C., Perkins T.T., Betterton M.D. Elasticity of short DNA molecules: theory and experiment for contour lengths of 0.6–7 μm. Biophys. J. 2007;93:4360–4373. doi: 10.1529/biophysj.107.112995. [DOI] [PMC free article] [PubMed] [Google Scholar]
- 18.Carter A.R., King G.M., Perkins T.T. Back-scattered detection provides atomic-scale localization precision, stability, and registration in 3D. Opt. Express. 2007;15:13434–13445. doi: 10.1364/oe.15.013434. [DOI] [PubMed] [Google Scholar]
- 19.Visscher K., Gross S.P., Block S.M. Construction of multiple-beam optical traps with nanometer-resolution position sensing. IEEE J. Sel. Top. Quant. Electr. 1996;2:1066–1076. [Google Scholar]
- 20.Gittes F., Schmidt C.F. Interference model for back-focal-plane displacement detection in optical tweezers. Opt. Lett. 1998;23:7–9. doi: 10.1364/ol.23.000007. [DOI] [PubMed] [Google Scholar]
- 21.Pralle A., Prummer M., Florin E.-L., Stelzer E.H.K., Horber J.K.H. Three-dimensional high-resolution particle tracking for optical tweezers by forward scattered light. Microsc. Res. Tech. 1999;44:378–386. doi: 10.1002/(SICI)1097-0029(19990301)44:5<378::AID-JEMT10>3.0.CO;2-Z. [DOI] [PubMed] [Google Scholar]
- 22.Graeme J.G. McGraw-Hill; Boston, MA: 1995. Photodiode Amplifiers: OP AMP Solutions. [Google Scholar]
- 23.Hobbs P.C.D. Wiley-Interscience; New York, NY: 2000. Building Electro-Optical Systems: Making It All Work. [Google Scholar]
- 24.Franklin G., Powell J.D., Emami-Naeini A. Prentice-Hall; Upper Saddle River, NJ: 2005. Feedback Control of Dynamic Systems. [Google Scholar]
- 25.Kobayashi J., Izumi Y., Kumakura M., Takahashi Y. Stable all-optical formation of Bose-Einstein condensate using pointing-stabilized optical trapping beams. Appl. Phys. B. 2006;83:21–25. [Google Scholar]
- 26.Perkins T.T., Li H.W., Dalal R.V., Gelles J., Block S.M. Forward and reverse motion of single RecBCD molecules on DNA. Biophys. J. 2004;86:1640–1648. doi: 10.1016/S0006-3495(04)74232-0. [DOI] [PMC free article] [PubMed] [Google Scholar]
- 27.Woodside M.T., Anthony P.C., Behnke-Parks W.M., Larizadeh K., Herschlag D. Direct measurement of the full, sequence-dependent folding landscape of a nucleic acid. Science. 2006;314:1001–1004. doi: 10.1126/science.1133601. [DOI] [PMC free article] [PubMed] [Google Scholar]
- 28.Neuman K.C., Block S.M. Optical trapping. Rev. Sci. Instrum. 2004;75:2787–2809. doi: 10.1063/1.1785844. [DOI] [PMC free article] [PubMed] [Google Scholar]
- 29.Li P.T., Collin D., Smith S.B., Bustamante C., Tinoco I., Jr. Probing the mechanical folding kinetics of TAR RNA by hopping, force-jump, and force-ramp methods. Biophys. J. 2006;90:250–260. doi: 10.1529/biophysj.105.068049. [DOI] [PMC free article] [PubMed] [Google Scholar]
- 30.Wallin A.E., Salmi A., Tuma R. Step length measurement—theory and simulation for tethered bead constant-force single molecule assay. Biophys. J. 2007;93:795–805. doi: 10.1529/biophysj.106.097915. [DOI] [PMC free article] [PubMed] [Google Scholar]
- 31.Churnside A.B., King G.M., Carter A.R., Perkins T.T. Improved performance of an ultrastable measurement platform using a field-programmable gate array for real-time deterministic control. Proc. SPIE. 2008;7042:704205. [Google Scholar]
- 32.Greenleaf W.J., Woodside M.T., Abbondanzieri E.A., Block S.M. Passive all-optical force clamp for high-resolution laser trapping. Phys. Rev. Lett. 2005;95:208102. doi: 10.1103/PhysRevLett.95.208102. [DOI] [PMC free article] [PubMed] [Google Scholar]