

Abstract
The quantification of biological interactions is very important in life sciences. Here we report for the first time, to our knowledge, the determination of a biomolecular dissociation constant (KD) in living zebrafish embryos at physiological protein expression levels. For that purpose, we extend the application of single wavelength fluorescence cross-correlation spectroscopy into small organisms and measure the interaction of Cdc42, a small Rho-GTPase, and IQGAP1, an actin-binding scaffolding protein. Cdc42 and IQGAP1 were labeled with monomeric red fluorescent protein and enhanced green fluorescent protein, respectively. Both fluorophores were excited at a single wavelength of 514 nm, simplifying the fluorescence spectroscopy measurements and allowing quantification. For the determination of the interaction, we used two Cdc42 mutants, the constitutively active Cdc42G12V which is in a predominantly GTP-bound form and the dominant-negative GDP-bound Cdc42T17N. While Cdc42G12V binds to IQGAP1 with an apparent KD of ∼100 nM, Cdc42T17N has at least a one-order-of-magnitude lower affinity for the same protein. As a comparison, we measure the same protein-protein interactions in Chinese hamster ovary cell cultures but observe significant differences in protein mobility and KD from the zebrafish measurements, supporting the notion that bimolecular interactions depend on the biological system under investigation and are best performed under physiologically relevant conditions.
Introduction
Since their introduction, petri-dish-based cell cultures have greatly enhanced our understanding of cellular behavior and molecular actions and interactions. The commonly used two-dimensional cell cultures have the advantage of easy genetic manipulation and direct accessibility to biochemical and biophysical analysis. However, two-dimensional cell cultures cannot fully reflect the natural environment of cells present in living organisms. The flat glass substrate and the artificial medium buffer are significantly different from a real physiological environment. It has been shown that even genetically normal primary cells placed in cell cultures quickly lose their differentiated gene expression pattern and phenotype (1). Three-dimensional cultures are a partial solution to the problem (2). However, culture systems do not represent a living organism and questions of developmental biology are difficult to address in these models. Thus, it is desirable to extend noninvasive spectroscopic measurements into optically accessible small living organisms, e.g., nematodes (Caenorhabditis elegans), fruit flies (Drosophila melanogaster), and zebrafish (Danio rerio) to gather physiologically relevant data. In this work, we used zebrafish as a model for single wavelength fluorescence cross-correlation spectroscopy (SW-FCCS) measurements. Zebrafish is a vertebrate model amenable to methods of cell biology (3). The embryos and early larvae are semitransparent, so that conventional light microscopic techniques can be directly applied to study cells deep within tissue. The external fertilization and rapid development simplified the sample handling and most genetic and molecular approaches have been established.
Recently, we have developed SW-FCCS (4,5), an extension of fluorescence cross-correlation spectroscopy (FCCS). In FCCS, two distinctly fluorescently labeled molecules are excited by different lasers and detected separately by different detectors (6–8). By comparing the signal intensities between the two detectors in time via cross-correlation, one can determine whether molecules move together in time and interact. The measurable parameters of this method are the concentration of the differently labeled particles (free and bound particles) and their diffusion coefficient, and thus their molecular size. This method is advantageous compared to fluorescence energy transfer, since it does not pose any restrictions on the orientation or distance between the fluorescent labels and is thus applicable to a wider range of interaction partners (9). SW-FCCS uses one instead of two lasers to excite the different fluorophores by one-photon excitation and thus simplifies alignment and reduces problems of spherical aberration, which can be significant in tissues. Since aberration is wavelength- and tissue-depth-dependent, a two-laser approach results in significant changes in the overlap of the excitation volumes making quantification difficult (10). By using a single-wavelength excitation this problem is avoided, which makes quantification simpler. SW-FCCS requires the use of fluorophores with overlapping excitation spectra but sufficiently different Stokes shifts, to separate their emission. New fluorescent proteins (FPs) for this purpose have been developed (11) and we have recently shown that even by using enhanced green fluorescent protein (EGFP) and monomeric red fluorescent protein (mRFP) as a fluorophore pair, the dimerization percentages of the epidermal growth factor receptor could be quantified (12).
Here we investigated the interaction between Cdc42 (cell division cycle 42) and IQGAP1 (IQ motif containing GTPase activating protein 1). Cdc42, a small GTPase that belongs to the Rho/Rac subfamily, regulates various cellular responses including the assembly and disassembly of the actin cytoskeleton. It interacts with >20 target proteins identified to date, among them IQGAP1 (13,14), a multidomain scaffolding protein that modulates cross talk among diverse pathways. The interaction of IQGAP1 and Cdc42 plays an important role in modeling microtubule and cytoskeleton during cell polarization and migration (15). Using SW-FCCS, we show here that this interaction can be directly quantified in living zebrafish embryos.
Materials and Methods
Theory of SW-FCCS
In SW-FCCS, the fluorophores are observed in a small observation volume defined by a focused laser beam and its confocal pinhole. From this observation volume, fluorescence fluctuations will be observed since biomolecules will undergo Brownian motion within cells or organisms. It is these fluctuations that contain information about the number of molecules and their mobility, i.e., their concentration and diffusion coefficient. This information is extracted by autocorrelation analysis, one for each channel, which yields information about the concentration and the diffusion coefficient of the different biomolecules, while the cross-correlation is a measure of the concentration and the diffusion coefficient of the complexes formed by the two biomolecules. With the knowledge of the concentration of the biomolecules as well as the concentration of the complexes, one can determine stoichiometries of binding and dissociation constants.
The normalized autocorrelation function (ACF) is given by (16)
| (1) |
where 〈…〉 denotes time average and F(t) is fluorescence intensity at time t.
The normalized cross-correlation function (CCF) is defined as
| (2) |
where the subscripts i and j denote the signals from the two detection channels that record the signals from the different fluorescent labels. Experimental ACF and CCF curves are fitted using predetermined mathematical models describing the process under investigation, here diffusion. For a molecular species that diffuses freely in three dimensions, the theoretical correlation function is given by
| (3) |
in which
| (4) |
where N is the number of particles in the confocal volume; τD is the average time required by a fluorescent molecule to diffuse through the confocal volume; and ω0 and ωz are the radial and axial distances where the excitation intensity reaches 1/e2 of its value from the center of the confocal volume. G∞ is the convergence value of the ACF for long times. For all measurements, G∞ is close to the expected value of 1. D is the diffusion coefficient of the fluorescent molecule, which is related to its size (in the case of spherical particles, this relation is given by the Stokes-Einstein equation). By measuring the diffusion time, one can determined whether a fluorescent particle has changed its diffusion coefficient because of binding, assuming the mass change during binding is sufficiently large (17). In SW-FCCS, one can use this relation to determine whether two particles, with diffusion coefficients D1 and D2, have formed a complex and now exhibit a smaller diffusion coefficient D3 common to both ACFs and the CCF.
If the fluorescent molecule possesses a significant triplet state, the correlation function has to be extended to account for the extra fluctuations,
| (5) |
where Ftrip is the fraction of the particles that have entered the triplet state; and τtrip is the triplet state relaxation time.
Assuming a 1:1 binding stoichiometry, the amplitude of the ACFs and CCF obtained from fitting the experimental curves with the theoretical models can then be expressed as a function of the count rate per particle per second (cps) and the concentrations of the particles involved (5,12),
| (6) |
| (7) |
| (8) |
where Gg(0) and Gr(0) are the amplitudes of the ACF in the green (EGFP) and red (mRFP) channel, respectively, and Gx(0) is the amplitude of the CCF; Cg, Cr, and Cgr are the concentrations of the free green, free red, and the complex particles, respectively; βg and βr are the uncorrelated background count rate in the green and red channels, respectively; and are the cps of green- and red-labeled particles in the green channel, respectively; and and are the cps of green- and red-labeled particles in the red channel, respectively. The values qg and qr are correction factors that account for changes in fluorescence yields upon binding via processes such as quenching or fluorescence energy transfer for the green and red particles, respectively; NA is the Avogadro's number; and Veff is the effective observation volume and can be obtained from (6)
| (9) |
When the amplitudes of the correlation curves, cps, background intensities, and correction factors are obtained from experiments, Eqs. 6–8 can be solved for the values of Cg, Cr, and Cgr.
Binding quantification
The relative expression levels between the green- and red-tagged proteins are difficult to control precisely. Hence, we decided to express the percentage of bound molecules as a function of the total concentration of either the total green or total red molecules as defined,
or
| (10) |
For example, in a measurement where the green-tagged molecules are less than the red-tagged molecules, the first form will be used, and vice versa since the molecule of lower concentration limits the number of possible complexes. In our measurements, we try to pick cells with expression levels that differ by not more than a factor of 2 for both proteins. When a significant difference in the complex percentage is observed between the experiment and a negative control, interaction is present. The value of this complex percentage gives a general idea of the strength of interaction of the molecules when compared with a positive control of tandem mRFP-EGFP, which gives the upper limit of the complex percentage. A better and more exact measure is the KD defined as
| (11) |
When Cg × Cr is plotted against Cgr, a linear fit to the scatter plot gives a line with a slope of KD (KD × Cgr = Cg × Cr).
Instrumentation
A commercial laser-scanning confocal microscope FV300 (Olympus, Tokyo, Japan) was modified and combined with a custom-built FCCS attachment. Both EGFP and mRFP were excited using an argon ion 514-nm laser line (Melles Griot, Albuquerque, NM) controlled by an acousto-optic tunable filter. The excitation light was reflected by an excitation dichroic mirror (458/514) onto a pair of galvanometer scanning mirrors and focused to a small focal volume in the sample by a water-immersion objective (60×, NA 1.2; Olympus). The laser power of 15 μW and 30 μW were used for the Chinese hamster ovary (CHO) cells and zebrafish embryo measurements, respectively. The emitted fluorescence light was imaged over a 3× magnification stage onto a 150-μm pinhole. A custom-built slider then allowed one to direct the light to either the FV300 photomultipliers for imaging, or to two avalanche photodiodes (SPCM-AQR-14-FC; Pacer, Berkshire, UK) for FCCS analysis. The use of a single pinhole for both imaging and spectroscopy guaranteed the accurate positioning of the fluorescence correlation spectroscopy (FCS) observation volume in the sample after confocal image acquisition (18). In the FCS mode, a 560DCLP dichroic mirror (Omega Optical, Brattleboro, VT) split the fluorescence into two detection channels. An achromatic lens (f = 60 mm; Thorlabs, Newton, NJ) focused the fluorescence through band-pass filters, 545AF35 and 615DF45 (Omega Optical) in the green and red channels, respectively, onto optical-fiber-coupled avalanche-photodiode detectors. Autocorrelations and cross-correlations were computed online by a hardware correlator (Flex02-01D; Correlator.com, Bridgewater, NJ). Curve fitting was performed by a self-written program in Igor Pro 6.0 (WaveMetrics, Lake Oswego, OR). Autocorrelation curves were fitted using Eq. 5. Cross-correlation curves were fitted using Eq. 3. Concentrations were calculated (Eqs. 6–8) by a self-written program in Mathematica 6 (Wolfram Research, Champaign, IL).
Plasmids
A constitutively active mutant Cdc42G12V and a dominant-negative mutant Cdc42T17N of Cdc42 was subcloned into an mRFP1-pXJ40 vector at the C-terminal of mRFP1 between the BamHI and NotI sites. The pEGFP-C2-IQGAP1 vector was a gift from Prof. Kozo Kaibuchi (Nagoya University Graduate School of Medicine, Nagoya, Japan). The EGFP from a pEGFP-C3 vector (Clontech, Mountain View, CA) was subcloned into the mRFP1-pXJ40 vector at the C-terminus of mRFP1 between the BamHI and NotI sites bridged by a seven-amino-acid linker (-GSRMGTG-) to form the positive control.
Zebrafish embryo preparation
Zebrafish were maintained according to the Zebrafish Book (19) and IACUC regulations. The 1-cell stage wild-type AB embryos were dechorionated and transferred to the molded agarose injection holder in a petri dish. The embryos were allowed to develop to the 16-cell stage. One-hundred picoliters of designated DNA plasmid (100 ng/μL) was injected into one of the four central blastomeres. The embryos were then incubated in egg water at 28.5°C for optimal development. PTU (0.003% 1-phenyl-2-thiourea in 10% Hanks' saline; Invitrogen, Carlsbad, CA) was added to egg water at 24 h postfertilization (hpf) to prevent pigmentation. Fluorescence expression was examined at 48 hpf under an ultraviolet dissecting microscope and embryos with normal development and proper fluorescence expression were selected. Selected embryos were anesthetized by Tricaine ethyl-3-aminobenzoate (Sigma-Aldrich, St. Louis, MO) and mounted into 0.5% low-melting-temperature agarose (Invitrogen) in a glass-bottom petri dish (GW-3512; WillCo-Wells, Amsterdam, The Netherlands). After the agarose set, the specimens were viewed under the fluorescence correlation microscope (18). Muscle fiber cells with low fluorescence intensity were chosen for analysis. A single spot was positioned on the cytoplasm of the muscle fiber cell based on the confocal image. Point excitation was performed and the system was switched to FCS measurements. Each measurement took 30 s and all measurements were performed at room temperature.
CHO cell preparation
CHO-K1 cells were obtained from the ATCC (Manassas, VA) and cultured in F-12K Kaighn's modification medium (Invitrogen) containing 10% fetal bovine serum and 1% penicillin, and streptomycin at 37°C in 5% CO2 humidified atmosphere. Five micrograms of plasmid DNA was added to cells (∼1 × 10⁶) suspended in 200 μL serum free culture medium and electroporated using the preprogrammed protocol for CHO cells (Gene Pulser Xcell; Bio-Rad, Hercules, CA). The cells were then seeded onto glass slides (30 mm in diameter; Lakeside, Monee, IL) and grown in the culture medium for 24–36 h. Cells were washed and measured in phosphate-buffered saline in a POC minichamber (Carl Zeiss, Jena, Germany).
Result and Discussion
Gene expression in living zebrafish embryo
A microinjection of DNA plasmid is required to introduce the foreign genes into the zebrafish embryos. In this work, a controlled amount of DNA plasmid was microinjected into one blastomere at 16-cell stage. The fate map of each blastomere at 16-cell stage is available (20) and it provides a general guideline when protein is expressed in different cell types. Microinjection at 16-cell stage also reduces the number of cells that express the foreign genes which could be cytotoxic to the embryos. In our case, muscle fiber cells were chosen for SW-FCCS measurements as they are abundant within the embryo and are easy to identify. The mosaic expression pattern of injected plasmid in the embryo body provides cells with different protein expression level to choose from. Based on confocal images, muscle fiber cells that express injected plasmids at physiological level (nanomolar range) were selected for SW-FCCS measurements. Compared to cell culture, gene expression in zebrafish embryo requires more manual work. However, each successfully microinjected embryo provides dozens to hundreds of cells for observation. No CO2 incubator is required and each cell is maintained in a genuine physiological environment as long as the embryo is alive. In addition, DNA delivery in zebrafish embryo using electroporation has been developed (21), so that protein activity can be directly studied at specific embryonic stage while leaving earlier functions intact. Thus, zebrafish is well suited for cell-biological-based protein dynamic study and it provides a platform to investigate a wider spectrum of biological questions.
Calibration
To quantify concentrations from SW-FCCS measurements, the count rate per particle per second (cps) of fluorophores in difference channels (, , , and see Materials and Methods for detail), background intensities (βg and βr), correction factors (qg and qr), and effective volume (Veff) need to be determined. The cps of EGFP tagged particles in green and red channels, and , was obtained from the division of the average intensity counts in each channel with the number of EGFP-tagged particles obtained from curve fitting. This was done in experiments with only EGFP-tagged protein. The measured cps was corrected for background as it affects the actual number of particles (22). Similarly, and was determined in experiments with only mRFP-tagged protein. The individual cps is an average of at least 20 measurements of such experiments. Depending on different fusion proteins, and ranges 1500–2000 in CHO cells and 800–1500 in zebrafish embryos. The EGFP cross talk is ∼9–11% of and the mRFP cross talk is ∼1–2% of , for both CHO cell and zebrafish embryos. Average background intensity in both channels in cells and embryos are recorded in experiments without transfection/microinjection. In our positive control of tandem mRFP-EGFP experiment (see Controls below for detail), was noticeably lower and higher than EGFP or mRFP alone. We attribute this to fluorescence energy transfer and hence correction factors of qg = 0.7, qr = 1.3 were used for the positive control. In other binding experiments, we do not see such changes in cps and hence qg and qr = 1 were used. Determination of Veff can be achieved via FCS measurement and fit of a fluorophore with known diffusion coefficient (Eqs. 3–5 and 9) (23). Rhodamine 6G (R6G) with a diffusion coefficient of 426 μm2/s, as reported in recent literature (24), was used. For a 514-nm laser line excitation, the Veff was determined to be 0.56 ± 0.06 fL.
10 nM R6G was also used to calibrate the SW-FCCS system. Fig. 1 a shows the ACFs of R6G in the green channel and its crosstalk in the red channel when excited by the 514-nm line. The CCF from the two channels reaches a maximum and lies between the green and red ACFs. A 100% overlap between the three correlation functions is not achieved due to the different molecular brightness, background, and detection volumes in the green and red channels.
Figure 1.

SW-FCCS results of calibration and controls. (a) SW-FCCS result of 10 nM Rhodamine 6G showing both experimental curves (dashed line) and fitting curves (solid line). (b and c) SW-FCCS results of negative (individually expressed mRFP and EGFP) and positive (mRFP-EGFP tandem construct) controls. The insets are schematic drawings and confocal images of the muscle fiber cells that show both green and red channels. ACF, autocorrelation function; CCF, cross-correlation function. Scale bars = 20 μm.
Controls
Positive and negative controls were tested first in embryos. As a negative control, we injected premixed EGFP and mRFP plasmids into one blastomere at 16-cell stage. The level of green and red fluorescence was recorded in various cell types at 48 hpf. SW-FCCS measurements were performed in selected muscle fiber cells that express both EGFP and mRFP at a similar level. The results show a flat CCF (Fig. 1 b), indicating a lack of interaction between individually expressed EGFP and mRFP molecules. The complex percentage obtained for the negative control is 6.2 ± 4.8%. This value is not 0% due to the autofluorescence background producing false-positive cross-correlation amplitudes and this sets a lower limit for the negative control. As a positive control, we injected an mRFP-EGFP tandem construct in which mRFP and EGFP are linked by a seven-amino-acids linker. The SW-FCCS results show elevated CCF amplitudes, indicating the correlated movement of mRFP-EGFP (Fig. 1 c). The complex percentage obtained for positive control is 44.9 ± 5.9%. This value is much lower compared to the R6G calibration result. One of the reasons is that some of the FPs are nonfluorescent. Hillesheim et al. (25) showed that ∼60% of the mRFP can reside in a dark state using a dual-color photon-counting histogram and life-time measurements. Maeder et al. (26) also indicated that ∼50% of mCherry is nonmaturated during their experiment and mRFP may suffer from similar effects. In addition, photobleaching of FPs (especially mRFP) may also lead to a decrease in complex percentage of the positive control. Thus, the complex percentage of 44.9 ± 5.9% sets the upper limit for the EGFP and mRFP pair under the presented conditions. Similar values for tandem FPs have been reported by others (27–30).
Interaction of IQGAP1 and Cdc42G12V
We first examined the protein pair of IQGAP1 and Cdc42G12V, a constitutively active mutant that has been shown to bind to IQGAP1 (14). The G12V mutant inhibits the hydrolysis of GTP, hence locking the protein in the active form (31). The EGFP and mRFP genes were attached to IQGAP1 and Cdc42G12V DNA, respectively, and constructed plasmids were coinjected at 16-cell stage. The plasmid injection amount was controlled and muscle fiber cells that express both EGFP-IQGAP1 and mRFP-Cdc42G12V at physiological level (nanomolar range) were selected for SW-FCCS measurements. From the SW-FCCS curves (Fig. 2 a), it is obvious that the two proteins form complexes, as shown by the elevated CCF amplitude, and the complex percentage calculated is 41.6 ± 9.2%. This value is very close to the positive control, indicating that the Cdc42G12V binds strongly to IQGAP1.
Figure 2.
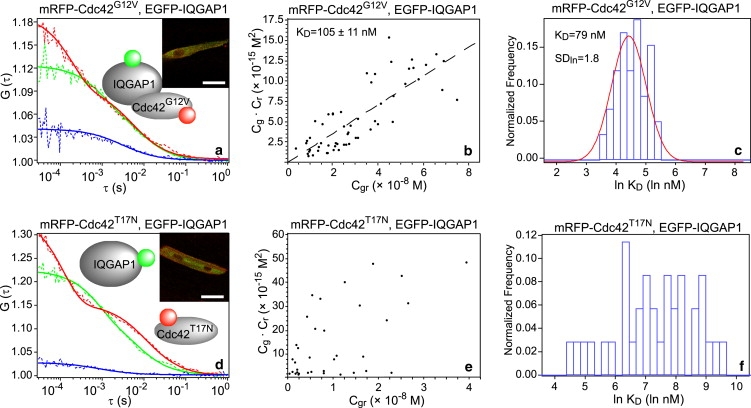
Interactions of IQGAP1 with Cdc42G12V and Cdc42T17N in zebrafish embryos. (a) SW-FCCS result of the protein pair of mRFP-Cdc42G12V and EGFP-IQGAP1. The insets are schematic drawing and confocal images of the muscle fiber cell that shows both green and red channels. (b and c) KD determination results using scattering plot and log normal distribution histogram. (d–f) Corresponding results for the protein pair of mRFP-Cdc42T17N and EGFP-IQGAP1. SDln, standard deviation factor of log-normal distribution. Scale bars, 20 μm.
The relative proportion of molecules forming a complex depends greatly on the relative expression levels of the two fusion proteins and their dissociation constant KD. The concentrations of both bound (Cgr) and free (Cg for EGFP-IQGAP1 and Cr for mRFP-Cdc42G12V) proteins can be calculated from the ACF and CCF functions (see Materials and Methods). A scattering plot of the product Cg × Cr against Cgr was generated (Fig. 2 b) and the KD value determined is 105 ± 11 nM, suggesting a strong interaction. It should be noted that this value is an apparent KD since endogenous proteins, FPs in dark states, FPs photobleaching, and interactions with other cellular proteins can influence concentration of the detected complexes. Nevertheless, the apparent KD value is a useful measure since it reflects more closely the actual binding between proteins in their physiological environment.
Recently, Maeder et al. have shown that apparent KD measurements are possible by FCCS in yeast cells using an alternative evaluation scheme (26). The individual KD values of each measurement were plotted in a histogram and fitted to a log-normal distribution (Fig. 2 c). The log-normal distribution has been suggested to extract more reliably data for skewed normal distributions, often found in biological samples, when mean values are low, variance is large, and values are restricted to positive numbers. The KD obtained using this method is 79 nM, in good agreement with results above. Thus we suggest that the apparent KD for the interaction of Cdc42G12V and IQGAP1 in muscle fiber cells of living zebrafish embryo is ∼100 nM. This value is reasonable compared to another in vitro measurement, where 24 nM was obtained from the interaction of Cdc42Q61L, also considered as an active form, with the C-terminal half of IQGAP1 (32).
Interaction of Cdc42T17N and IQGAP1
We next examined the protein pair of IQGAP1 and Cdc42T17N (Fig. 2 d). Cdc42T17N, a frequently used dominant-negative mutant, has been shown to have no interaction with IQGAP1 using in vitro methods (33). In our measurement of mRFP-Cdc42T17N with EGFP-IQGAP1 in zebrafish embryos, approximately one-third of the measurements show some degree of cross-correlation and the portion of molecules forming a complex was 12.6 ± 12.3% in this subpopulation. Based on this one-third of measurements, KD determination using a line plot and the log-normal distribution histogram were performed as shown in Fig. 2, e and f. However, there is generally no correlation for the line plot and the histogram suggests a random distribution. The line plot and histogram were force-fitted and the KD value determined is 1500 nM, indicating very weak interaction. Considering the large standard deviation of the complex percentage value and that interactions could be seen only in approximately one-third of the measurements, we suggest that Cdc42T17N does not bind to IQGAP1 or binds very weakly. The distinct mobility of mRFP-Cdc42T17N and EGFP-IQGAP1 (Fig. 2 d and Table 1) also indicates that the majority of the two proteins diffuse separately, which is in contrast to the similar diffusion times found for the interacting pair of mRFP-Cdc42G12V and EGFP-IQGAP1. Interestingly, the small size mRFP-Cdc42T17N (∼55 kDa) diffuses more slowly in the cytoplasm than EGFP-IQGAP1 (∼220 kDa), which suggests that the dominant-negative Cdc42T17N interacts and forms complexes with other proteins. One possible target are guanine nucleotide exchange factors, which bind strongly to GDP-bound Cdc42 but have low binding affinity to GTP-bound Cdc42 (34).
Table 1.
Data obtained from muscle fiber cells in embryo and CHO cell
| Sample | Muscle fiber cell in embryo |
CHO cell |
||||
|---|---|---|---|---|---|---|
| τD ± SD (ms) | Complex ± SD [%] | Sample size∗ | τD ± SD (ms) | Complex ± SD (%) | Sample size | |
| EGFP | G: 0.72 ± 0.21 | 6.2 ± 4.8 | 34 | G: 0.50 ± 0.11 | 3.5 ± 2.8 | 29 |
| mRFP | R: 0.99 ± 0.24 | R: 0.65 ± 0.25 | ||||
| mRFP-EGFP | G: 0.96 ± 0.15 | 44.9 ± 5.9 | 58 | G: 0.64 ± 0.07 | 45.4 ± 4.8 | 28 |
| R: 1.11 ± 0.21 | R: 0.75 ± 0.13 | |||||
| EGFP-IQGAP1 | G: 7.0 ± 3.1 | 41.6 ± 9.2 | 62 | G: 2.3 ± 0.8 | 12.2 ± 6.8 | 75 |
| mRFP-Cdc42G12V | R: 10.2 ± 5.4 | R: 2.6 ± 0.8 | ||||
| EGFP-IQGAP1 | G: 7.4 ± 2.9 | 12.6 ± 12.3 | 35† | G: 3.44 ± 1.76 | 8.7 ± 4.7 | 81 |
| mRFP-Cdc42T17N | R: 21.1 ± 8.0 | R: 17.07 ± 9.69 | ||||
Each number represents a single measurement from one muscle fiber cell and generally 3–5 fibers were chosen from one embryo.
Number of measurements that exhibit some degree of cross-correlation. The corresponding complex percentage value is the average of these 35 measurements while another 78 measurements show no cross-correlation.
The dominant-negative T17N mutation in Cdc42 is in analogy to the S17N mutation (35) of H-Ras, a Ras-GTPase. In H-Ras, it has been shown that the S17N mutation decreased the affinity for GTP 20–40-fold without significantly affecting its affinity for GDP (36). Hence, the mutant binds preferably to GDP causing it to be in an inactive state. H-RasS17N is still able to bind GTP; however, the GTP-bound form fails to activate a model downstream target (37). The same is assumed to be true for Cdc42T17N. Furthermore, it has been shown that IQGAP1 increases the amount of GTP-bound Cdc42 in mammalian cells and results in filopodia formation (38). Thus, the possible weak interaction observed between IQGAP1 and Cdc42T17N might be due to the subpopulation of GTP-bound Cdc42T17N being stabilized by IQGAP1.
IQGAP1 interacts weakly with Cdc42G12V in CHO cells
The above-mentioned measurements were also performed in CHO cells as comparison (Fig. 3). The negative control, positive control, and the dominant-negative measurements gave comparable results (Table 1). However, the KD value (1000 nM) for the interaction of IQGAP1 and Cdc42G12V is much higher in CHO cells and the portion of molecules forming a complex was considerably lower (12.2 ± 6.8%), suggesting that even the constitutively active Cdc42G12V interacts weakly with IQGAP1 in CHO cells. The faster diffusion of the protein complex in CHO cells compared to that in embryos also implies that other effectors could be involved in these interactions in embryos but not in CHO cells. One possible explanation is the Ca2+-concentration-dependent interactions of IQGAP1 with Cdc42 and other effectors such as F-actin. Several reports have shown that binding of Ca2+/calmodulin to IQGAP1 will promote the dissociation of IQGAP1 from both Cdc42 and F-actin (39,40). However, this idea needs to be verified experimentally.
Figure 3.
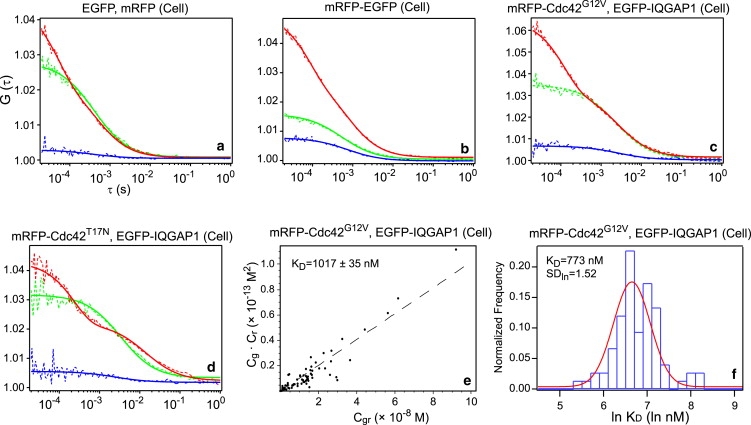
Measurements in CHO cell cultures. (a–d) SW-FCCS results of each corresponding samples. (e and f) KD determination results using scattering plot and log-normal distribution histogram.
It should be noted that SW-FCCS measurements in zebrafish embryos were performed 10–50 μm deep into the body tissue. Compared to CHO cells measurements, the deeper penetration results in an enlarged effective volume Veff. Consequently, the EGFP, mRFP, and mRFP-EGFP measurements in embryo all possess longer diffusion times than in CHO cell (Table 1). The enlarged Veff will result in an overestimation of concentrations of all particles. This will change the measured apparent KD values by the same factor as the Veff (Eq. 11), but will not affect the complex percentage values (Eq. 10). In addition, the distortion of the effective volume is also wavelength-dependent, and the enlargement of Veff in the red channel could be slightly higher than that in the green channel, which leads to a further overestimation of KD in the embryo. Taking these factors into consideration, the calculated KD value of ∼100 nM is an upper limit and the actual affinity is possibly stronger (i.e., the KD value is possibly lower), and the difference between CHO cells and zebrafish embryos could be an underestimation in our measurements.
Conclusion
The quantification of biomolecular interactions, at present, is mostly performed in vitro. In the last years, it became apparent, though, that biomolecular interactions are strongly dependent on their environment, the conditions of molecular crowding (41), concentration of reactants (42), and the three-dimensional organization of cells in which measurements are taken. The quantitative determination of interactions is important in many fields of life sciences. It has implications for drug discovery because the direct study of interactions of potential drug molecules with their targets in a relevant environment, e.g., a living organisms, could lead to better prediction of drug efficacy and shorten the drug development process. In addition in system biology, there is a need for a better understanding of biological interactions under physiological conditions and to obtain physiologically relevant data for the simulation of biological networks. It therefore became increasingly important to quantify biological parameters, in particular biological interactions, in their natural environment within multicellular organisms. Here we demonstrate for the first time the measurement of dissociation constants of interacting proteins in living zebrafish embryos, using SW-FCCS. Furthermore, a substantial difference was detected between the level of these interactions in CHO cells and muscle fiber cells within the embryos. In the future, we expect that new labeling strategies, and better fluorescent proteins with larger Stokes shifts, reduced dark states, and higher photostability will improve the technique considerably by providing a wider dynamic range for the measurements of interactions by SW-FCCS.
Acknowledgments
The authors thank the Institute of Molecular and Cell Biology Zebrafish Facility and the Institute of Molecular and Cell Biology DNA Sequencing Facility for technical assistance and Prof. Kozo Kaibuchi for the EGFP-IQGAP1 construct.
X.S. and Y.H.F. received scholarships from the National University of Singapore. T.W. gratefully acknowledges funding by the Singapore Bioimaging Consortium and Biomedical Research Council (grants Nos. R-143-000-284-305 and R-143-000-351-305). V.K. and S.A. were supported by the Agency for Science, Technology and Research of Singapore.
Footnotes
Xianke Shi and Yong Hwee Foo contributed equally to this work.
References
- 1.Mooney D., Hansen L., Vacanti J., Langer R., Farmer S. Switching from differentiation to growth in hepatocytes: control by extracellular matrix. J. Cell. Physiol. 1992;151:497–505. doi: 10.1002/jcp.1041510308. [DOI] [PubMed] [Google Scholar]
- 2.Lee J., Cuddihy M.J., Kotov N.A. Three-dimensional cell culture matrices: state of the art. Tissue Eng. B Rev. 2008;14:61–86. doi: 10.1089/teb.2007.0150. [DOI] [PubMed] [Google Scholar]
- 3.Beis D., Stainier D.Y. In vivo cell biology: following the zebrafish trend. Trends Cell Biol. 2006;16:105–112. doi: 10.1016/j.tcb.2005.12.001. [DOI] [PubMed] [Google Scholar]
- 4.Hwang L.C., Wohland T. Dual-color fluorescence cross-correlation spectroscopy using single laser wavelength excitation. Chem. Phys. Chem. 2004;5:549–551. doi: 10.1002/cphc.200301057. [DOI] [PubMed] [Google Scholar]
- 5.Hwang L.C., Wohland T. Single wavelength excitation fluorescence cross-correlation spectroscopy with spectrally similar fluorophores: resolution for binding studies. J. Chem. Phys. 2005;122:114708. doi: 10.1063/1.1862614. [DOI] [PubMed] [Google Scholar]
- 6.Schwille P., Meyer-Almes F.J., Rigler R. Dual-color fluorescence cross-correlation spectroscopy for multicomponent diffusional analysis in solution. Biophys. J. 1997;72:1878–1886. doi: 10.1016/S0006-3495(97)78833-7. [DOI] [PMC free article] [PubMed] [Google Scholar]
- 7.Haustein E., Schwille P. Fluorescence correlation spectroscopy: novel variations of an established technique. Annu. Rev. Biophys. Biomol. Struct. 2007;36:151–169. doi: 10.1146/annurev.biophys.36.040306.132612. [DOI] [PubMed] [Google Scholar]
- 8.Bacia K., Kim S.A., Schwille P. Fluorescence cross-correlation spectroscopy in living cells. Nat. Methods. 2006;3:83–89. doi: 10.1038/nmeth822. [DOI] [PubMed] [Google Scholar]
- 9.Liu P., Ahmed S., Wohland T. The F-techniques: advances in receptor protein studies. Trends Endocrinol. Metab. 2008;19:181–190. doi: 10.1016/j.tem.2008.02.004. [DOI] [PubMed] [Google Scholar]
- 10.Weidemann T., Wachsmuth M., Tewes M., Rippe K., Langowski J. Analysis of ligand binding by two-color fluorescence cross-correlation spectroscopy. Single Mol. 2002;3:49–61. [Google Scholar]
- 11.Kogure T., Karasawa S., Araki T., Saito K., Kinjo M. A fluorescent variant of a protein from the stony coral Montipora facilitates dual-color single-laser fluorescence cross-correlation spectroscopy. Nat. Biotechnol. 2006;24:577–581. doi: 10.1038/nbt1207. [DOI] [PubMed] [Google Scholar]
- 12.Liu P., Sudhaharan T., Koh R.M., Hwang L.C., Ahmed S. Investigation of the dimerization of proteins from the epidermal growth factor receptor family by single wavelength fluorescence cross-correlation spectroscopy. Biophys. J. 2007;93:684–698. doi: 10.1529/biophysj.106.102087. [DOI] [PMC free article] [PubMed] [Google Scholar]
- 13.Hart M.J., Callow M.G., Souza B., Polakis P. IQGAP1, a calmodulin-binding protein with a rasGAP-related domain, is a potential effector for cdc42Hs. EMBO J. 1996;15:2997–3005. [PMC free article] [PubMed] [Google Scholar]
- 14.Kuroda S., Fukata M., Kobayashi K., Nakafuku M., Nomura N. Identification of IQGAP as a putative target for the small GTPases, Cdc42 and Rac1. J. Biol. Chem. 1996;271:23363–23367. doi: 10.1074/jbc.271.38.23363. [DOI] [PubMed] [Google Scholar]
- 15.Watanabe T., Wang S., Noritake J., Sato K., Fukata M. Interaction with IQGAP1 links APC to Rac1, Cdc42, and actin filaments during cell polarization and migration. Dev. Cell. 2004;7:871–883. doi: 10.1016/j.devcel.2004.10.017. [DOI] [PubMed] [Google Scholar]
- 16.Magde D., Elson E., Webb W.W. Thermodynamic fluctuations in a reacting system-measurement by fluorescence correlation spectroscopy. Phys. Rev. Lett. 1972;29:705–708. [Google Scholar]
- 17.Meseth U., Wohland T., Rigler R., Vogel H. Resolution of fluorescence correlation measurements. Biophys. J. 1999;76:1619–1631. doi: 10.1016/S0006-3495(99)77321-2. [DOI] [PMC free article] [PubMed] [Google Scholar]
- 18.Pan X., Foo W., Lim W., Fok M.H., Liu P. Multifunctional fluorescence correlation microscope for intracellular and microfluidic measurements. Rev. Sci. Instrum. 2007;78:053711. doi: 10.1063/1.2740053. [DOI] [PubMed] [Google Scholar]
- 19.Westerfield M. University of Oregon Press; Eugene, OR: 2000. The Zebrafish Book. A Guide for the Laboratory Use of Zebrafish (Danio rerio) [Google Scholar]
- 20.Strehlow D., Heinrich G., Gilbert W. The fates of the blastomeres of the 16-cell zebrafish embryo. Development. 1994;120:1791–1798. doi: 10.1242/dev.120.7.1791. [DOI] [PubMed] [Google Scholar]
- 21.Teh C., Chong S.W., Korzh V. DNA delivery into anterior neural tube of zebrafish embryos by electroporation. Biotechniques. 2003;35:950–954. doi: 10.2144/03355st02. [DOI] [PubMed] [Google Scholar]
- 22.Schwille P., Haupts U., Maiti S., Webb W.W. Molecular dynamics in living cells observed by fluorescence correlation spectroscopy with one- and two-photon excitation. Biophys. J. 1999;77:2251–2265. doi: 10.1016/S0006-3495(99)77065-7. [DOI] [PMC free article] [PubMed] [Google Scholar]
- 23.Ruttinger S., Buschmann V., Kramer B., Erdmann R., Macdonald R. Comparison and accuracy of methods to determine the confocal volume for quantitative fluorescence correlation spectroscopy. J. Microsc. 2008;232:343–352. doi: 10.1111/j.1365-2818.2008.02105.x. [DOI] [PubMed] [Google Scholar]
- 24.Petrasek Z., Schwille P. Precise measurement of diffusion coefficients using scanning fluorescence correlation spectroscopy. Biophys. J. 2008;94:1437–1448. doi: 10.1529/biophysj.107.108811. [DOI] [PMC free article] [PubMed] [Google Scholar]
- 25.Hillesheim L.N., Chen Y., Muller J.D. Dual-color photon counting histogram analysis of mRFP1 and EGFP in living cells. Biophys. J. 2006;91:4273–4284. doi: 10.1529/biophysj.106.085845. [DOI] [PMC free article] [PubMed] [Google Scholar]
- 26.Maeder C.I., Hink M.A., Kinkhabwala A., Mayr R., Bastiaens P.I. Spatial regulation of Fus3 MAP kinase activity through a reaction-diffusion mechanism in yeast pheromone signaling. Nat. Cell Biol. 2007;9:1319–1326. doi: 10.1038/ncb1652. [DOI] [PubMed] [Google Scholar]
- 27.Baudendistel N., Muller G., Waldeck W., Angel P., Langowski J. Two-hybrid fluorescence cross-correlation spectroscopy detects protein-protein interactions in vivo. Chem. Phys. Chem. 2005;6:984–990. doi: 10.1002/cphc.200400639. [DOI] [PubMed] [Google Scholar]
- 28.Kohl T., Haustein E., Schwille P. Determining protease activity in vivo by fluorescence cross-correlation analysis. Biophys. J. 2005;89:2770–2782. doi: 10.1529/biophysj.105.061127. [DOI] [PMC free article] [PubMed] [Google Scholar]
- 29.Saito K., Wada I., Tamura M., Kinjo M. Direct detection of caspase-3 activation in single live cells by cross-correlation analysis. Biochem. Biophys. Res. Commun. 2004;324:849–854. doi: 10.1016/j.bbrc.2004.09.126. [DOI] [PubMed] [Google Scholar]
- 30.Slaughter B.D., Schwartz J.W., Li R. Mapping dynamic protein interactions in MAP kinase signaling using live-cell fluorescence fluctuation spectroscopy and imaging. Proc. Natl. Acad. Sci. USA. 2007;104:20320–20325. doi: 10.1073/pnas.0710336105. [DOI] [PMC free article] [PubMed] [Google Scholar]
- 31.Masters S.B., Landis C.A., Bourne H.R. Mutational analysis of the structure and function of GTP-binding proteins. Adv. Enzyme Regul. 1990;30:75–87. doi: 10.1016/0065-2571(90)90010-y. [DOI] [PubMed] [Google Scholar]
- 32.Owen D., Campbell L.J., Littlefield K., Evetts K.A., Li Z. The IQGAP1-Rac1 and IQGAP1-Cdc42 interactions: interfaces differ between the complexes. J. Biol. Chem. 2008;283:1692–1704. doi: 10.1074/jbc.M707257200. [DOI] [PubMed] [Google Scholar]
- 33.Erickson J.W., Cerione R.A., Hart M.J. Identification of an actin cytoskeletal complex that includes IQGAP and the Cdc42 GTPase. J. Biol. Chem. 1997;272:24443–24447. doi: 10.1074/jbc.272.39.24443. [DOI] [PubMed] [Google Scholar]
- 34.Rossman K.L., Der C.J., Sondek J. GEF means go: turning on RHO GTPases with guanine nucleotide-exchange factors. Nat. Rev. Mol. Cell Biol. 2005;6:167–180. doi: 10.1038/nrm1587. [DOI] [PubMed] [Google Scholar]
- 35.Coso O.A., Chiariello M., Yu J.C., Teramoto H., Crespo P. The small GTP-binding proteins Rac1 and Cdc42 regulate the activity of the JNK/SAPK signaling pathway. Cell. 1995;81:1137–1146. doi: 10.1016/s0092-8674(05)80018-2. [DOI] [PubMed] [Google Scholar]
- 36.Feig L.A., Cooper G.M. Inhibition of NIH 3T3 cell proliferation by a mutant Ras protein with preferential affinity for GDP. Mol. Cell. Biol. 1988;8:3235–3243. doi: 10.1128/mcb.8.8.3235. [DOI] [PMC free article] [PubMed] [Google Scholar]
- 37.Farnsworth C.L., Feig L.A. Dominant inhibitory mutations in the Mg2+-binding site of RasH prevent its activation by GTP. Mol. Cell. Biol. 1991;11:4822–4829. doi: 10.1128/mcb.11.10.4822. [DOI] [PMC free article] [PubMed] [Google Scholar]
- 38.Swart-Mataraza J.M., Li Z., Sacks D.B. IQGAP1 is a component of Cdc42 signaling to the cytoskeleton. J. Biol. Chem. 2002;277:24753–24763. doi: 10.1074/jbc.M111165200. [DOI] [PubMed] [Google Scholar]
- 39.Ho Y.D., Joyal J.L., Li Z., Sacks D.B. IQGAP1 integrates Ca2+/calmodulin and Cdc42 signaling. J. Biol. Chem. 1999;274:464–470. doi: 10.1074/jbc.274.1.464. [DOI] [PubMed] [Google Scholar]
- 40.Mateer S.C., McDaniel A.E., Nicolas V., Habermacher G.M., Lin M.J. The mechanism for regulation of the F-actin binding activity of IQGAP1 by calcium/calmodulin. J. Biol. Chem. 2002;277:12324–12333. doi: 10.1074/jbc.M109535200. [DOI] [PubMed] [Google Scholar]
- 41.Raghunath J., Rollo J., Sales K.M., Butler P.E., Seifalian A.M. Biomaterials and scaffold design: key to tissue-engineering cartilage. Biotechnol. Appl. Biochem. 2007;46:73–84. doi: 10.1042/BA20060134. [DOI] [PubMed] [Google Scholar]
- 42.Wylie D.C., Das J., Chakraborty A.K. Sensitivity of T cells to antigen and antagonism emerges from differential regulation of the same molecular signaling module. Proc. Natl. Acad. Sci. USA. 2007;104:5533–5538. doi: 10.1073/pnas.0611482104. [DOI] [PMC free article] [PubMed] [Google Scholar]