

Abstract
Molecular dynamics (MD) simulations of phosphatidylinositol (4,5)-bisphosphate (PIP2) and phosphatidylinositol (3,4,5)-trisphosphate (PIP3) in 1-palmitoyl 2-oleoyl phosphatidylcholine (POPC) bilayers indicate that the inositol rings are tilted ∼40° with respect to the bilayer surface, as compared with 17° for the P-N vector of POPC. Multiple minima were obtained for the ring twist (analogous to roll for an airplane). The phosphates at position 1 of PIP2 and PIP3 are within an Ångström of the plane formed by the phosphates of POPC; lipids in the surrounding shell are depressed by 0.5–0.8 Å, but otherwise the phosphoinositides do not substantially perturb the bilayer. Finite size artifacts for ion distributions are apparent for systems of ∼26 waters/lipid, but, based on simulations with a fourfold increase of the aqueous phase, the phosphoinositide positions and orientations do not show significant size effects. Electrostatic potentials evaluated from Poisson-Boltzmann (PB) calculations show a strong dependence of potential height and ring orientation, with the maxima on the −25 mV surfaces (17.1 ± 0.1 Å for PIP2 and 19.4 ± 0.3 Å for PIP3) occurring near the most populated orientations from MD. These surfaces are well above the background height of 10 Å estimated for negatively charged cell membranes, as would be expected for lipids involved in cellular signaling. PB calculations on microscopically flat bilayers yield similar maxima as the MD-based (microscopically rough) systems, but show less fine structure and do not clearly indicate the most probable regions. Electrostatic free energies of interaction with pentalysine are also similar for the rough and flat systems. These results support the utility of a rigid/flat bilayer model for PB-based studies of PIP2 and PIP3 as long as the orientations are judiciously chosen.
Introduction
Both nonspecific and specific interactions between proteins and membrane lipids play critical roles in intracellular signaling (1–4). Nonspecific binding is mostly modulated by phosphatidylserine (PS), a monovalent acidic lipid. PS constitutes ∼25% of the phospholipid in the inner leaflet of the plasma membrane, and the electrically neutral phosphatidylcholines (PC) and phosphatidylethanolamines (PE) account for ∼60%. The appreciable negative charge from PS has been suggested to provide a driving force for plasma membrane localization of a wide range of peripheral proteins such as K-Ras, MARCKS, and Src. In contrast, specific protein-lipid interactions are primarily modulated by phosphoinositides, which account for 4%–5% of membrane phospholipid. Two major poly-phosphoinositides in mammalian cells are phosphatidylinositol (4,5)-bisphosphate (PIP2) and phosphatidylinositol (3,4,5)-trisphosphate (PIP3). Strikingly, the levels of PIP2 are relatively stable, whereas those of PIP3 are dynamically regulated. The lipid compositions of intracellular membranes in a cell vary dramatically, and such differences are important in the recruitment of proteins to different subcellular compartments during cellular signaling. Proteins that specifically bind to PIP2 include the Pleckstrin homology (PH) domain of phospholipase C-δ1(2), the epsin N-terminal homology (ENTH) domain (5), and the Gag precursor protein Pr55Gag of HIV-1 (6).
Over the past 20 years, a number of theoretical approaches have been used to describe the electrostatic properties of phospholipid membranes (7). The most primitive model for the electrostatics of the phospholipid bilayers is the smeared charge model, which is based on Gouy-Chapman theory. Here the membrane surface is assumed to be flat and homogeneous. This model yields semiquantitative descriptions of the electrostatic properties of the membrane surface when the shape and charge distribution of lipids and adsorbed proteins may be neglected (8,9). However, it breaks down when localized charge distributions and shapes become important. This effect, known as “discreteness of charge”, is critical for describing systems that contain multivalent phosphoinositides at the low concentrations found in naturally occurring cell membranes (10).
The next level treatment for these more-complex systems is based on the finite-difference Poisson-Boltzmann (FDPB) method (11,12). The solvent is described implicitly in terms of a bulk dielectric constant and the mobile ions are modeled in the mean-field approximation, whereas the membranes and relevant macromolecules are included in atomic detail (13–17). The FDPB method can successfully describe the electrostatic properties of membranes and protein/membrane systems, as judged by comparison with extensive experimental measurements (2,10,13,15,18–24). In a study by McLaughlin and Murray (2), FDPB treatment of PIP2-containing PC and PC/PS bilayers revealed that PIP2 dramatically enhances the negative electrostatic potential in a localized manner. However, their study included two sizeable assumptions. First, the orientation of the PIP2 headgroup was set perpendicular to the membrane plane. This was based on the results of neutron diffraction studies of PI and PI4P vesicles containing 50 mol % phosphoinositide (21,25), which is more than an order of magnitude greater than that in biological membranes. Second, the membrane systems were modeled as microscopically flat and static structures, whereas it is well known from experiment and simulation that the surfaces of fluid phases lipid bilayers are microscopically rough and very dynamic.
This work presents the results of molecular dynamics (MD) simulations of a single PIP2 and PIP3 in 1-palmitoyl 2-oleoyl phosphatidylcholine (POPC) bilayers, and has two principal aims. The first is to establish the positions and orientations of the aforementioned phosphatidylinositols in the bilayers. These have not been determined experimentally at physiologically relevant low concentrations, and therefore provide important points of comparison for both future simulations and experiments. The second aim is to examine the assumption of molecular flatness in the FDPB calculations described above using the microscopically rough (and more realistic) surfaces obtained from the MD. The combined result of these two aims provides a robust estimate for the sizes of the electrostatic “bulges” (or domes) of PIP2 and PIP3, and lends insight into their signaling in a cellular environment.
The first part of this work describes the MD calculations. Three trajectories of 50 ns each for bilayers containing 71 POPC, one PIP (PIP2 or PIP3), and ∼26 waters/lipid and 0.1 M NaCl were analyzed for the orientation and z-position of PIP, the solvent-accessible surface area (SASA) of each phosphate in its headgroup, the perturbations to its neighboring lipids, and its effects on the distribution of ions. MD simulations were also carried out with the same numbers of lipids and a fourfold increase of solvent to rule out significant system size effects on relevant conclusions. The second part examines the electrostatics. FDPB calculations were carried out on snapshots from the MD simulations, and on PIP headgroups attached to microscopically flat POPC bilayers of the sort used in previous PB studies. Comparisons of the −25 mV electrostatic equipotential profiles and the electrostatic free energies of interaction with pentalysine for the MD-based and flat systems then yield an assessment of the applicability of the latter.
Materials and Methods
MD simulations
All systems contained a single PIP2 or PIP3 and 35 POPC in the cis (PIP-containing) leaflet, and 36 POPC in the trans leaflet, 0.1 M NaCl, and neutralizing counterions (4 Na+ for PIP2 and 6 Na+ for PIP3). Two sizes were simulated: 1X, which contained ∼26 waters/lipid and 12 ion pairs, and 4X, with 104 waters/lipid and 48 ion pairs. Three replicates of the 1X systems were generated; these are denoted 1Xa, 1Xa, and 1Xc. Chains 1 and 2 of the PIPs in the 4X systems are stearic and arachidonic acid, respectively, as is observed in naturally occurring membranes (26). The phosphatidylcholine with these fatty acid chains is denoted SAPC. Chain 1 of the 1X systems is also stearic acid. However, the positions of the double bonds of chain 2 of the PIPs were incorrectly offset (C4=C5 instead of C5=C6, and so on). The ramifications of this error are minor, based on comparisons with the 4X system. This is also consistent with the simulation studies of Martinez-Seara et al. (27) who found relatively little effect of a double bond shift at the 5 and 7 positions of 18 carbon chains. For simplicity, the associated phosphatidylcholine is also denoted SAPC in the model building described below.
The 1X systems were constructed from a bilayer of a single SAPC and 71 POPC. This system was generated from a library of lipids extracted from a previous simulation of fully hydrated pure POPC, and a single SAPC using the build-up procedure described previously (28). After model building and solvation (including 12 ion pairs) was completed, the SAPC/POPC system was simulated for 55 ns in the NPAT ensemble (29,30), with constant particle number N, temperature T = 303 K, normal pressure P = 1 atm, and surface area A = 68 Å2 /lipid (the experimental surface area for pure POPC at 303 K (31)). The PC headgroup of SAPC was replaced by either PIP2 or PIP3 at 5, 6, and 7 ns coordinate sets to yield the three replicates 1Xa, 1Xb, and 1Xc. The following protocol was followed in each case: deletion of overlapping waters, minimization, addition of neutralizing counterions by random placement in the solvent region, minimization, and velocity reassignment. The three 1X systems were then simulated for 55 ns, and the last 50 ns were used for analysis.
The 4X systems were constructed by extracting the water and ion pairs (but not the neutralizing Na+ ions) from the 55 ns time frame of 1Xa, and reforming them into a slab with the same area cross section as the bilayer systems via minimization. The height was initially set overly large, and then systematically reduced to obtain the approximate experimental density of water during the minimization. The water and ion slabs were then equilibrated for 1 ns of NPAT dynamics. Three copies of the respective slabs (one from PIP2 and one from PIP3) were then reinserted into the systems from which they were extracted, and the unit cell height increased appropriately. The polyunsaturated chain 2 on the 1X system was transmuted to arachidonic acid. A 50 ns trajectory was generated, and the last 45 ns were used for analysis.
MD simulations were performed using CHARMM (Chemistry at Harvard Macromolecular Mechanics) (32) with the C27r (33) all-atom potential energy set for POPC and for each phosphoinositide, and modified TIP3P for water (34,35). C27r revises the chain torsions of the older C27 parameter set (36), but is otherwise identical. As noted in a recent review (37), these lipid parameters reproduce a wide range of structural and dynamical experiments, especially the region around the phosphate headgroup (38). It was necessary to assume transferability from glycerol phosphate parameters to describe phosphoinositol; specifically, the CTL1 atom type was assumed to have the same angle (C-O-P) and torsion (C-O-P-O) parameters as CTL2. This is completely consistent with the phosphate parameters in the CHARMM C27 nucleic acid set. All of the other parameters were already present in the distributed lipid set. Parameters for chain 2 of PIP were as described previously (39). Newton's equations of motion were integrated using the Verlet algorithm with a 1 fs time step, and coordinates were saved every 1 ps. Simulations were carried out with periodic boundary conditions with a tetragonal lattice in the NPAT ensemble, with the z axis normal to the interface (i.e., the area was fixed and the height varied independently). Electrostatic interactions were calculated with particle mesh Ewald (PME) (40) with a 10 Å real-space cutoff and an ∼1 Å grid spacing for the reciprocal space sum. Lennard-Jones energies were switched to zero between 8 and 10 Å. SHAKE (41) was used to constrain all covalent bonds involving hydrogen atoms. Analysis of membrane structural differences focused on the SASA of the headgroup of each PIP, the number density profile of the ions, and the orientation and z-position of the PIP headgroups.
FDPB calculations
Finite-difference solutions to the nonlinear PB equation (FDPB method) were obtained using a modified version of DelPhi (42). The solvent was described in terms of a bulk dielectric constant and mean concentrations of mobile ions (0.1 M NaCl), whereas coordinates, radii, and partial charges were included for each lipid atom. The FDPB method was employed to study the electrostatic potentials of the bilayer surfaces based on two different series of molecular models for each PIP. The MD simulation models were based on the 1500 snapshots from the trajectories. The flat bilayer models were prepared from the 2D lattice coordinates of the individual lipids by translation and rotation of the individual lipid coordinates to the desired center-of-mass locations, with a surface area of 68 Å2/lipid. The rotation angles of the initial structures were chosen to ensure that there were no overlaps. The lipid in the center of the flat bilayer model was replaced by a PIP whose headgroup possesses a different orientation and z-position (details are described in the next section). The molecular models were then mapped onto a 3D cubic grid of 2093 points, each of which represents a small region of the membrane. The charges and radii used for the lipids were those described by Peitzsch et al. (43) and used in previous studies (10,20,22). The partial charges of the phosphoinositides were taken from similar functional groups from the CHARMM27 parameter set (36), with the net charges on PIP2 and PIP3 equal to −4 and −6, respectively (it was assumed that one of the oxygen atoms in the phosphate of the inositol ring in PIP2 and PIP3 is protonated). The molecular surfaces of the molecules were determined with CHARMM using a spherical probe radius 1.4 Å (the radius of a water molecule). Regions inside the molecular surfaces of the membrane were assigned a dielectric constant of 2 to account for electronic polarizability, and those outside were assigned a dielectric constant of 80 (44). An ion exclusion layer was added to the solutes to extend 2 Å beyond the molecular surfaces. The nonlinear Poisson-Boltzmann (PB) equation was solved in the finite-difference approximation, and the numerical calculation of the potential was iterated to convergence (the point at which the electrostatic potential changes 10−4 kT/e between successive iterations (17)).
Results and Discussion
Structural quantities of PIP2 and PIP3
This subsection describes the MD simulations, beginning with the three replicates of the 26 water/lipid systems (1Xa, 1Xb, and 1Xc) and proceeding to the 104 water/lipid (4X) systems.
Fig. 1 plots the distributions along the bilayer normal (z) for each phosphate of PIP2 and PIP3 with respect to the center of the bilayer, and Table 1 lists the averages with respect to the plane of the phosphates of POPC in the same leaflet. The average position of P1 of PIP2 is statistically equal to that of the phosphates of POPC, whereas P1 of PIP3 extends slightly (0.6 Å) into the solvent; the reference plane was defined by the instantaneous positions of P1 of POPC which were more than 15 Å from P1 of the PIP. The widths of the distributions are similar to those of the neighboring lipids and to P1 in other fluid phase bilayers (31,45). P4 of PIP2 and PIP3 both extend ∼5.5 Å above the average phosphate plane, and ∼1 Å above the other ring phosphates. No significant difference was observed for the average z-position of P3 and P5 in PIP3 (the nonnormal character of these distributions is discussed further below). The average position of N in POPC is 1.2 Å above the phosphate plane, indicating that the ring phosphates of PIP2 and PIP3 are, on average, well above the PC headgroups.
Figure 1.
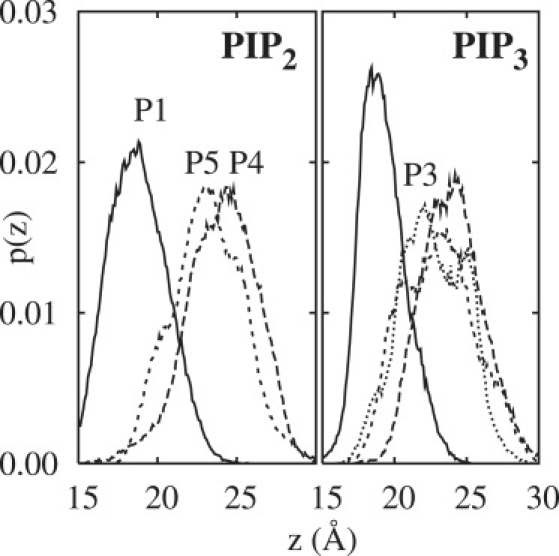
Distribution of the z-position of the phosphates in PIP2 (left) and PIP3 (right) from the MD trajectories from the average of the 26 water/lipid (1X) systems.
Table 1.
Structural quantities of the headgroups of PIP2 and PIP3 from the average of the three replicates 1Xa, 1Xb, and 1Xc (first entry), and from 4X (in parentheses)
| PIP | phosphate | Δz (Å) | SASA (Å2) | θ, ϕ (deg) |
|---|---|---|---|---|
| PIP2 | 1 | 0.1 ± 0.3 (1.1 ± 0.3) | 26 ± 3 (29 ± 1) | 44 ± 1, 11 ± 8 (34 ± 3, 4 ± 8) |
| 4 | 5.5 ± 0.3 (5.3 ± 0.6) | 95 ± 5 (78 ± 9) | ||
| 5 | 4.7 ± 0.4 (4.3 ± 0.6) | 87 ± 5 (74 ± 9) | ||
| PIP3 | 1 | 0.6 ± 0.2 (1.2 ± 0.5) | 22 ± 2 (33 ± 2) | 39 ± 5, 5 ± 14 (31 ± 5, 23 ± 7) |
| 3 | 4.1 ± 0.3 (3.2 ± 0.9) | 81 ± 6 (69 ± 9) | ||
| 4 | 5.4 ± 0.3 (5.2 ± 0.7) | 90 ± 5 (80 ± 5) | ||
| 5 | 4.5 ± 0.4 (4.5 ± 0.4) | 91 ± 5 (97 ± 3) |
Table 1 includes the SASAs of the PIP phosphates as computed with a 1.4 Å probe radius. The SASAs of P1 in PIP2 and PIP3 are statistically equal to each other, and 3–4 times less than values for the phosphates on the ring. The mean ± standard error (SE) values for the ring phosphates are also approximately twice as large as for P1, which is consistent with their broad distributions in z (Fig. 1) and the ring dynamics described below. The SASA of the phosphate group of POPC in the SAPC/POPC bilayer is 46.9 ± 0.4 Å2.
Evaluating the orientations of the PIP headgroups is not straightforward because they are not rigid. Here the internal vectors of the relatively rigid inositol ring were used. As sketched in Fig. 2, and specify the angles made by the C1–C4 and C3–C5 vectors with respect to the bilayer normal. The corresponding angles (in degrees) with respect to the bilayer surface are then and , and are denoted as tilt and twist, respectively (twist is analogous to roll, such as when an airplane lowers one wing and raises the other). Fig. 3 plots the time series of these angles for the three replicates, and the last column in Table 1 lists the averages; θ samples values in the range of 0–80°, much like an overdamped harmonic oscillator, with an average value 40° for both PIP2 and PIP3. ϕ samples a broader range and appears to jump between minima several times in each trajectory. This explains the broad and multimodal distributions for the P3 and P5 positions (Fig. 1). The 2D potentials of mean force (PMF) for the θ, ϕ surface shown in Fig. 4 illustrate this further. A particular 50 ns trajectory tends to sample only one or two of these minima. Nevertheless, the average of all three replicates (next to last row, labeled 1X) shows all the states, indicating that convergence is reasonable. Although 0° (Table 1), there are preferred locations at ϕ ≈ 0° and ±35° for both PIP2 and PIP3. Hence, the ring can be flat (ϕ ≈ 0°), with P5 and P3 at approximately the same height, or twisted with P5 higher than P3 (ϕ ≈ 35°) or P3 higher than P5 (ϕ ≈ −35°). The SASAs for the P3 and P5 phosphates in PIP3 are ∼75, 100, and 120 Å2, depending on ϕ.
Figure 2.
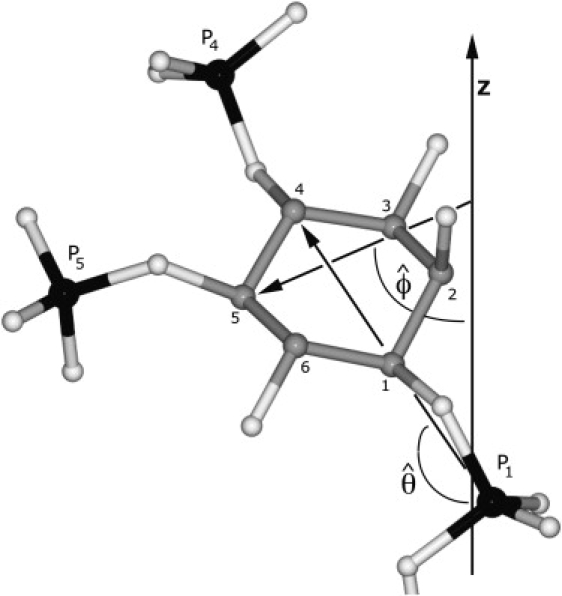
Definitions of and , the angles made by the C1–C4 and C3–C5 vectors of the inositol ring with the bilayer normal (z), and numbering of the ring. The molecule shown is a PIP2 taken from a representative snapshot of the MD simulations.
Figure 3.
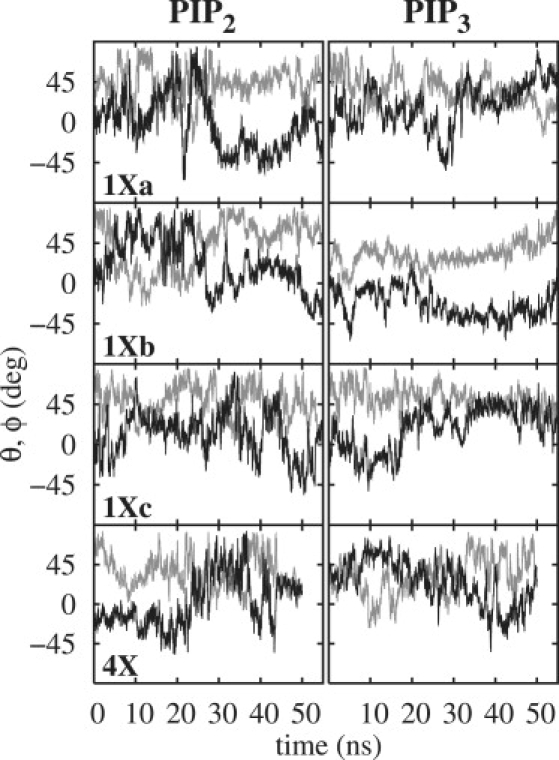
Time series of (gray) and (black) of PIP2 (left four panels) and PIP3 (right four panels) for each of the three replicate 26 water/lipid systems (1Xa, 1Xb, and 1Xc) and the 102 water/lipid system (4X).
Figure 4.
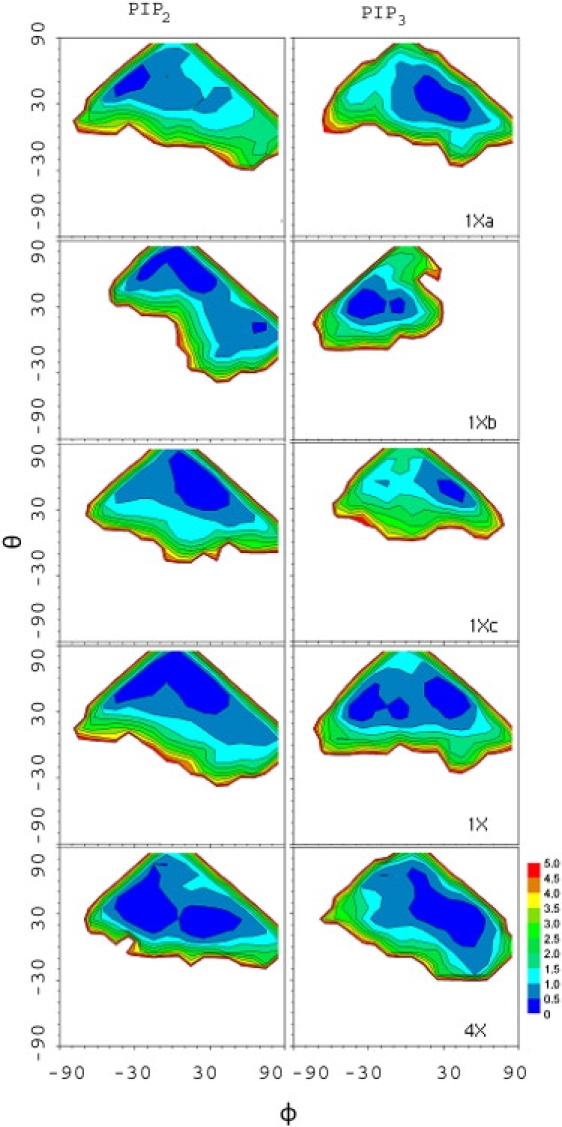
2D PMFs (θ, ϕ) of PIP2 and PIP3 for each of the three 50 ns replicates of the MD simulations of the 26 water/lipid systems, the average over the replicates, and the 102 water/lipid system (one 45 ns replicate). The PMFs were obtained from the joint probability distribution of these angles as -kBT ln p(θ, ϕ), where kB is Boltzmann's constant and T is temperature.
The low barrier (0.5 kcal/mol) between the minima on the average θ, ϕ surface does not imply that transitions are rapid (they are on the 20 ns timescale, as is evident in Fig. 3). Rather, it is a limitation of reducing a complex phase space to only two dimensions. Nevertheless, such a representation is useful and yields the same conclusions as a treatment based on the P1–P4 and P3–P5 vectors (data not shown).
The interactions of PIP2 and PIP3 and the surrounding lipids in the bilayer were assessed by means of the average z-position of the POPC phosphate and θPN, the angle between the PN vector and the bilayer surface. Fig. 5 indicates a 0.5–0.8 Å depression in the bilayer surface in the first shell (r < 8 Å) of lipids for both phosphoinositides, and shows that the effect dissipates in the second shell. Lipid distributions on the trans leaflet evaluated as a control exhibited no such perturbations, i.e., the distribution functions oscillated ∼0 for all r. A similar analysis for θPN showed uniform behavior for POPC on both the cis and trans leaflets, with an average of 17.2 ± 0.2°.
Figure 5.
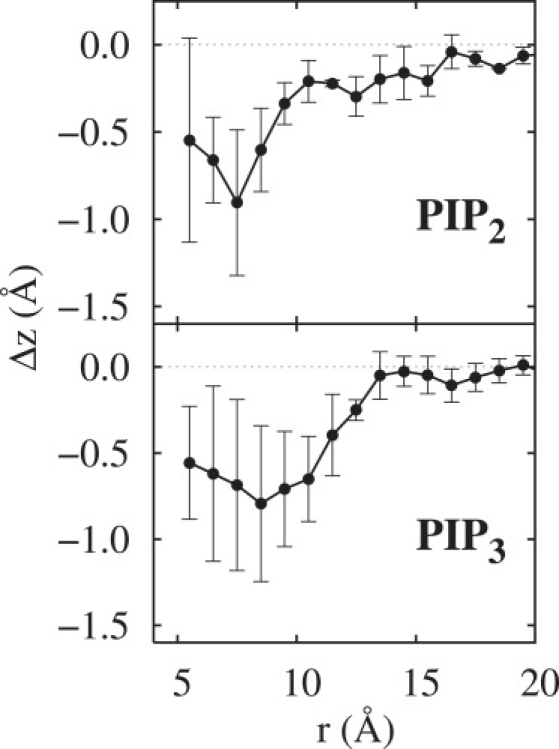
Shift in the z-positions of P1 of POPC as a function of distance from P1 of PIP2 (top) and PIP3 (bottom). The reference plane was defined by the average instantaneous positions of P1 of POPC more than 15 Å from P1 of the PIP. Error bars are standard errors from the three 1X replicates.
Finite size effects
The effects of water thickness on the properties of lipid bilayers were recently reported (46,47). The importance of this effect for the study presented here may be determined by comparing the 1X and 4X systems. As shown in Fig. 6 for PIP2 (top) and PIP3 (bottom), there is a substantial excess of Cl− in the center of the water (±30 Å) for the 1X systems, i.e., there is no “bulk” solvent region in the systems. The reason for this is simple: the negatively charged phosphates condense a layer of Na+ at approximately ±25 Å. Chloride ions form the coion layer farther from the bilayer surface, leading to the net negative charge in this region. There is sufficient solvent in the 4X systems to allow a fully formed coion layer and a substantial region of bulk (electrically neutral) solvent. Despite these differences, however, the ion distributions near the bilayer surface are very similar for the 1X and 4X systems. In effect, the free-energy gain of interacting with the POPC headgroups and neutralizing the phosphates the PIP is greater than the free-energy loss associated with the nonbulk water layer.
Figure 6.
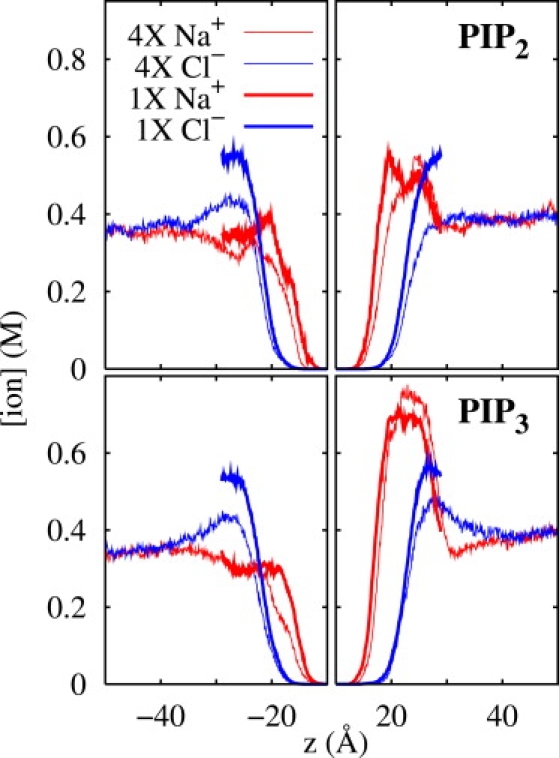
Distribution of ion (Na+ and Cl−) concentration normal to the bilayer surface for a PIP2 in POPC (top) and PIP3 in POPC (bottom) for the large (4X) and small (1X) systems. The bilayer center is located at z = 0, and the PIP is located in the positive z side. The region from z = −10 to z = 10 is not shown in the plots.
As may be expected from the similarities of ion distributions of the 1X and 4X systems at the bilayer/solvent interface, the differences in positions (Table 1), SASAs (Table 1), and orientations of PIP2 and PIP3 (Figs. 2 and 3) are also small, and generally within the statistical uncertainty of the simulations. Because there is greater sampling in the 1X systems (there are three independently generated replicates), they are used for the primary analysis. Nevertheless, the basic conclusions of this study are consistent with 4X results.
Given that the MD simulations are used to evaluate the orientation of the PIP headgroups, the finite size effects associated with the lateral dimensions (50 Å) are expected to be negligible. This inference is based on the equivalence of headgroup reorientational correlation functions from simulations of DPPC bilayers with 72 and 288 lipids (48). Naturally, deformations of the membrane above the 5 ns length scale are not approachable with this study.
Electrostatic potential surfaces
The top panels of Fig. 7 show representative images of the −25 mV electrostatic potential surfaces, and the lower panels compare the height of the potential bulge as a function of the orientation angles θ and ϕ for the MD-based and microscopically flat systems. The MD-based results are considered first.
Figure 7.
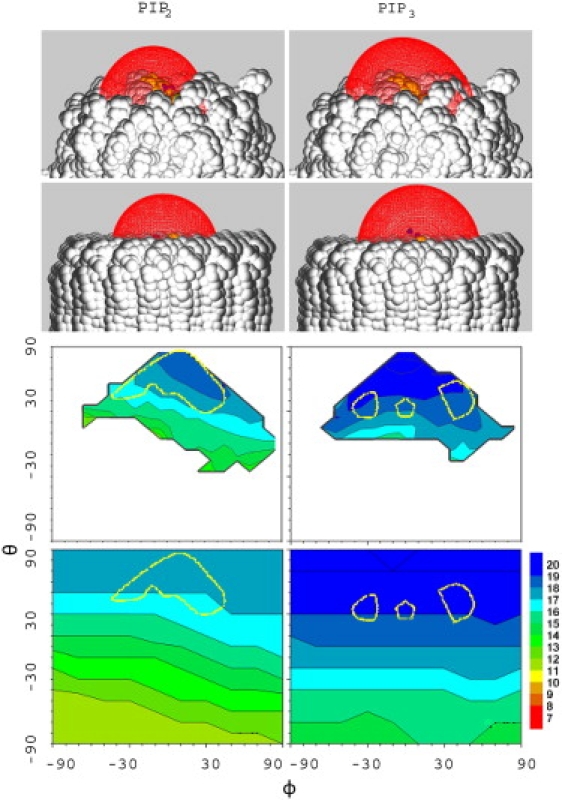
The −25 mV electrostatic potential from representative configurations of PIP2 (left) and PIP3 (right) from MD (top) and the same orientations for the flat model (second row); maximum height (in Å) of the −25 mV potential on the θ,ϕ surface for the MD (third row) and flat system (bottom). The regions enclosed by the yellow lines correspond to the most probable orientations obtained in the MD simulations (see Fig. 4). The MD surface was obtained from an average of three 1X systems and is nearly identical to that of the 4X system. The molecular surface image was generated by GRASP2 (52).
Not surprisingly, the bulge height strongly depends on θ (the height of P4 of the PIP is a maximum when θ = 90°). Rotation of ϕ changes the height of P5 of PIP2 and thereby the height of the potential bulge for a given θ. In contrast, the height of the potential is relatively independent of ϕ for PIP3. This is because increasing the z-position of P5 lowers the position of P3, and the effects cancel.
Table 2 lists the averaged heights of the −25mV potential obtained from 100 ps snapshots of the trajectories (500 points from each 1X replicate, and 450 from the 4X systems). The values for each 1X replicate and the 4X are within the statistical uncertainties of each other. Treating each trajectory as an independent sample yields average heights of 17.1 ± 0.1 Å for PIP2 and 19.4 ± 0.3 Å for PIP3. The most probable orientations (Fig. 4 and the region enclosed by the yellow line in Fig. 7) are close to but not precisely the same as the orientations with the highest potential. The same observation holds for the 4X systems (data not shown). This implies that the electrostatic free energy is an important, but not the only, contributor to the orientation of the PIP.
Table 2.
Height (in Å) of the −25 mV equipotential bulge induced by PIP2 and PIP3 above the bilayer surface for the MD and flat bilayer models
| PIP | MD simulation |
Flat bilayer∗ |
||||
|---|---|---|---|---|---|---|
| 1Xa† | 1Xb | 1Xc | 1Xb | 4X | ||
| PIP2 | 16.9 ± 0.2 | 17.4 ± 0.3 | 17.2 ± 0.3 | 17.2 ± 0.3 | 16.9 ± 0.3 | 17.0 ± 0.2 |
| PIP3 | 19.1 ± 0.2 | 18.8 ± 0.3 | 20.3 ± 0.2 | 19.4 ± 0.2 | 19.5 ± 0.5 | 18.7 ± 0.4 |
Averages and mean ± SE obtained from the points enclosed by the dashed yellow lines in Fig. 7 denoting the most populated regions sampled in the MD trajectories.
Average of 1Xa, 1Xb, and 1Xc.
Turning to the results for the “flat” systems, the final row of Fig. 7 indicates that the θ, ϕ dependence is similar to the MD-based ones (a full sweep of angles is possible for the former, because steric clashes and unfavorable internal energies were ignored). The average heights from the flat systems obtained from orientations populated in the MD (those contained by the yellow lines) are nearly identical to the MD averages (final column of Table 2). The overall shape of the potential bulges (top two rows of Fig. 7) are also very similar. Hence, the fine structure of the membrane and specific interactions with neighboring lipids essentially average out for purposes of evaluating the electrostatic potential.
Differences between the rough and flat systems were also probed by evaluating the electrostatic free-energy differences from bringing pentalysine (charge of +5) to the surface from z = ∞. In each case, the peptide was fully extended and oriented parallel to the surface. Representative PIP2 and PIP3 configurations were selected from the MD trajectories and flat systems, and energies were calculated as described previously (10). The top panel of Fig. 8 shows that PIP3 interacts more favorably with the peptide than PIP2 by an ∼1 kcal/mol difference over the range of 13–21 Å. The minima, at 13–14 Å, correspond to the height of the PIP plus one layer of water. Interactions become repulsive at shorter distances, which is the realm of specific binding. The lower panel of Fig. 8 plots the differences of the microscopically rough and flat surfaces for each PIP. Consistent with the results shown in Fig. 7, the differences are only a few tenths of a kcal/mole in the relevant regions, again demonstrating the utility of the simplified description.
Figure 8.
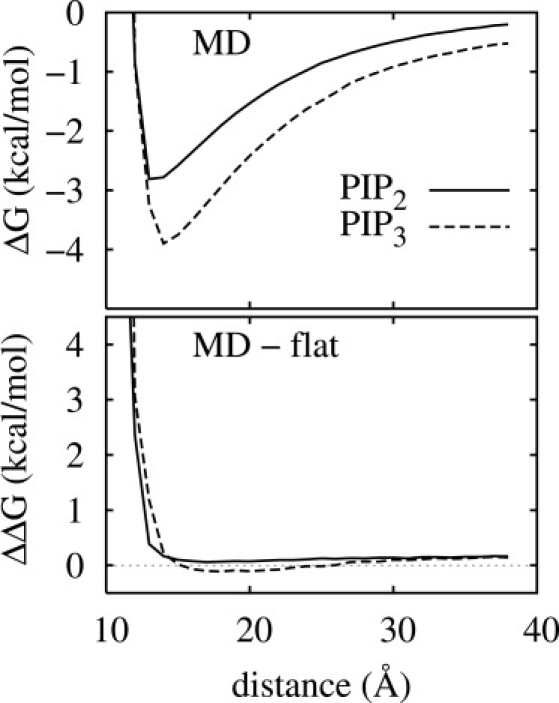
Electrostatic free-energy difference of pentalysine as a function of distance above the bilayer surface (defined by the phosphate plane). (Top panel) MD simulated bilayers with PIP2 and PIP3. (Bottom panel) Difference of MD and flat bilayers for each PIP.
The near equivalence of electrostatic properties from the two treatments is consistent with the insensitivity of electrophoretic measures to details of the membrane surface roughness (7,9), and some electrostatic properties are even independent of phase for a fixed charge density (9). It is, nevertheless, useful to demonstrate this insensitivity using simulations. Estimates from such electrostatic models place the −25 mV surface of cell membranes at ∼10 Å above the membrane plane. Hence, our values of 17 and 19 Å for PIP2 and PIP3, respectively, set them well above the background potential.
The electrostatic potentials obtained here are also reminiscent of those calculated in an earlier PB study (10) with similar but static lipids and membranes. The results of that study and complementary experimental measurements (49) show that the phosphoinositide lipids produce an enhanced negative potential, even on the background of a strongly electronegative 2:1 PC/PS bilayer (PS, phosphatidylserine with z = −1). Such exposure allows poly-phosphoinositides, particularly PIP2 and PIP3, to serve as “basins of attraction” for basic regions on peripheral proteins (50) as well as for the basic juxtamembrane sequences found on many transmembrane receptors. For example, strong, nonspecific sequestration of PIP2 appears to play a major inhibitory function in the epidermal growth factor receptor (EGFR) (2) and the myristoylated alanine-rich C-kinase substrate (MARCKS) protein (2,50). Even though PIP3 is a transient lipid that serves as a potent mitogenic signal, the results presented here indicate that upon its production in activated cells, it would be similarly nonspecifically sequestered.
The calculations of the nonspecific interactions with basic sequences show that the electrostatic free energies with PIP2 (z = −4) are only slightly less favorable than the electrostatic free energies with PIP3 (z = −6; Fig. 8). There is an additional electrostatic force that works against the simple charge-charge attraction, a desolvation penalty due to stripping of water molecules from charged and polar atoms on the lipids and proteins. In the language of the FDPB calculations employed here, it is the penalty for transfer of charged and polar moieties from a high dielectric region (water, ɛ ∼80) to a low dielectric region (molecules, ɛ ∼2)—in essence, a more complex illustration of Born ion transfer.
In addition to the high-affinity, nonspecific protein/phosphoinositide interactions discussed above, phosphoinositide lipids mediate specific interactions with a wide variety of proteins from domain families such as FYVE, PH, PX, ENTH/ANTH, and FERM (51). These domains share similar phosphoinositide-binding functions but have dramatically different structures. A main point of this study is that phosphoinositides exhibit favored structural orientations. This suggests that the headgroup heights and orientations correlate with the manner in which phosphoinositide-binding or -modifying proteins interact with membranes.
Conclusions
MD simulations indicate that PIP2 and PIP3 are well accommodated in a POPC bilayer, and do not substantially perturb the neighboring lipids when at low (physiological) concentrations. The phosphate at the 1 position (P1) resides in the plane of the P1 of POPC, whereas the ring phosphates of PIP (P3, P4, and P5) are above the average plane of the nitrogens of POPC. The orientation (Fig. 2) of the rings of PIP2 and PIP3 are comparable, with θ (tilt) fluctuating around 40° and ϕ sampling minima at ∼0° and ±35°. The positions of the preceding minima in ϕ are not fixed, and depend on many other conformational variables. These tilt values differ from the ϕ ≈ 90° obtained by neutron diffraction measurements of PI and PI4P vesicles containing 50 mol % phosphoinositide, and thus await experimental confirmation.
Although 26 waters/lipid (the so-called 1X systems) are not sufficiently large to support a region of bulk phase water, ion distributions near the surface of the bilayer are very similar to those obtained from simulations with 4 times the solvent (Fig. 6). Other averages, including the heights of the −25 mV potential surfaces (Table 2), are also statistically equivalent. Hence, it is permissible to use the smaller systems for exploratory studies.
The electrostatic −25 mV θ,ϕ potential surfaces are sensitive to θ but relatively insensitive to ϕ (Fig. 7). Hence, models of phosphoinositide/protein electrostatic interactions based on incorrect θ are potentially misleading. Nevertheless, the electrostatic potential surfaces for the MD-based and microscopically flat systems are very similar in the regions sampled by the MD. Likewise, the average heights and electrostatic free energies (Fig. 8) from the two models are similar when averaging of the flat systems is restricted to the most probable orientations obtained from MD. Furthermore, our results indicate that the microscopic roughness and complex PIP-lipid and PIP-ion interactions of the MD-based bilayers effectively average when treated at the level of the PB model (Table 2), i.e., a microscopically flat bilayer may be used with confidence for electrostatic calculations of the present PIP-based systems, as long as the appropriate (MD-generated) orientations are utilized.
The −25 V potential surfaces of both PIP2 and PIP3 are substantially higher than the background height estimated for negatively charged cell membranes, consistent with their roles as signaling lipids.
Acknowledgments
We thank Stuart McLaughlin for many helpful discussions.
This research was supported in part by the Intramural Research Program of the National Heart, Lung and Blood Institute, National Institutes of Health (NIH), and the National Institute of General Medical Sciences, NIH (grant GM66147 and GM71700 to D.M.). This study utilized the high-performance computational capabilities of the CIT Biowulf/LoBoS3 and NHLBI LOBOS clusters at the NIH, Bethesda, MD.
References
- 1.Langner M., Cafiso D., Marcelja S., McLaughlin S. Electrostatics of phosphoinositide bilayer membranes—theoretical and experimental results. Biophys. J. 1990;57:335–349. doi: 10.1016/S0006-3495(90)82535-2. [DOI] [PMC free article] [PubMed] [Google Scholar]
- 2.McLaughlin S., Murray D. Plasma membrane phosphoinositide organization by protein electrostatics. Nature. 2005;438:605–611. doi: 10.1038/nature04398. [DOI] [PubMed] [Google Scholar]
- 3.Muller M., Zschornig O., Ohki S., Arnold K. Fusion, leakage and surface hydrophobicity of vesicles containing phosphoinositides: influence of steric and electrostatic effects. J. Membr. Biol. 2003;193:33–43. doi: 10.1007/s00232-002-1062-0. [DOI] [PubMed] [Google Scholar]
- 4.Yeung T., Gilbert G.E., Shi J., Silvius J., Kapus A. Membrane phosphatidylserine regulates surface charge and protein localization. Science. 2008;319:210–213. doi: 10.1126/science.1152066. [DOI] [PubMed] [Google Scholar]
- 5.Ritter B., McPherson P.S. There's a GAP in the ENTH domain. Proc. Natl. Acad. Sci. USA. 2006;103:3953–3954. doi: 10.1073/pnas.0600658103. [DOI] [PMC free article] [PubMed] [Google Scholar]
- 6.Freed E.O. HIV-1 Gag: flipped out for PI(4,5)P-2. Proc. Natl. Acad. Sci. USA. 2006;103:11101–11102. doi: 10.1073/pnas.0604715103. [DOI] [PMC free article] [PubMed] [Google Scholar]
- 7.McLaughlin S. The electrostatic properties of membranes. Annu. Rev. Biophys. Biophys. Chem. 1989;18:113–136. doi: 10.1146/annurev.bb.18.060189.000553. [DOI] [PubMed] [Google Scholar]
- 8.Heimburg T., Marsh D. Birkhauser; Boston: 1996. Thermodynamics of the Interaction of Proteins with Lipid Membranes. [Google Scholar]
- 9.Kim J., Mosio L., Chung L.A., Wu H., McLaughlin A. Binding of peptides with basic residues to membranes containing acidic phospholipids. Biophys. J. 1991;60:135–148. doi: 10.1016/S0006-3495(91)82037-9. [DOI] [PMC free article] [PubMed] [Google Scholar]
- 10.Wang J.Y., Gambhir A., McLaughlin S., Murray D. A computational model for the electrostatic sequestration of PI(4,5)P2 by membrane-adsorbed basic peptides. Biophys. J. 2004;86:1969–1986. doi: 10.1016/S0006-3495(04)74260-5. [DOI] [PMC free article] [PubMed] [Google Scholar]
- 11.Bhuiyan L.B., Outhwaite C.W. Comparison of the modified Poisson-Boltzmann theory with recent density functional theory and simulation results in the planar electric double layer. Phys. Chem. Chem. Phys. 2004;6:3467–3473. [Google Scholar]
- 12.Sperotto M.M., May S., Baumgaertner A. Modelling of proteins in membranes. Chem. Phys. Lipids. 2006;141:2–29. doi: 10.1016/j.chemphyslip.2006.02.024. [DOI] [PubMed] [Google Scholar]
- 13.Baker N.A., Sept D., Joseph S., Holst M.J., McCammon J.A. Electrostatics of nanosystems: Application to microtubules and the ribosome. Proc. Natl. Acad. Sci. USA. 2001;98:10037–10041. doi: 10.1073/pnas.181342398. [DOI] [PMC free article] [PubMed] [Google Scholar]
- 14.Davis M.E., McCammon J.A. Electrostatics in biomolecular structure and dynamics. Chem. Rev. 1990;90:509–521. [Google Scholar]
- 15.Honig B., Nicholls A. Classical electrostatics in biology and chemistry. Science. 1995;268:1144–1149. doi: 10.1126/science.7761829. [DOI] [PubMed] [Google Scholar]
- 16.Prabhu N.V., Zhu P.J., Sharp K.A. Implementation and testing of stable, fast implicit solvation in molecular dynamics using the smooth-permittivity finite difference Poisson–Boltzmann method. J. Comput. Chem. 2004;25:2049–2064. doi: 10.1002/jcc.20138. [DOI] [PubMed] [Google Scholar]
- 17.Sharp K.A., Honig B. Electrostatic interactions in macromolecules: theory and applications. Annu. Rev. Biophys. Biophys. Chem. 1990;19:301–332. doi: 10.1146/annurev.bb.19.060190.001505. [DOI] [PubMed] [Google Scholar]
- 18.Arbuzova A., Wang L., Wang J., Hangyas-Mihalyne G., Murray D. Membrane binding of peptides containing both basic and aromatic residues. Experimental studies with peptides corresponding to the scaffolding region of caveolin and the effector region of MARCKS. Biochemistry. 2000;39:10330–10339. doi: 10.1021/bi001039j. [DOI] [PubMed] [Google Scholar]
- 19.Ben-Tal N., Honig B., Miller C., McLaughlin S. Electrostatic binding of proteins to membranes: theoretical prediction and experimental results with charybdotoxin and phospholipid vesicles. Biophys. J. 1997;73:1717–1727. doi: 10.1016/S0006-3495(97)78203-1. [DOI] [PMC free article] [PubMed] [Google Scholar]
- 20.Ben-Tal N., Honig B., Peitzsch R.M. Binding of small basic peptides to membranes containing acidic lipids: theoretical models and experimental results. Biophys. J. 1996;71:561–575. doi: 10.1016/S0006-3495(96)79280-9. [DOI] [PMC free article] [PubMed] [Google Scholar]
- 21.Bradshaw J.P., Bushby R.J., Giles C.C.D., Saunders M.R. Orientation of the headgroup of phosphatidylinositol in a model biomembrane as determined by neutron diffraction. Biochemistry. 1999;38:8393–8401. doi: 10.1021/bi990338+. [DOI] [PubMed] [Google Scholar]
- 22.Diraviyam K., Stahelin R., Cho W., Murray D. Computer modeling of the membrane interaction of FYVE domains. J. Mol. Biol. 2003;328:721–736. doi: 10.1016/s0022-2836(03)00325-5. [DOI] [PubMed] [Google Scholar]
- 23.Murray D., Honig B. Electrostatic control of the membrane targeting of C2 domains. Mol. Cell. 2002;9:145–154. doi: 10.1016/s1097-2765(01)00426-9. [DOI] [PubMed] [Google Scholar]
- 24.Murray D., Matsumoto L.H., Buser C.A., Tsang J., Sigal C.T. Electrostatics and the membrane association of Src: theory and experiment. Biochemistry. 1998;37:2145–2159. doi: 10.1021/bi972012b. [DOI] [PubMed] [Google Scholar]
- 25.Bradshaw J.P., Bushby R.J., Giles C.C.D., Saunders M.R., Reid D.G. Neutron diffraction reveals the orientation of the headgroup of inositol lipids in model membranes. Nat. Struct. Biol. 1996;3:125–127. doi: 10.1038/nsb0296-125. [DOI] [PubMed] [Google Scholar]
- 26.Fisher S.K., Heacock A.M., Agranoff B.W. Inositol lipids and signal transduction in the nervous system—an update. J. Neurochem. 1992;58:18–38. doi: 10.1111/j.1471-4159.1992.tb09273.x. [DOI] [PubMed] [Google Scholar]
- 27.Martinez-Seara H., Rog T., Pasenkiewicz-Gierula M., Vattulainen I., Karttunen M. Effect of double bond position on lipid bilayer properties: insight through atomistic simulations. J. Phys. Chem. B. 2007;111:1162–1168. doi: 10.1021/jp071894d. [DOI] [PubMed] [Google Scholar]
- 28.Skibinsky A., Venable R.M., Pastor R.W. A molecular dynamics study of the response of lipid bilayers and monolayers to trehalose. Biophys. J. 2005;89:4111–4121. doi: 10.1529/biophysj.105.065953. [DOI] [PMC free article] [PubMed] [Google Scholar]
- 29.Zhang Y.H., Feller S.E., Brooks B.R., Pastor R.W. Computer-simulation of liquid/liquid interfaces. 1. Theory and application to octane/water. J. Chem. Phys. 1995;103:10252–10266. [Google Scholar]
- 30.Feller S.E., Zhang Y.H., Pastor R.W. Computer-simulation of liquid/liquid interfaces. 2. Surface-tension area dependence of a bilayer and monolayer. J. Chem. Phys. 1995;103:10267–10276. [Google Scholar]
- 31.Kucerka N., Tristram-Nagle S., Nagle J.F. Structure of fully hydrated fluid phase lipid bilayers with monounsaturated chains. J. Membr. Biol. 2006;208:193–202. doi: 10.1007/s00232-005-7006-8. [DOI] [PubMed] [Google Scholar]
- 32.Brooks B.R., Bruccoleri R.E., Olafson B.D., States D.J., Swaminathan S. CHARMM - a program for macromolecular energy, minimization, and dynamics calculations. J. Comput. Chem. 1983;4:187–217. [Google Scholar]
- 33.Klauda J.B., Brooks B.R., MacKerell A.D., Venable R.M., Pastor R.W. An ab initio study on the torsional surface of alkanes and its effect on molecular simulations of alkanes and a DPPC bilayer. J. Phys. Chem. B. 2005;109:5300–5311. doi: 10.1021/jp0468096. [DOI] [PubMed] [Google Scholar]
- 34.Jorgensen W.L., Chandrasekhar J., Madura J.D., Impey R.W., Klein M.L. Comparison of simple potential functions for simulating liquid water. J. Chem. Phys. 1983;79:926–935. [Google Scholar]
- 35.Durell S.R., Brooks B.R., Bennaim A. Solvent-induced forces between 2 hydrophilic groups. J. Phys. Chem. 1994;98:2198–2202. [Google Scholar]
- 36.Feller S.E., MacKerell A.D. An improved empirical potential energy function for molecular dynamics simulations of phospholipids. J. Phys. Chem. B. 2000;104:7510–7515. [Google Scholar]
- 37.Klauda J.B., Venable R.M., MacKerell A.D., Pastor R.W. Considerations for lipid force field development. In: Feller S.E., editor. Current Topics in Membranes: Computational Modeling of Membrane Bilayers. Vol. 60. Elsevier; Amsterdam: 2008. pp. 1–48. [Google Scholar]
- 38.Klauda J.B., Roberts M.F., Redfield A.G., Brooks B.R., Pastor R.W. Rotation of lipids in membranes: molecular dynamics simulation, P-31 spin-lattice relaxation, and rigid-body dynamics. Biophys. J. 2008;94:3074–3083. doi: 10.1529/biophysj.107.121806. [DOI] [PMC free article] [PubMed] [Google Scholar]
- 39.Feller S.E., Gawrisch K., MacKerell A.D. Polyunsaturated fatty acids in lipid bilayers: intrinsic and environmental contributions to their unique physical properties. J. Am. Chem. Soc. 2002;124:318–326. doi: 10.1021/ja0118340. [DOI] [PubMed] [Google Scholar]
- 40.Darden T., York D., Pedersen L. Particle mesh Ewald—an N.Log(N) method for Ewald sums in large systems. J. Chem. Phys. 1993;98:10089–10092. [Google Scholar]
- 41.Ryckaert J.P., Ciccotti G., Berendsen H.J.C. Numerical integration of Cartesian equations of motion of a system with constraints—molecular dynamics of N-alkanes. J. Comput. Phys. 1977;23:327–341. [Google Scholar]
- 42.Gallagher K., Sharp K. Electrostatic contributions to heat capacity changes of DNA-ligand binding. Biophys. J. 1998;75:769–776. doi: 10.1016/S0006-3495(98)77566-6. [DOI] [PMC free article] [PubMed] [Google Scholar]
- 43.Peitzsch R.M., Eisenberg M., Sharp K.A., McLaughlin S. Calculations of the electrostatic potential adjacent to model phospholipid bilayers. Biophys. J. 1995;68:729–738. doi: 10.1016/S0006-3495(95)80253-5. [DOI] [PMC free article] [PubMed] [Google Scholar]
- 44.Sharp K.A., Honig B. Calculating total electrostatic energies with the nonlinear Poisson-Boltzmann equation. J. Phys. Chem. 1990;94:7684–7692. [Google Scholar]
- 45.Klauda J.B., Kucerka N., Brooks B.R., Pastor R.W., Nagle J.F. Simulation-based methods for interpreting X-ray data from lipid bilayers. Biophys. J. 2006;90:2796–2807. doi: 10.1529/biophysj.105.075697. [DOI] [PMC free article] [PubMed] [Google Scholar]
- 46.Freyssingeas E., Roux D., Nallet F. The effect of water thickness on the bending rigidity of inverted bilayers. J. Phys. Condens. Matter. 1996;8:2801–2806. [Google Scholar]
- 47.Lee S., Song Y., Baker N.A. Molecular dynamics simulations of asymmetric NaCl and KCl solutions separated by phosphatidylcholine bilayers: potential drops and structural changes induced by strong Na1-lipid interactions and finite size effects. Biophys. J. 2008;94:3565–3576. doi: 10.1529/biophysj.107.116335. [DOI] [PMC free article] [PubMed] [Google Scholar]
- 48.Klauda J.B., Brooks B.R., Pastor R.W. Dynamical motions of lipids and a finite size effect in simulations of bilayers. J. Chem. Phys. 2006;125:144710. doi: 10.1063/1.2354486. [DOI] [PMC free article] [PubMed] [Google Scholar]
- 49.Gambhir A., Hangyas-Mihalyne G., Zaitseva I., Cafiso D.S., Wang J.Y. Electrostatic sequestration of PIP2 on phospholipid membranes by basic/aromatic regions of proteins. Biophys. J. 2004;86:2188–2207. doi: 10.1016/S0006-3495(04)74278-2. [DOI] [PMC free article] [PubMed] [Google Scholar]
- 50.Mulgrew-Nesbitt A., Diraviyam K., Wang J.Y., Singh S., Murray P. The role of electrostatics in protein-membrane interactions. Biochim. Biophys. Acta. 2006;1761:812–826. doi: 10.1016/j.bbalip.2006.07.002. [DOI] [PubMed] [Google Scholar]
- 51.Lemmon M.A. Phosphoinositide recognition domains. Traffic. 2003;4:201–213. doi: 10.1034/j.1600-0854.2004.00071.x. [DOI] [PubMed] [Google Scholar]
- 52.Petrey D., Honig B. GRASP2: visualization, surface properties, and electrostatics of macromolecular structures and sequences. Methods Enzymol. 2003;374:492–509. doi: 10.1016/S0076-6879(03)74021-X. [DOI] [PubMed] [Google Scholar]