

Abstract
Accessibility to DNA wrapped in nucleosomes is essential for nuclear processes such as DNA transcription. Large conformational changes in nucleosome structure are required to facilitate protein binding to target sites within nucleosomal DNA. Transient unwrapping of DNA from nucleosome ends can provide an intrinsic exposure of wrapped DNA, allowing proteins to bind DNA that would otherwise be occluded in the nucleosome. The molecular details underlying these mechanisms remain to be resolved. Here we show how DNA unwrapping occurs progressively from both nucleosome ends. We performed single-pair fluorescence resonance energy transfer (spFRET) spectroscopy with alternating laser excitation (ALEX) on nucleosomes either in free solution or confined in a gel after PAGE separation. We combined ALEX-spFRET with a correlation analysis on selected bursts of fluorescence, to resolve a variety of unwrapped nucleosome conformations. The experiments reveal that nucleosomes are unwrapped with an equilibrium constant of ∼0.2–0.6 at nucleosome ends and ∼0.1 at a location 27 basepairs inside the nucleosome, but still remain stably associated. Our findings, obtained using a powerful combination of single-molecule fluorescence techniques and gel electrophoresis, emphasize the delicate interplay between DNA accessibility and condensation in chromatin.
Introduction
DNA-protein complexes are transient by nature. To understand the reaction mechanisms that control DNA metabolism it is important to relate the association and dissociation kinetics of these complexes to the conformational changes that are associated with DNA binding. All transactions involving eukaryotic DNA occur in the context of the nucleosome, the ubiquitous DNA-protein complex that forms the fundamental unit of chromatin organization. A nucleosome core particle consists of 50 nm of DNA wrapped in nearly two turns around a histone-octamer core (1). Since nucleosomes sterically hinder enzymes that bind the nucleosomal DNA, they play an important role in gene regulation (2). Large conformational changes in nucleosome structure are required to accommodate enzymatic processes such as transcription, replication, and repair. A variety of mechanisms that promote accessibility to nucleosomal DNA has been identified (3,4), such as nucleosome repositioning, transient DNA unwrapping, or breathing, and exchange of histone dimers between nucleosomes. However, the molecular mechanisms underlying these processes remain to be resolved.
Fluorescence resonance energy transfer (FRET) is ideally suited to studying nucleosome structure and dynamics, since it is sensitive to conformational changes of 2–10 nm (5). Li and Widom used ensemble FRET experiments to demonstrate that under physiological conditions the end of nucleosomal DNA transiently unwraps and rewraps from the histone core with an equilibrium constant Keq of 0.02–0.1 (6). The dynamic opening and closing of the nucleosome ends is termed DNA breathing. With additional fluorescence correlation spectroscopy (FCS) and stopped-flow FRET experiments, Li et al. measured the unwrapping and rewrapping rates of the DNA breathing process (7). Because of the ensemble nature of their experiments, Li et al. could not resolve whether DNA unwraps in a single step as assumed in their model, or through multiple intermediate states, as speculated by Anderson and Widom (8).
On the single-molecule level, single-pair FRET (spFRET) has the power to probe the conformational distribution and dynamics of an ensemble of molecules, and other heterogeneities with unprecedented detail (9). In recent years, spFRET experiments provided valuable information on nucleosome destabilization and disassembly, and partially resolved structural heterogeneity in the nucleosome (10–14). However, these studies used single-wavelength excitation, and therefore FRET populations attributed to dissociated nucleosomes could not be discriminated from incompletely labeled donor-only or free DNA molecules, which display identical FRET. In addition, it remained unclear whether the DNA unwraps symmetrically from both nucleosome ends and whether intermediate states exist in this process. Finally, it is not straightforward how to relate the irreversible nucleosome disassembly studied in the latter experiments to the reversible nucleosome breathing kinetics observed by Li and Widom (6). Therefore, a comprehensive study of DNA dynamics in nucleosomes should both discriminate substoichiometric labeling and nucleosome disassembly.
Many of the uncertainties in the analysis described in the previous paragraph are resolved by applying alternating laser excitation (ALEX) (15). ALEX complements the applicability of spFRET by simultaneously reporting on fluorophore stoichiometry (S) and FRET efficiency (E) of the molecule of interest. This additional information is obtained by rapidly alternating donor and acceptor excitation. ALEX also allows the determination of correction factors for the detection efficiencies and quantum yields of donor and acceptor needed for accurate FRET measurements (16). Thus, using ALEX it is possible to further disentangle the heterogeneity that is inherent in nucleosome studies.
In previous studies, we observed and quantified DNA breathing dynamics on individual immobilized nucleosomes imaged with wide-field TIRF microscopy (17,18). We employed ALEX to separate photoblinking and photobleaching artifacts from true conformational changes, and obtained unwrapping and rewrapping rates similar to Li et al. (7). Despite careful optimization of sample immobilization and surface passivation, we found that nucleosome immobilization affected the conformational distribution and disrupted a large fraction of the nucleosomes (18).
Here, we prevent immobilization artifacts by measuring ALEX-spFRET on free, diffusing nucleosomes using confocal microscopy. Because the observation time is limited to the diffusion time of a nucleosome in the confocal volume, it is necessary to acquire statistics over a large number of different molecules. This inevitably results in mixing differently wrapped DNA molecules, despite ALEX selection. To separate properly folded nucleosomes from substoichiometric histone-DNA assemblies as well as increase the diffusion time, allowing for longer observation time and better statistics of each molecule, we observed nucleosomes in a poly-acrylamide gel after electrophoresis. Using this strategy, we compared equilibrium constants of DNA breathing at different locations within the nucleosome, and studied a variety of nucleosome conformations with a correlation analysis on selected bursts.
Materials and Methods
Preparation of DNA and nucleosomes
Using salt dialysis, we reconstituted nucleosomes on three DNA templates with a Cy3B-ATTO647N FRET pair (Förster radius R0 ∼ 5.5 nm) at either of the nucleosome extremes (labels at position X, or at position Z), and a position-27 basepair (bp) from one nucleosome end (labels at position Y), as shown in Fig. 1 a. Unless stated otherwise, experiments in this work were performed with nucleosomes labeled at position Y, which we refer to as internally labeled in this work. Details on nucleosome reconstitution and sample preparation are given in the Supporting Material.
Figure 1.
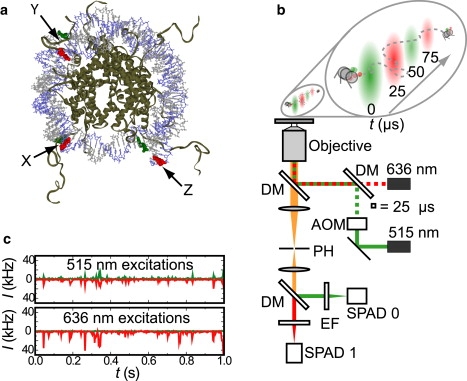
Experimental system and setup. (a) A FRET-labeled nucleosome. X, Y, and Z indicate the locations of various FRET labeling positions used in this work. (b) ALEX-FRET fluorescence microscope. DM, dichroic mirror; AOM, acousto-optical modulator; PH, pinhole; EF, emission filter; and SPAD, single-photon avalanche diode. (c) Typical fluorescence intensity time-traces of the four different photon streams acquired with the setup in panel b.
Single molecule fluorescence microscopy
Single nucleosomes were imaged with a home-built confocal microscope equipped with a 60× water-immersion microscope objective (NA = 1.2, Olympus, Zoeterwoude, The Netherlands), as schematically depicted in Fig. 1 b. A 515-nm diode-pumped, solid-state laser (Cobolt, Solna, Sweden) and a 636-nm diode laser (Power Technology, Little Rock, AR) were used as excitation sources. The lasers were alternated at 20 kHz by analog modulation, either directly (636 nm) or with an AOM (515 nm; Isomet, Springfield, VA). The beams were spatially filtered with a single-mode fiber, and focused 25 μm above the glass-buffer interface by the objective. The confocal volumes were 1.5 fL and 2.0 fL for 515-nm and 636-nm excitation, respectively, as determined from FCS calibration experiments on 100-nm tetraspeck fluorescent beads (Invitrogen, Breda, The Netherlands). The excitation power was 80 μW for 515-nm excitation, and 50 μW for 636-nm excitation. The collected fluorescence was spatially filtered with a 50-μm pinhole in the image plane, and was split into a donor and an acceptor channel by a dichroic mirror (640dcxr, Chroma, Rockingham, VT). The fluorescence was filtered with emission filters (hq570/100m for the donor channel, hq700/75m for the acceptor channel; Chroma) to minimize crosstalk, and was imaged on the active area of single photon avalanche photodiodes (model No. SPCM AQR-14; Perkin-Elmer, Waltham, MA). The photodiodes were read out with a TimeHarp 200-photon counting board (Picoquant, Berlin, Germany). In a typical experiment, data was collected for 10 min and 1000–5000 bursts of fluorescence were detected.
Data analysis
Photon arrival times in the donor and acceptor channel were sorted according to excitation period, resulting in four photon streams:
, donor emission during green excitation
, acceptor emission during green excitation
, donor emission during red excitation
, acceptor emission during red excitation
Example data is shown in Fig. 1 c. The total fluorescence emission was analyzed with a burst detection scheme (19). A burst was detected if a minimum of 100 photons arrived subsequently, with a maximum interphoton time of 100 μs. For each burst, we calculated the apparent FRET efficiency E (also known as proximity ratio),
| (1) |
and the apparent label stoichiometry S,
| (2) |
where , , and are number of photons in the burst from the different photon streams, and γ = ΦAηA/ΦDηD is a parameter to correct for photophysical properties of the dyes. ΦA and ΦD are acceptor and donor quantum yield, and ηA and ηD are acceptor and donor detector efficiency, respectively. Since we only compared relative changes, γ was set to unity. The excitation powers were chosen such that for doubly labeled molecules, resulting in S ∼0.5. E and S were not corrected for donor crosstalk to the acceptor channel (11%) and direct excitation of the acceptor fluorophore (<2%). The relative size of a certain population was determined from the number of bursts matching defined E, S-thresholds. The equilibrium constant Keq for DNA unwrapping was calculated as
| (3) |
Correlation curves G(τ),
| (4) |
where I1(t), I2(t) are the photon streams of interest, and τ is the lag time, were computed with the multi-tau algorithm described by Wahl et al. (20). The correlation curves were smoothed by averaging out the periodic contribution that comes from alternating excitation, and were corrected for afterpulsing as described (21). Correlation curves were constructed from photons during 515-nm excitation, selected from bursts matching defined E, S criteria. Although in principle any auto- or cross correlation (e.g., or ) curve can be computed from the selected photons, we used a particular autocorrelation function . This ensures that bursts are weighted based on their intensity and not on their FRET efficiency, facilitating a comparison of the correlation of different E-species.
Results
ALEX-spFRET resolves nucleosome sample heterogeneity
We characterized the label stoichiometry and FRET efficiency of different populations in the nucleosome sample, and we performed reference experiments described in Fig. S1 and Table S1 in the Supporting Material to determine appropriate E, S-thresholds between the different species. The 2D E, S-histogram obtained from reconstituted nucleosomes labeled at position Y is shown in Fig. 2 a. We observed a distinct, dominant population of doubly labeled and fully wrapped nucleosomes (E > 0.25, S ∼ 0.5, 78%), with E = 0.63 ± 0.22, and S = 0.45 ± 0.17. Three other populations could be clearly resolved: doubly labeled unreconstituted DNA or unwrapped nucleosomes (E < 0.25, S ∼ 0.5, 8%), and photobleached or partially labeled D-only (S > 0.8, 8%,) and A-only (S < 0.2, 6%) populations. These single-molecule characteristics agree well with results obtained from separate bulk experiments (data not shown): using UV-VIS absorption spectroscopy, bulk fluorescence spectra, and PAGE, we deduced that the sample consisted of ∼80% doubly labeled reconstituted nucleosomes with E = 0.75, ∼8% doubly labeled unreconstituted DNA, and incompletely labeled species (∼5% for D-only or A-only). These results demonstrate a powerful advantage of combining spFRET with ALEX: a single experiment is sufficient to resolve the heterogeneity in the sample.
Figure 2.
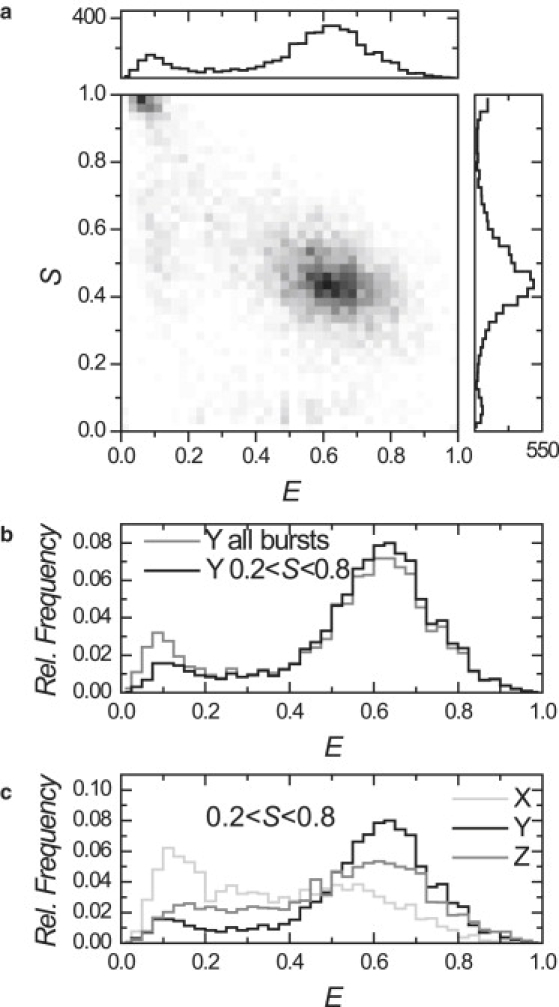
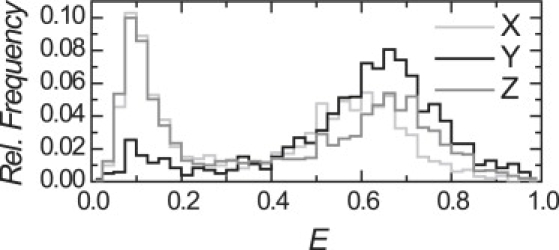
E, S footprint of nucleosomes. (a) Two-dimensional E, S histogram of reconstituted nucleosomes, label position Y. (b) FRET histogram of all bursts (shaded) and of doubly labeled bursts (solid). The low FRET population is reduced considerably by filtering out D-only species. (c) D-only filtered E-histograms for label positions X, Y, and Z in the nucleosome. Note the considerable population at intermediate FRET efficiency.
ALEX selection resolves DNA breathing in nucleosomes
In the FRET histogram constructed from all detected bursts (similar to the case of single-wavelength excitation), 16% of the bursts falls in the E < 0.25 (low FRET) population, as shown in Fig. 2 b. When only bursts are selected that contain both donor and acceptor labels, 9% fall in this population that we can attribute to free DNA or unwrapped nucleosomes present in the sample.
This D-only correction enabled us to characterize and compare nucleosome reconstitutions at different label positions X, Y, and Z within their one-dimensional E-histograms, unaffected by bleaching and labeling artifacts, which amounts to 40% of the low FRET population. We compared the resulting selected FRET histograms shown in Fig. 2 c. The results are summarized in Table 1. For each reconstituted nucleosome (X, Y, and Z), the size of the low FRET population agreed well with the observed fraction of unreconstituted free DNA in PAGE experiments. Each wrapped nucleosome population showed a clear peak, with slightly different FRET efficiencies that reflect the different label attachment positions for the FRET pairs on the different DNA templates. Importantly, each distribution showed a pronounced tail extending from the peak toward intermediate FRET values. The histogram could not be fitted with a sum of two Gaussian distributions, indicating the presence of a third population of considerable size. These intermediate FRET values cannot be explained by the simultaneous transit of multiple species through the detection volume, since the concentration is low enough (100–200 pM) that the presence of more than a single molecule in the spot is highly improbable. Control measurements at 20 pM concentration showed the same intermediate FRET population. Here we assign the tails in the FRET distribution to molecules in which spontaneous unwrapping or rewrapping of DNA (6) occurred during their transit through the excitation volume. The observed intermediate FRET value corresponds to ∼10 bp unwrapped DNA from nucleosomes X and Z, and ∼35 bp from nucleosome Y. The smaller fraction in Y this suggests that the first ∼10–35 bp of the nucleosomal DNA progressively unwrap, starting from either end. It must be noted that the amount of unwrapped DNA mentioned here is a rough estimate, given the many assumptions needed to convert a FRET efficiency to a distance (e.g., freely rotating dyes, γ = 1, the conformation of the unwrapped DNA). To avoid this complexity, we used different label positions to monitor the unwrapping of nucleosomal DNA.
Table 1.
Comparison of FRET characteristics and high (E > 0.4), intermediate (0.25 < E < 0.4), and low (E < 0.25) FRET populations of end-labeled (X,Z) and internally labeled (Y) nucleosome reconstitutions, based on the FRET histograms in Fig. 2c
| Nucleosome | E < 0.25 | 0.25 < E < 0.4 | E > 0.4 | Keq | E of main population |
|---|---|---|---|---|---|
| X | 36% | 19% | 45% | 0.37 | 0.53 ± 0.3 |
| Y | 8% | 6% | 86% | 0.07 | 0.63 ± 0.22 |
| Z | 17% | 13% | 70% | 0.19 | 0.61 ± 0.27 |
The size of the distribution allowed us to determine the equilibrium constant for DNA unwrapping. The equilibrium constants we observed were Keq = 0.19–0.37 for end-labeled nucleosomes Z and X, and Keq = 0.07 for internally labeled nucleosomes Y. The value of the equilibrium constant was only marginally dependent on the thresholds between the different populations, or on the thresholds used for burst detection: the number of bursts close to the thresholds E, S-values was small, and the relative size of the populations only changed a few percent when using different burst detection criteria (50 instead of 100 photons per burst, or 150 instead of 100 μs interphoton time).
Monovalent salt promotes DNA unwrapping and nucleosome disassembly
Although the low FRET population agrees well with the fraction of unreconstituted DNA, it may also indicate dissociation of the nucleosomes in the sample, as reported before (10). Kelbauskas et al. (13) reported that nucleosomes are less stable at physiological conditions that contain >100 mM NaCl than at the low salt concentrations used in many studies of nucleosome dynamics (7,13). To follow the structural integrity of the nucleosomes, we analyzed E, S-populations for different salt concentrations in time. We quantified the number of bursts in each population for 30 s bins and compared the relative size of each fraction as a function of time. The fraction of intact nucleosomes was monitored by evaluating the ratio of the number of E > 0.25 to all doubly labeled molecules, as shown in Fig. 3.
Figure 3.
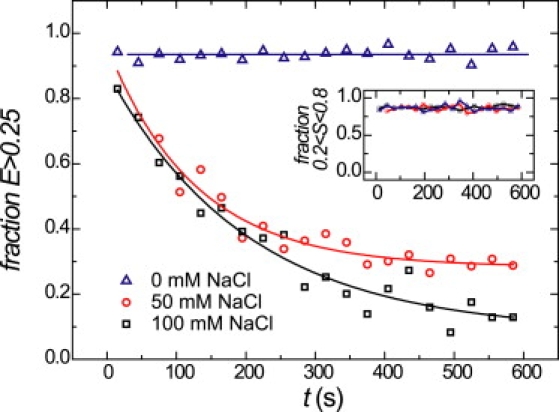
Nucleosome disassembly kinetics for several salt concentrations in time. The fraction of intact nucleosomes (E > 0.25) in time for different monovalent salt concentrations, buffered with 10 mM Tris.HCl (pH 8). The lines are linear (0 mM NaCl) or exponential (50 and 100 mM NaCl) fits to the data. (Inset) The fraction of doubly labeled (0.2 < S < 0.8) molecules in time. For each salt concentration tested, this fraction is constant over time.
In 10 mM Tris.HCl, the fraction of intact nucleosomes was constant over time, and was equal to the reconstitution yield as determined with PAGE (90%). In contrast, at 50 and 100 mM NaCl (both + 10 mM Tris.HCl), we observed pronounced nucleosome disassembly: the fraction of intact nucleosomes decreased exponentially with a decay time of 200 ± 30 s after the addition of NaCl. At 100 mM NaCl, only 10% of the nucleosomes remained folded, whereas 30% was retained in 50 mM NaCl. The disassembly process was irreversible upon subsequent lowering of the salt concentration. A comparison of the FRET distributions for 0 mM and 50–100 mM NaCl was not straightforward, because of this instability. The fraction of bursts with intermediate E compared to those with high E was on average higher (15%) at 50–100 mM than at 0 mM NaCl (7%), indicating that breathing dynamics was promoted at higher salt conditions. The fraction of doubly labeled species did not change over time for all salt concentrations, as shown in Fig. 3 (inset). This indicates that photobleached species did not accumulate near the detection volume, but were continuously redistributed by diffusion.
In summary, 50–100 mM monovalent salt promotes both reversible nucleosome breathing kinetics and irreversible nucleosome disassembly processes at low nucleosome concentration.
Fluorescence correlation analysis of selected nucleosome populations shows unwrapping at low FRET
By performing FCS, ALEX-spFRET allowed us to monitor the conformation of nucleosomes. FCS was applied to selected bursts to determine the diffusion time, which is directly related to the hydrodynamic radius of the nucleosomes in the selected population. We first mapped out the composition of the sample with ALEX. To characterize the hydrodynamic radius of a population matching defined criteria in E and S, we performed FCS on doubly labeled bursts in a defined E-range. We calculated the autocorrelation curve G(τ) from all photons from both detection channels during green excitation, and separated three populations: E > 0.25 (all nucleosomes), E < 0.25 (free DNA or unwrapped nucleosomes), and 0.25 < E < 0.4 (partially unwrapped nucleosomes), shown in Fig. 4.
Figure 4.
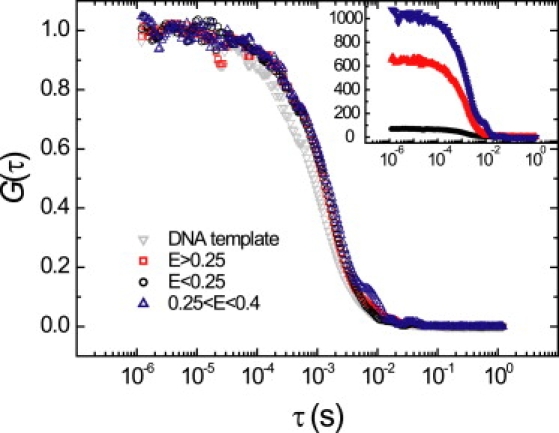
Correlation curves. (Inset) Unscaled correlation curves of selected bursts in a nucleosome sample, and of a free DNA sample. The nucleosomes show an increased diffusion time compared to the DNA. Nucleosome fractions can only be separated based on FRET; the diffusion time in free solution is unaffected by conformational changes within the nucleosome.
The individual correlation curves showed a qualitatively similar decay as FCS diffusion curves reported in Hess et al. (22) that were not composed of selected E, S-bursts. In the limit of small correlation times τ, G was constant with an amplitude that was inversely related to the number of bursts (inset in Fig. 4). For larger lag times, G decreased at τ = 1 ms toward its final value G = 0. We determined the time-lag at half-amplitude () as the characteristic diffusion time from an FCS curve from selected bursts. Uncertainties were estimated from the change in corresponding to a change of one standard deviation in the initial amplitude of the correlation curve. The standard deviation in the amplitude was calculated using a bootstrap method, i.e., by dividing one measurement in smaller data packages analogous to Wohland et al. (23). The characteristic times were ms, ms, and ms for E > 0.25, E < 0.25, and 0.25 < E < 0.4, respectively. The obtained values were the same within the statistical uncertainty, and hence the three populations were indistinguishable based on diffusion. Control measurements on a DNA template sample yielded ms, significantly shorter than any of the populations in the nucleosome sample. This shows that the E < 0.25 fraction in the nucleosome sample not only contains unreconstituted DNA, but also a significant amount of unwrapped nucleosomes with larger hydrodynamic radius.
The correlation curves of the nucleosome species did not follow a simple diffusion model typically fitted to FCS curves. We further noted that the selection process results in reduced data-sets that produce a smaller signal/noise ratio. The benefits of selecting specific species in a heterogeneous sample may, in certain applications, outweigh the reduced signal/noise ratio associated with the combination of ALEX-spFRET-FCS. In summary, using FCS on selected populations, we deduced that the low FRET population contains a significant amount of unwrapped nucleosomes, apart from the unreconstituted DNA.
Gel-separated nucleosomes are transiently unwrapped in a progressive way from both nucleosome ends
To better resolve difference in nucleosome conformation, we used native PAGE to separate nucleosomes from DNA. Nucleosomes confined in a gel are expected to diffuse slower, resulting in a longer observation time, better photon statistics, and enhanced sensitivity to molecular conformation. An additional advantage of this approach is that virtual E, S-sorting is supplemented by sorting based on gel separation (24). This results in a well-defined nucleosome band, one not contaminated with free, unreconstituted DNA and nucleosome aggregates (two species that cannot be separated based on S alone).
Low resolution fluorescence images of the gel are shown in Fig. 5, a–d (left panels). All lanes with the nucleosome reconstitutions showed a sharp band of nucleosomes which migrated slower through the gel than the free DNA band. The ratio of nucleosomes to free DNA was 8:1 for the reconstitution at label position X, and 9:1 for the reconstitutions at label positions Y and Z. The nucleosomes migrated in a sharp band, indicating that dilution-driven dissociation was not occurring during gel electrophoresis (∼3 h), despite the elevated ionic strength of 40 mM in the gel. Trace amounts of fluorescence were detected outside these two bands, indicating that aggregation or formation of nonnucleosomal particles was small, and that these were successfully separated.
Figure 5.
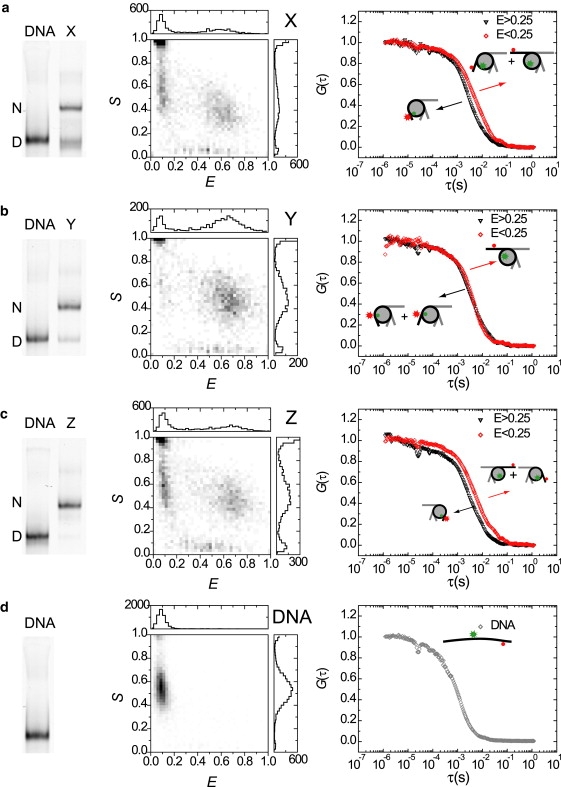
ALEX-spFRET spectroscopy on gel-separated nucleosomes (a) X, (b) Y, (c) Z, and (d) DNA from template Z. (Left panels) Fluorescence image (acceptor excitation) of PAGE analysis of reconstituted nucleosomes and the corresponding DNA templates. N, nucleosome band, D, DNA band. (Middle panels) E, S-histograms of ALEX-spFRET experiments in gel in the nucleosome bands, and DNA band Z depicted. A low FRET peak can be observed in all nucleosome bands, which points at progressive DNA unwrapping from the nucleosome ends. (Right panels) Burstwise FCS analysis on nucleosome populations in gel. For nucleosomes X and Z, a clear difference in correlation time can be seen for different FRET efficiencies, reflecting different conformations. For nucleosome Y, the difference is smaller. All nucleosome populations diffuse significantly slower than the DNA.
The fluorescence images allow for a quantitative measurement of the FRET efficiency of purified nucleosomes. However, transient nucleosome conformations cannot be resolved in these images. To detect these, we applied ALEX-spFRET experiments in excised gel bands of interest. The corresponding two-dimensional E, S histograms are shown in the middle panels in Fig. 5, a–d. We observed a clear high FRET population in all nucleosome bands, with the same characteristic E and S values as those observed in free solution. Surprisingly, in all nucleosome bands we observed a rather large fraction of bursts with S = 0.5, E < 0.25, amounting to 38% for the end-labeled nucleosomes X and Z, and 10% for internally labeled nucleosome Y after correction for D-only species (Fig. 6 and Table 2). This fraction could not originate from free DNA and substoichiometric histone-DNA complexes, since these result in different bands in the gel. Even though the ionic strength of the buffer was 40 mM, we did not observe irreversible nucleosome disassembly during the experiment (10 min per gel band, ∼1 h in total) in the time evolution of the E, S-histograms, in contrast to similar experiments in free solution. Therefore, this fraction probably reflects the nucleosomes that temporarily lose FRET by transient unwrapping. The unwrapped fractions had the same size for nucleosomes X and Z, indicating that DNA unwrapping is symmetric from both ends. Since also a considerably smaller unwrapped fraction was observed in internally labeled nucleosomes Y, we conclude that DNA unwrapping occurs progressively with a lower probability as the DNA is located further in the nucleosome. We again observed a significant fraction with intermediate FRET values (20% for X and Z, 10% for Y), that we assigned to either partially unwrapped nucleosomes, or transient unwrapping and rewrapping events during the diffusion through the confocal excitation volume.
Figure 6.
D-only corrected E-histograms for nucleosomes X, Y, and Z in gel. A low FRET population can clearly be observed at all three labeling positions. The low FRET population is 38% for X and Z, and 10% for Y, indicating progressive and pronounced nucleosome unwrapping from both ends.
Table 2.
Correlation analysis of nucleosome populations in gel
| Sample | Wrapped fraction |
Unwrapped fraction |
Keq | ||
|---|---|---|---|---|---|
| (ms) | Fraction size | (ms) | Fraction size | ||
| X | 2.7 ± 0.3 | 61% | 4.5 ± 0.8 | 39% | 0.6 |
| Y | 3.1 ± 0.3 | 90% | 3.5 ± 1.2 | 10% | 0.1 |
| Z | 2.7 ± 0.3 | 62% | 4.7 ± 0.8 | 38% | 0.6 |
| DNA | — | — | 0.90 ± 0.05 | 98% | — |
In all gel experiments, A-only and D-only populations (12% and 20%, respectively) were more pronounced than in free solution (8% and 10%, respectively). Since nucleosomes diffuse slower in the gel, the attached FRET pair is longer exposed to the excitation light, increasing the probability that either fluorophore bleaches. ALEX allows a label stoichiometry-based sorting, and hence the presence of such bleached species did not interfere with the detection of correctly labeled low FRET species.
To gain more insight into the underlying molecular conformations, we analyzed the diffusion characteristics of the various fractions (E > 0.25 and E < 0.25) with an FCS analysis on selected bursts. The results are shown in Fig. 5 (right panels), and summarized in Table 2. The correlation times for nucleosomes were approximately three-times longer in gel than in free solution, reflecting a slower diffusion process. Furthermore, the bursts in the nucleosomes bands showed considerably longer correlation times, showing that gel-based FCS has a larger resolving power than solution-based FCS. For all nucleosomes (i.e., X, Y, and Z), the unwrapped nucleosomes diffused slower than nucleosomes with E > 0.25. This is consistent with the predicted larger hydrodynamic radius of unwrapped nucleosomes as compared to the more compact fully wrapped nucleosomes, schematically depicted in the cartoons in Fig. 5, a–c (right panels). We note that nucleosomes that show FRET can still represent a heterogeneous population: although the FRET pair only reports on unwrapping at the side where it is located, X and Z feature symmetric unwrapping behavior. Therefore, in terms of hydrodynamic radius it can be expected that a fraction of nucleosomes is unwrapped on either side. How unwrapping of one end of the nucleosome affects the DNA at the other end remains an open question, however. Nucleosomes Y with E > 0.25 were anticipated to be partially unwrapped from the nucleosome end in 28% of the bursts, resulting in a more open structure and larger hydrodynamic radius, and therefore in slower diffusion than for completely wrapped end-labeled nucleosomes. The observed difference in diffusion time is comparable to the uncertainty, however, and better statistics are needed to confirm whether this difference is significant. Nucleosomes Y with E < 0.25 are unwrapped for at least 30-40 bp in 10% of the bursts (Keq ∼0.1). Nucleosomes X and Z without FRET are unwrapped in 38% of the bursts (Keq ∼0.6), and must therefore be either unwrapped for 10–20 bp (28%, Keq ∼0.4) or for 30-40 bp (10%, Keq ∼0.1). Surprisingly, this fraction showed the slowest diffusion of all fractions tested, even though the suggested conformation from the FRET signature does not correspond to the most unwrapped and extended state of the nucleosome. The differences in correlation times between nucleosome fractions can probably be more completely understood in the light of gel-retardation studies (25).
In conclusion, the combined PAGE-ALEX-spFRET-FCS data resolve an even more accessible set of conformations than obtained in solution.
Discussion and Conclusion
Combining PAGE, ALEX-spFRET, and FCS
To resolve the intrinsic dynamic heterogeneity of nucleosomes, it was necessary to combine PAGE-ALEX-spFRET and FCS in a single experiment. Each technique complements the others and here we show that the techniques can be performed simultaneously on the same sample. The combination ALEX-spFRET has proven itself capable of accurately mapping stoichiometric heterogeneity, allowing for exclusion of the unwanted D-only fraction from data analysis (see, e.g., Kapanidis et al. (26)). Here, we used ALEX to exclude a photobleached D-only fraction from data analysis to allow for correct observation of low FRET populations. This D-only correction is even more essential for the experiments in gel because of increased photobleaching due to slower diffusion. ALEX-spFRET allowed us to strengthen the evidence for earlier conclusions obtained by others. We confirmed that breathing is enhanced at higher salt concentrations (6), that disassembly is promoted at higher salt and picomolar nucleosome concentration (12), that nucleosome ends are less stable than internal regions (14), and that broadening of the FRET histogram is indicative of nucleosome dynamics (11). Our new findings reveal that nucleosomes are unwrapped with a higher equilibrium constant than demonstrated earlier (6), but remain stably associated. Pronounced breathing does not directly result in disassembly of the nucleosome into substoichiometric DNA-histone complexes.
PAGE-ALEX-spFRET is a new and powerful combination of techniques whose potential has only recently been pointed out by Santoso et al. (24). We successfully used it to remove unreconstituted DNA, which interferes with a correct observation of unwrapped nucleosomes with low and intermediate FRET characteristics, from our data analysis. Optimized reconstitution protocols and titration reactions can minimize but never fully remove all free DNA; in the work presented by Gansen et al. (10) and in our work, a fraction of ∼10% free DNA is mentioned. Reconstitution reactions can be further purified with, for example, sucrose gradient ultracentrifugation (6,27), or PAGE with gel elution (28). This complicates sample preparation and does not necessarily result in a 100% pure nucleosome sample, as the conditions for purification may result in disassembly itself (28).
FCS analysis can be included with ALEX-spFRET spectroscopy and PAGE separation without any modifications of the experimental setup, since it only requires a correlation analysis of the detected photon streams to report on the diffusion behavior. Although photon selection criteria are common practice in FCS (e.g., based on the lifetime for time-gated FCS (29), or based on detection channel for a standard cross correlation), the correlation analysis on selected bursts presented here has not been reported before. By using bursts from a selected nucleosome population for FCS analysis, a diffusion time can be recovered that is directly related to the hydrodynamic radius of the population, which in turn depends on its conformation. Here we quantitatively compared correlation curves based on the , avoiding fitting of the curves with an analytical expression. A model that describes the correlation curve would need to encompass 1), how the burst-selection algorithm affects the photon streams and how this influences the shape of the curve; 2), anomalous diffusion of nucleosomes in gel (22); and 3), an accurate description of DNA breathing conformational changes including its kinetics. A comprehensive analysis of these contributions is beyond the scope of this study, but could potentially uncover more details.
The application of this combined PAGE-ALEX-spFRET-FCS approach is not limited to the study of nucleosomes, but can, in principle, be exploited to study a variety of heterogeneous systems. Any process involving transient DNA-protein conformations, such as the action of ATP-dependent remodeling enzymes on nucleosomes, is dynamic and heterogeneous in nature. Only a single set of experiments is needed to extract a wealth of information about the conformational distribution and dynamics underlying such DNA-protein interactions.
Progressive nucleosome unwrapping
The combined data for end-labeled and internally labeled nucleosomes, both in free solution and in gel, indicate that transient DNA unwrapping occurs progressively from both nucleosome ends. This is consistent with the DNA breathing model, where transient DNA release initiates at the nucleosome end and proceeds inward (30). Progressive unwrapping from both ends implies that even in a homogeneous nucleosome population a variety of nucleosome conformations exists simultaneously. This was confirmed here based on diffusion times determined with FCS. Though the 601-DNA sequence used for nucleosome reconstitutions in this work is not palindromic, we did not observe sequence-dependent DNA unwrapping from the nucleosome ends.
Our single-molecule observations of DNA breathing show much more pronounced unwrapping (Keq ∼0.1–0.6) than studies where DNA site exposure for different positions in the nucleosome was monitored using classical enzyme binding assays (Keq = 0.02–0.1 at the nucleosome ends (6,8)). This difference may in part result from differences in experimental conditions and nucleosome constructs. In particular, at the subnanomolar nucleosome concentrations used in this work, nucleosomes are known to be less stable because of weakened interactions with the H2A-H2B histone dimer that binds the region close to DNA ends (31), which is preceded by DNA breathing.
Unwrapping and rewrapping rates obtained by Li et al. (7) and by our previous work on immobilized nucleosomes (17,18) suggest that the lifetime of the unwrapped state is 10–50 ms. Fluctuations on this timescale cannot be resolved with our current approach, since the diffusion time is an order-of-magnitude smaller (∼1 ms) than the predicted fluctuations. Fluctuations caused by nucleosome dynamics will affect the FRET value and the width of the distribution for different populations in an E-histogram. The latter information can be used to extract information about how the breathing rates compare to the diffusion time (32). For example, since the experiments in gel reveal a clear low FRET population of unwrapped nucleosomes in the histogram, we deduce that no conformational fluctuations that broaden this peak occurred during diffusion through the confocal volume. This yields a lower limit (∼4.5 ms in gel) for the lifetime of the unwrapped state.
Disassembly of nucleosomes into substoichiometric histone-DNA complexes is increasingly recognized as a relevant process in chromatin structural maintenance (33). It vastly complicates the analysis of the nucleosome sample, because of the large number of possible conformations. Despite the pronounced DNA unwrapping far into the nucleosome, we did not observe irreversible nucleosome disassembly at low salt conditions or in the gel: the fraction of nucleosomes at low salt concentration in free solution experiments was the same as the fraction obtained from bulk experiments (within experimental error), and a sharp, stable band of nucleosomes in gel indicated that irreversible disassembly was absent. Nucleosome disassembly can be prevented by using high concentrations of unlabeled nucleosomes, as was demonstrated by Gansen et al. (10). This allowed us to perform experiments at physiological salt conditions in free solution (data not shown). In the experiments reported here, a gel matrix prevents dilution-driven nucleosome disassembly, possibly because of crowding. Crowded conditions may very well be physiologically relevant, since they closely resemble the situation in the cell nucleus.
In conclusion, our results show that the nucleosome is transiently unwrapped, but the histone proteins and the DNA remain stably associated. The nucleosome is more accessible to binding of regulatory proteins on the nucleosomal DNA than was shown previously (6). Our findings, obtained using a powerful combination of single-molecule fluorescence techniques and gel electrophoresis, emphasize the delicate interplay between DNA accessibility and condensation in chromatin. The method presented here is not restricted to the study of nucleosomes, but can be exploited to resolve the dynamics of other heterogeneous DNA-protein complexes as well.
Supporting Material
One figure and one table are available at http://www.biophysj.org/biophysj/supplemental/S0006-3495(09)00849-2.
Supporting Material
Acknowledgments
We thank Eyal Nir and Shimon Weiss for help with the realization of the ALEX-spFRET setup, Achillefs Kapanidis for stimulating discussions on ALEX-FRET experiments in gel, Andrew Routh and Daniela Rhodes for help with mononucleosome reconstitutions, and Alexander Gaiduk and Michel Orrit for helpful discussion on the correlation analysis.
This work is part of the research program of the Stichting voor Fundamenteel Onderzoek der Materie (FOM), which is financially supported by the Nederlandse Organisatie voor Wetenschappelijk Onderzoek (NWO).
References
- 1.Luger K., Mader A., Richmond R., Sargent D., Richmond T. Crystal structure of the nucleosome core particle at 2.8 Å resolution. Nature. 1997;389:251–260. doi: 10.1038/38444. [DOI] [PubMed] [Google Scholar]
- 2.Kornberg R., Lorch Y. Twenty-five years of the nucleosome, fundamental particle of the eukaryote chromosome. Cell. 1999;98:285–294. doi: 10.1016/s0092-8674(00)81958-3. [DOI] [PubMed] [Google Scholar]
- 3.Flaus A., Owen-Hughes T. Mechanisms for ATP-dependent chromatin remodeling: farewell to the tuna-can octamer? Curr. Opin. Genet. Dev. 2004;14:165–173. doi: 10.1016/j.gde.2004.01.007. [DOI] [PubMed] [Google Scholar]
- 4.Luger K. Dynamic nucleosomes. Chromosome Res. 2006;14:5–16. doi: 10.1007/s10577-005-1026-1. [DOI] [PubMed] [Google Scholar]
- 5.Clegg R. Fluorescence resonance energy transfer and nucleic acids. Methods Enzymol. 1992;211:353–388. doi: 10.1016/0076-6879(92)11020-j. [DOI] [PubMed] [Google Scholar]
- 6.Li G., Widom J. Nucleosomes facilitate their own invasion. Nat. Struct. Mol. Biol. 2004;11:763–769. doi: 10.1038/nsmb801. [DOI] [PubMed] [Google Scholar]
- 7.Li G., Levitus M., Bustamante C., Widom J. Rapid spontaneous accessibility of nucleosomal DNA. Nat. Struct. Mol. Biol. 2005;12:46–53. doi: 10.1038/nsmb869. [DOI] [PubMed] [Google Scholar]
- 8.Anderson J., Widom J. Sequence and position-dependence of the equilibrium accessibility of nucleosomal DNA target sites. J. Mol. Biol. 2000;296:979–987. doi: 10.1006/jmbi.2000.3531. [DOI] [PubMed] [Google Scholar]
- 9.Ha T. Single-molecule fluorescence resonance energy transfer. Methods. 2001;25:78–86. doi: 10.1006/meth.2001.1217. [DOI] [PubMed] [Google Scholar]
- 10.Gansen A., Hauger F., Toth K., Langowski J. Single-pair fluorescence resonance energy transfer of nucleosomes in free diffusion: optimizing stability and resolution of subpopulations. Anal. Biochem. 2007;368:193–204. doi: 10.1016/j.ab.2007.04.047. [DOI] [PubMed] [Google Scholar]
- 11.Gansen A., Tóth K., Schwarz N., Langowski J. Structural variability of nucleosomes detected by single-pair Förster resonance energy transfer: histone acetylation, sequence variation, and salt effects. J. Phys. Chem. B. 2009;113:2604–2613. doi: 10.1021/jp7114737. [DOI] [PubMed] [Google Scholar]
- 12.Kelbauskas L., Chan N., Bash R., Yodh J., Woodbury N. Sequence-dependent nucleosome structure and stability variations detected by Förster resonance energy transfer. Biochemistry. 2007;46:2239–2248. doi: 10.1021/bi061289l. [DOI] [PubMed] [Google Scholar]
- 13.Kelbauskas L., Chan N., Bash R., DeBartolo P., Sun J. Sequence-dependent variations associated with H2A/H2B depletion of nucleosomes. Biophys. J. 2008;94:147–158. doi: 10.1529/biophysj.107.111906. [DOI] [PMC free article] [PubMed] [Google Scholar]
- 14.Kelbauskas L., Sun J., Woodbury N., Lohr D. Nucleosomal stability and dynamics vary significantly when viewed by internal versus terminal labels. Biochemistry. 2008;47:9627–9635. doi: 10.1021/bi8000775. [DOI] [PubMed] [Google Scholar]
- 15.Kapanidis A., Laurence T., Lee N., Margeat E., Kong X. Alternating-laser excitation of single molecules. Acc. Chem. Res. 2005;38:523–533. doi: 10.1021/ar0401348. [DOI] [PubMed] [Google Scholar]
- 16.Lee N., Kapanidis A., Wang Y., Michalet X., Mukhopadhyay J. Accurate FRET measurements within single diffusing biomolecules using alternating-laser excitation. Biophys. J. 2005;88:2939–2953. doi: 10.1529/biophysj.104.054114. [DOI] [PMC free article] [PubMed] [Google Scholar]
- 17.Koopmans W.J.A., Brehm A., Logie C., Schmidt T., van Noort J. Single-pair FRET microscopy reveals mononucleosome dynamics. J. Fluoresc. 2007;17:785–795. doi: 10.1007/s10895-007-0218-9. [DOI] [PMC free article] [PubMed] [Google Scholar]
- 18.Koopmans W.J.A., Schmidt T., van Noort J. Nucleosome immobilization strategies for single-pair FRET microscopy. ChemPhys Chem. 2008;9:2002–2009. doi: 10.1002/cphc.200800370. [DOI] [PubMed] [Google Scholar]
- 19.Eggeling C., Berger S., Brand L., Fries J., Schaffer J. Data registration and selective single-molecule analysis using multi-parameter fluorescence detection. J. Biotechnol. 2001;86:163–180. doi: 10.1016/s0168-1656(00)00412-0. [DOI] [PubMed] [Google Scholar]
- 20.Wahl M., Gregor I., Patting M., Enderlein J. Fast calculation of fluorescence correlation data with asynchronous time-correlated single-photon counting. Opt. Express. 2003;11:3583–3591. doi: 10.1364/oe.11.003583. [DOI] [PubMed] [Google Scholar]
- 21.Zhao M., Jin L., Chen B., Ding Y., Ma H. Afterpulsing and its correction in fluorescence correlation spectroscopy experiments. Appl. Opt. 2003;42:4031–4036. doi: 10.1364/ao.42.004031. [DOI] [PubMed] [Google Scholar]
- 22.Hess S., Huang S., Heikal A., Webb W. Biological and chemical applications of fluorescence correlation spectroscopy: a review. Biochemistry. 2002;41:697–705. doi: 10.1021/bi0118512. [DOI] [PubMed] [Google Scholar]
- 23.Wohland T., Rigler R., Vogel H. The standard deviation in fluorescence correlation spectroscopy. Biophys. J. 2001;80:2987–2999. doi: 10.1016/S0006-3495(01)76264-9. [DOI] [PMC free article] [PubMed] [Google Scholar]
- 24.Santoso Y., Hwang L.C., Le Reste L., Kapanidis A.N. Red light, green light: probing single molecules using alternating-laser excitation. Biochem. Soc. Trans. 2008;36:738–744. doi: 10.1042/BST0360738. [DOI] [PubMed] [Google Scholar]
- 25.Meersseman G., Pennings S., Bradbury E. Mobile nucleosomes—a general behavior. EMBO J. 1992;11:2951–2959. doi: 10.1002/j.1460-2075.1992.tb05365.x. [DOI] [PMC free article] [PubMed] [Google Scholar]
- 26.Kapanidis A., Margeat E., Laurence T., Doose S., Ho S. Retention of transcription initiation factor σ(70) in transcription elongation: single-molecule analysis. Mol. Cell. 2005;20:347–356. doi: 10.1016/j.molcel.2005.10.012. [DOI] [PubMed] [Google Scholar]
- 27.Polach K., Widom J. Mechanism of protein access to specific DNA sequences in chromatin—a dynamic equilibrium model for gene regulation. J. Mol. Biol. 1995;254:130–149. doi: 10.1006/jmbi.1995.0606. [DOI] [PubMed] [Google Scholar]
- 28.Dyer P., Edayathumangalam R., White C., Bao Y., Chakravarthy S. Reconstitution of nucleosome core particles from recombinant histones and DNA. Chromat. Chromat. Remod. Enz. A. 2004;375:23–44. doi: 10.1016/s0076-6879(03)75002-2. [DOI] [PubMed] [Google Scholar]
- 29.Lamb D., Schenk A., Rocker C., Scalfi-Happ C., Nienhaus G. Sensitivity enhancement in fluorescence correlation spectroscopy of multiple species using time-gated detection. Biophys. J. 2000;79:1129–1138. doi: 10.1016/S0006-3495(00)76366-1. [DOI] [PMC free article] [PubMed] [Google Scholar]
- 30.Anderson J., Thåström A., Widom J. Spontaneous access of proteins to buried nucleosomal DNA target sites occurs via a mechanism that is distinct from nucleosome translocation. Mol. Cell. Biol. 2002;22:7147–7157. doi: 10.1128/MCB.22.20.7147-7157.2002. [DOI] [PMC free article] [PubMed] [Google Scholar]
- 31.Claudet C., Angelov D., Bouvet P., Dimitrov S., Bednar J. Histone octamer instability under single molecule experiment conditions. J. Biol. Chem. 2005;280:19958–19965. doi: 10.1074/jbc.M500121200. [DOI] [PubMed] [Google Scholar]
- 32.Nir E., Michalet X., Hamadani K.M., Laurence T.A., Neuhauser D. Shot-noise limited single-molecule FRET histograms: comparison between theory and experiments. J. Phys. Chem. B. 2006;110:22103–22124. doi: 10.1021/jp063483n. [DOI] [PMC free article] [PubMed] [Google Scholar]
- 33.Zlatanova J., Bishop T., Victor J., Jackson V., van Holde K. The nucleosome family: dynamic and growing. Structure. 2009;17:160–171. doi: 10.1016/j.str.2008.12.016. [DOI] [PubMed] [Google Scholar]
Associated Data
This section collects any data citations, data availability statements, or supplementary materials included in this article.