

Abstract
Slow and discontinuous wave conduction through nonuniform junctions in cardiac tissues is generally considered unsafe and proarrythmogenic. However, the relationships between tissue structure, wave conduction velocity, and safety at such junctions are unknown. We have developed a structurally and electrophysiologically detailed model of the canine Purkinje-ventricular junction (PVJ) and varied its heterogeneity parameters to determine such relationships. We show that neither very fast nor very slow conduction is safe, and there exists an optimal velocity that provides the maximum safety factor for conduction through the junction. The resultant conduction time delay across the PVJ is a natural consequence of the electrophysiological and morphological differences between the Purkinje fiber and ventricular tissue. The delay allows the PVJ to accumulate and pass sufficient charge to excite the adjacent ventricular tissue, but is not long enough for the source-to-load mismatch at the junction to be enhanced over time. The observed relationships between the conduction velocity and safety factor can provide new insights into optimal conditions for wave propagation through nonuniform junctions between various cardiac tissues.
Introduction
Propagation of electrical excitation waves—action potentials (APs)—is the basis for fast signal transmission that triggers synchronized muscle contractions in the heart (1,2). To maintain normal cardiac function, APs must be rapidly and safely conducted through the whole conduction pathway of the heart, consisting of both simple cablelike structures and complex heterogeneous tissues that are often formed by cells with varying morphology, electrical excitability, and intercellular coupling. AP conduction velocity is determined primarily by the latter two factors (3), but is also influenced by the presence of structural heterogeneities within the tissue (4–8). Such heterogeneities can create a local electrical source-to-load mismatch—a misbalance between the current provided by a smaller mass of tissue (source) and the current necessary to bring to threshold an adjacent larger mass of tissue (load). Source-to-load mismatch can induce a local slowing of conduction, or even a conduction failure (4–12). Hence, along with reduced excitability and reduced intercellular coupling, source-to-load mismatch at junctions between different cardiac tissues can contribute to slow, discontinuous, and potentially unsafe AP conduction in the heart.
The Purkinje-ventricular junction (PVJ) is a typical cardiac junction with structural and electrophysiological heterogeneities, where source/load mismatch and discontinuous conduction can occur. Under normal conditions, APs conducted from thin Purkinje fibers (PF) into the large mass of ventricles determine electrical activation and contraction sequence in the heart. However, slow and discontinuous conduction through the heterogeneous PVJ can be arrhythmogenic. Primarily, discontinuities in the AP conduction velocity, commonly manifested experimentally as conduction time delays at the PVJ (9–14), have long been considered indicative of unsafe conduction leading to possible conduction blocks (9–12) or reentry (13). Slow AP conduction and associated time delays have also been linked with arrhythmogenic substrate in other (healthy or infarcted) cardiac tissues (7,15–17). However, other experimental studies have provided evidence for greater safety with slow conduction (18)—under certain conditions, the safety factor may increase with slow conduction instead of decreasing. A modeling study with one-dimensional cardiac tissue (3) has suggested that the dependence of the safety factor on conduction velocity can be biphasic within the same system, where safety sharply decreases only at very slow velocities. However, precise relationships between tissue heterogeneities (both structural and functional), the AP conduction velocity, and measures of the risks of conduction failure remain unclear.
The aim of this study is to determine such relationships using a detailed computer model of AP conduction through the PVJ that accounts for both electrophysiological and morphological differences between PFs and the ventricles. Thus, we first develop a new biophysically detailed AP model for a canine PF cell by modifying an existing canine ventricular cell model (19,20) based on extant voltage-clamp datasets recorded for major ionic currents from canine PF cells (21). Then, a three-dimensional (3D) wedge model of the canine PVJ is developed based on an earlier diffusion-tensor MRI reconstruction (20), which incorporates details of the transmural AP heterogeneity, tissue geometry, and fiber orientation of the canine left ventricular free wall. This is completed with a single PF entering the wedge from the endocardium. The resultant model is used to study the relationships between the tissue heterogeneity, the AP conduction velocity, and the safety factor (3) at the PVJ.
Model Development
The dynamics of electrical waves in cardiac tissues can be described by the following reaction-diffusion-type nonlinear partial differential equation (19,20):
| (1) |
Here, V (mV) is the transmembrane potential, t is time (s), and ∇ is a spatial gradient operator defined within the tissue geometry. D is a tensor of diffusion coefficients (mm2 ms−1) that characterizes electrotonic intercellular spread of voltage via gap junctional coupling, Cm (pF) is the cell membrane capacitance, and Iion is the total membrane ionic current (pA). Biophysically detailed models have been developed previously to describe the voltage- and time-dependent current Iion, and hence cell-specific AP properties, in canine ventricles (20).
Single PF cell model
We develop a detailed description of Iion, and hence a single-cell AP, for canine PF cells by modifying the existing canine endocardial cell model (20) based on experimental data for the kinetics of several major ionic currents in canine PFs (21). These include the L-type and T-type Ca2+ currents, ICa,L and ICa,T, the transient outward current, Ito, the fast and slow delayed rectifier currents, IK,r and IK,s, and the inward rectifier K+ current, IK,1. Conductances and kinetics of each of the currents in the canine endocardial cell model (20) were modified to simulate their correct current/voltage (I/V) relationships and time courses, as recorded experimentally from canine PF cells (21). Below, we describe details of such modifications made for each individual current.
Fast Na+current, INa
Maximum conductance, gNa, and the time constant for the slow component of inactivation, τj, in the PF cell model were reduced to 66% and 10%, with respect to the values for the endocardial cell model (20) to produce an AP upstroke velocity comparable to experimental data (Table 1). Relative contributions of the fast, h, and slow, j, components of inactivation were set to 80% and 20%, respectively.
Table 1.
Action potential properties in a canine PF cell: model versus experiment
| Han et al. (21) | Dumaine et al. (23) | Kondo et al. (25) | Simulation | |
|---|---|---|---|---|
| RP, mV | −80 | −83 | −85 | −83 |
| APA, mV | 112 | 120 | 115 | 124 |
| PP, mV | 3 | −10 | – | −7 |
| APD, mV | 373 | – | 378 | 375 |
| , V/s | – | – | 250 | 262 |
RP, resting potential; APA, action potential amplitude; PP, plateau potential; APD, action potential duration; , maximum upstroke velocity. In both the model and experiments, APD was measured at 90% repolarization after periodic pacing at 1 Hz.
Late Na+ current, INa,L
This current has a greater effect on the AP duration in PF cells than in ventricular cells (22,23). We used characteristics of INa,L recorded from canine PFs (24) to modify its description in the canine endocardial cell model (20). This included a −22 mV shift in the steady-state inactivation curve, hL,∞, and reformulation of the inactivation time constant, τh,L, as a variable. Maximum conductance, gNa,L, was rescaled based on the measured I/V relationship for INa,L (24). The value of gNa,L in the PF cell model was fivefold larger compared to that in the endocardial cell model. Experimentally validated characteristics of this current are presented in Fig. 1. As a result of the modification, the AP duration in the PF was significantly increased in comparison to that in ventricular cells (25).
Figure 1.
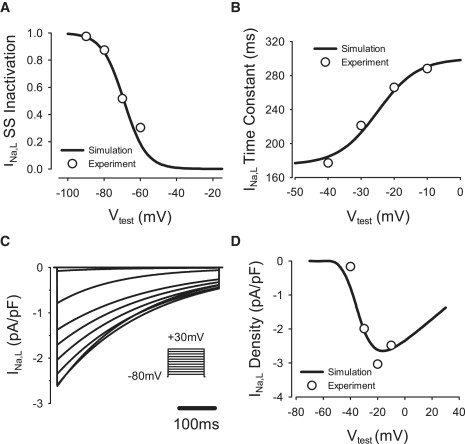
Model of the late Na+ current, INa,L. Here, and in Figs. 2–6, simulated curves (lines) are compared to respective experimental data (circles) (24). (A) Steady-state inactivation curve. (B) Inactivation time constant. (C) INa,L during 500-ms voltage-clamp pulses to −70 to +30 mV from the holding potential of −80 mV. (D) I/V relationship. Vtest, test voltage.
L-type Ca2+ current, ICa,L
Kinetics of fast and slow voltage-dependent inactivation variables, f and f2, were refit to experimental data (21): sigmoid steady-state inactivation curves and time constants were modified based on experimentally measured values of their half-inactivation and slope factors (Fig. 2). The maximum conductance, gCa,L, was determined by fitting the simulated I/V relationship for ICa,L to experimental data (21). This resulted in 66% reduction in gCa,L compared to the respective value for the endocardial cell model (20). As a result, the AP duration in the PF was significantly increased and the AP plateau was lowered in comparison to ventricular cells (25).
Figure 2.
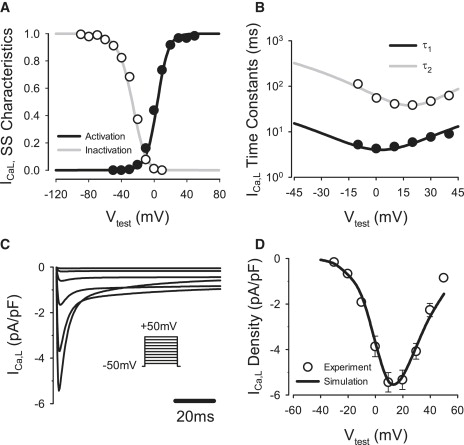
Model of the L-type Ca2+ current, ICa,L compared with experimental data (21). (A) Steady-state activation and inactivation curves. (B) Fast and slow voltage-dependent inactivation time constants, τ1 and τ2. (C) ICa,L during 200-ms voltage-clamp pulses to −40 to +50 mV from a holding potential of −50 mV. (D) I/V relationship.
T-type Ca2+ current, ICa,T
This current is absent in the ventricular cell model (20), but is recorded from canine PF cells (21). Hence, we incorporated ICa,T into the PF cell model (Fig. 3). Sigmoid expressions for steady-state activation (b) and inactivation (g) were derived from the experimental data (21). Expressions for the time constants of activation and inactivation were taken from a rabbit sinoatrial cell model (26). The resultant equations and parameters used (such as maximum channel conductance, gCa,T were validated by matching the simulated I/V relationship for ICa,T to the experimental data (21), as shown in Fig. 3 C. The introduction of ICa,T contributed to the experimentally observed increase of the AP duration with respect to ventricular cells (25).
Figure 3.
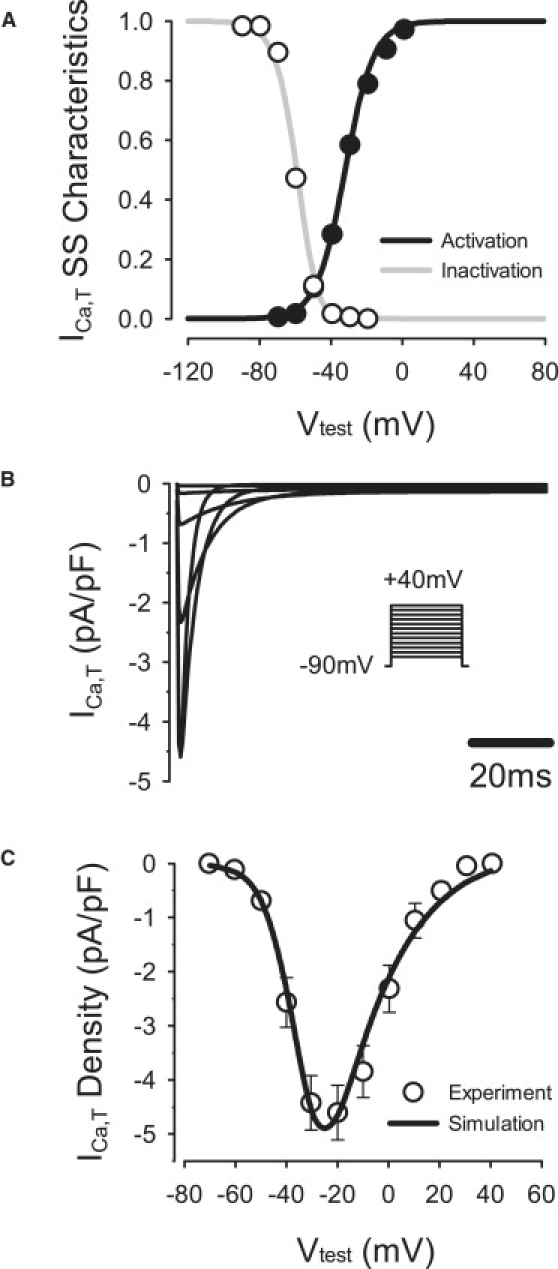
Model of the T-type Ca2+ current, ICa,T compared with experimental data (21). (A) Steady-state activation and inactivation curves. (B) ICa,T during 200-ms voltage-clamp pulses to −70 to +40 mV from a holding potential of −90 mV. (C) I/V relationship.
Transient outward K+ current, Ito,1
Expression for the steady-state activation variable, a∞, was fitted to experimental data (21), which resulted in a −36-mV shift in the half-activation compared to the respective expression in the endocardial cell model. In addition, expression for the activation time constant, τa, was also shifted by −36 mV. Both fast and slow inactivation variables, i and i2, were refitted to the experimental data (21) by modifying their respective half-inactivation and slope factors and time constants (Fig. 4). Relative contributions of the inactivation components i and i2 were set to 80% and 20%, respectively. Maximum conductance, gto,1, was determined by fitting the simulated I/V relationship for Ito,1 to the experimental data (21). The resultant value of gto,1 in the PF cell model was 49% larger than in the endocardial cell model. Modifications to Ito,1 changed the morphology of the AP notch and the plateau of the PF cell, providing better correspondence to experimental data (25).
Figure 4.
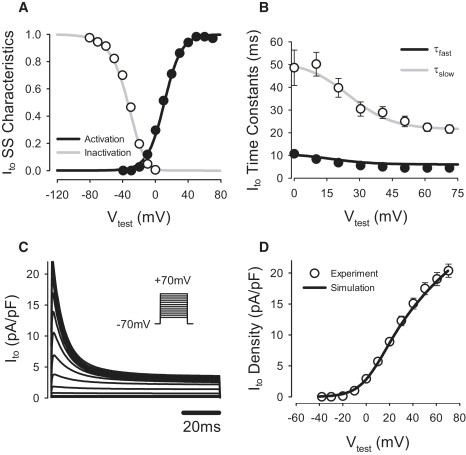
Model of the transient outward K+ current, Ito,1, compared to experimental data (21). (A) Steady-state activation and inactivation curves. (B) Fast and slow voltage-dependent inactivation time constants, τfast and τslow,; (C) Ito during 100-ms voltage-clamp pulses to −40 to +70 mV from a holding potential of −70 mV. (D) I/V relationship. Note that D shows the pure four-AP-sensitive current Ito,1, whereas C presents the sum of Ito,1 and the steady-state component of the outward K+ current, Ito,2.
Inward rectifier K+ current, IK,1
To fit the steady-state I/V relationship for IK,1 to experimental data (21), the maximum conductance, gK,1, was rescaled, and a small constant component was added to the steady-state activation (see the Appendix). The resultant value of gK,1 in the PF cell model was 50% of the respective value in the endocardial model.
Rapid delayed rectifier K+ current, IK,r
Equations of IK,r were modified based on experimental data (21). The steady-state activation curve, xr,∞, was shifted by −10 mV and its slope factor increased by 288%; the steady-state inactivation curve, rr,∞, was shifted by −15.4 mV and its slope factor increased by 132% (Fig. 5); and activation and inactivation time constants, τx,r and τr,r, were reformulated based on Hodgkin-Huxley formalism. The maximum conductance, gK,r, was determined from the measured current density of IK,r (21). The resultant value of gK,r was ∼163% larger in the PF cell model compared to the endocardial cell. Model equations and parameters were validated by matching the simulated I/V relationship for IK,r to the experimental data (21) for both the step and tail currents.
Figure 5.
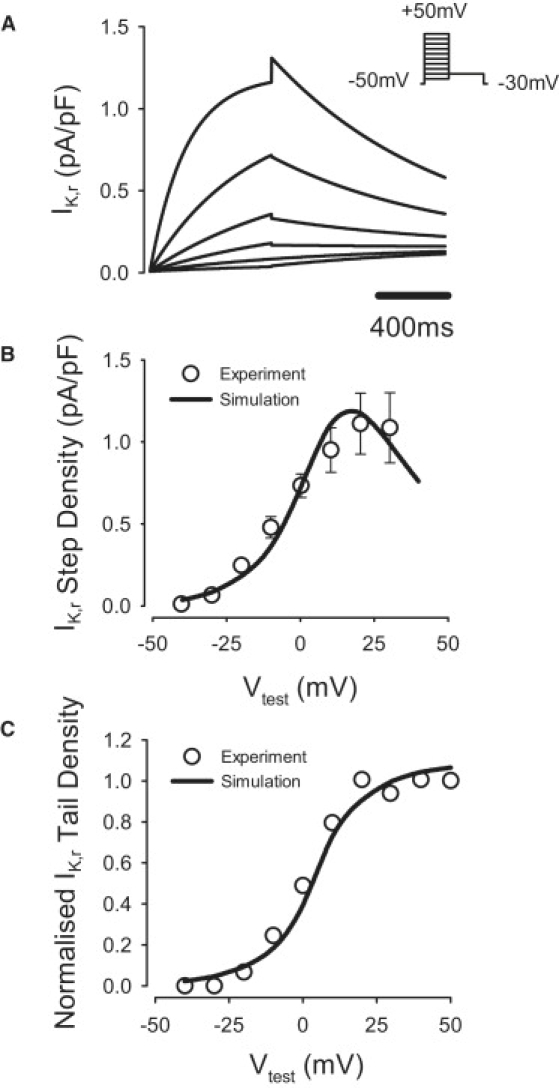
Model of the fast delayed rectifier K+ current, IK,r. (A) IK,r simulated during 1000 ms voltage-clamp pulses to −40 to +50 mV from a holding potential of −50 mV, followed by a repolarizing 1000 ms pulse to −30 mV; B and (C) simulated I/V relationships for the step (B) and tail (C) currents compared to the respective experimental data (21).
Slow delayed rectifier K+ current, IK,s
To match experimental data (21), the steady-state activation curve, xs,∞, was shifted by 1.5 mV and its slope factor decreased to 55% (Fig. 6). The maximum conductance, gK,s, was determined by fitting the simulated I/V relationship for IK,s to the experimental data (21). The resultant value of gK,s was ∼135% larger than in the endocardial cell model. Changes in IK,1, IK,r, and IK,s contributed to producing the correct AP morphology at repolarization stages (25).
Figure 6.
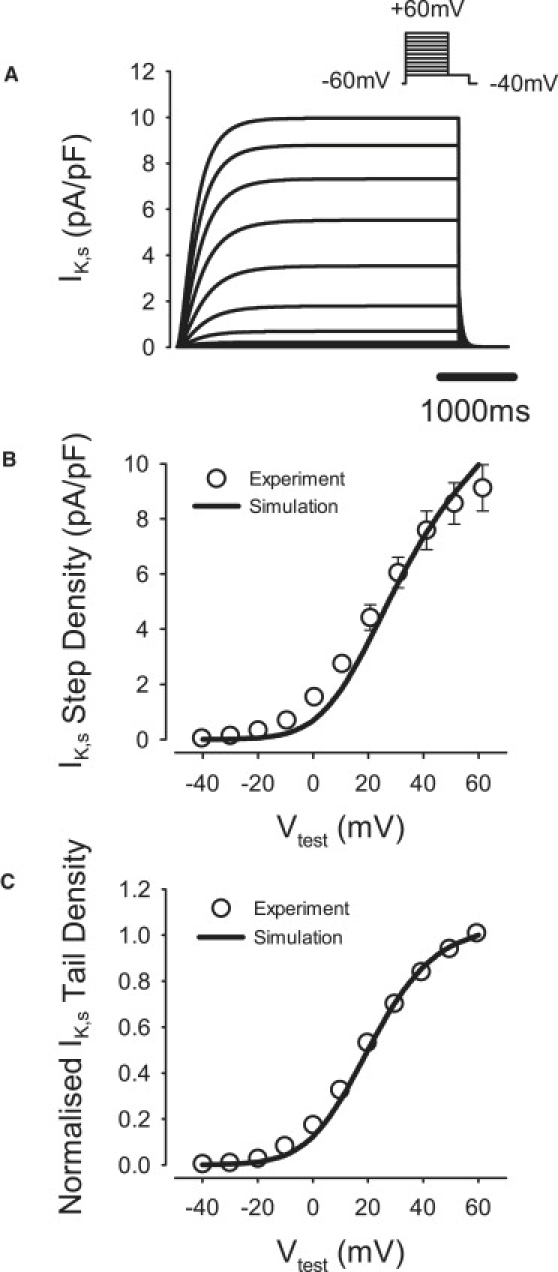
Model of the slow delayed rectifier K+ current, IK,s, compared to the respective experimental data (21). (A) IK,s during 5000-ms voltage-clamp pulses to −40 to +60 mV from a holding potential of −60 mV, followed by a repolarizing 500-ms pulse to −40 mV. (B and C) I/V relationships for the step (B) and tail (C) currents.
Detailed equations and parameters for the newly developed canine PF cell model are presented in the Appendix (the respective code in C is available on request). Figs. 7–9 summarize the results of the single PF cell model development. Fig. 7 illustrates differences in current densities between the canine PF cell and three ventricular cell types: major differences are seen in INa,L, IK,r, and IK,1, which contribute to large differences in the AP plateau, duration, and repolarization properties between these cells. Fig. 8 illustrates dynamic differences in APs and ionic currents between the canine PF and ventricular cell models, and Fig. 9 validates the resultant AP morphology and rate dependence in the canine PF cell model. The AP shape and duration, as well as the full AP duration (APD) restitution curve, are in good agreement with experimental data (25,27), which validates the model equations and parameters used. A full comparison of the AP characteristics in PF cells between our simulations and experimental data is shown in Table 1.
Figure 7.
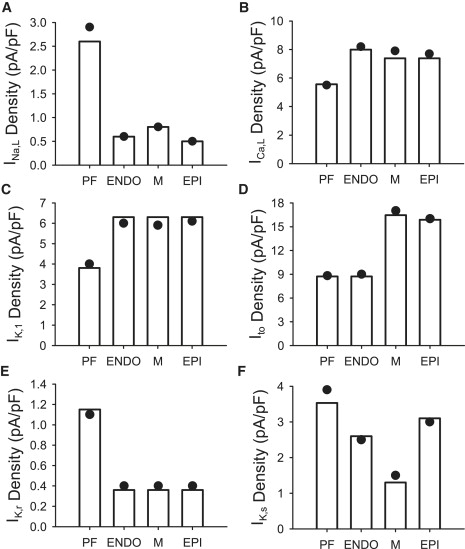
Differences in ionic current densities between canine ventricular cell models (20) and our model for the canine PF cell. Currents are indicated by open vertical bars. Circles indicate experimentally measured values of the respective current densities in PF cells (21,24). ENDO, endocardial cell; M, midmyocardial cell; EPI, epicardial cell.
Figure 8.
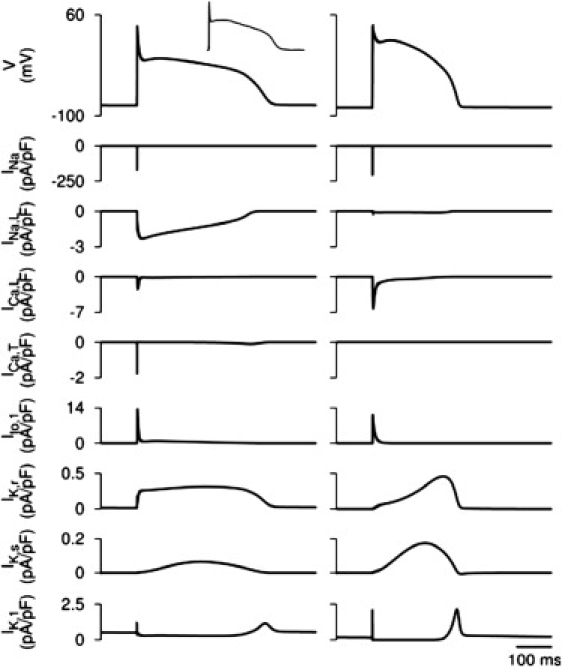
Differences in the dynamics of APs and ionic currents between the canine PF and ventricular cell models. Simulated AP morphologies and ionic current traces in the PF (left) and endocardial (right) cell models are shown. (Upper left inset) Experimental AP recording from a canine PF cell (25).
Figure 9.
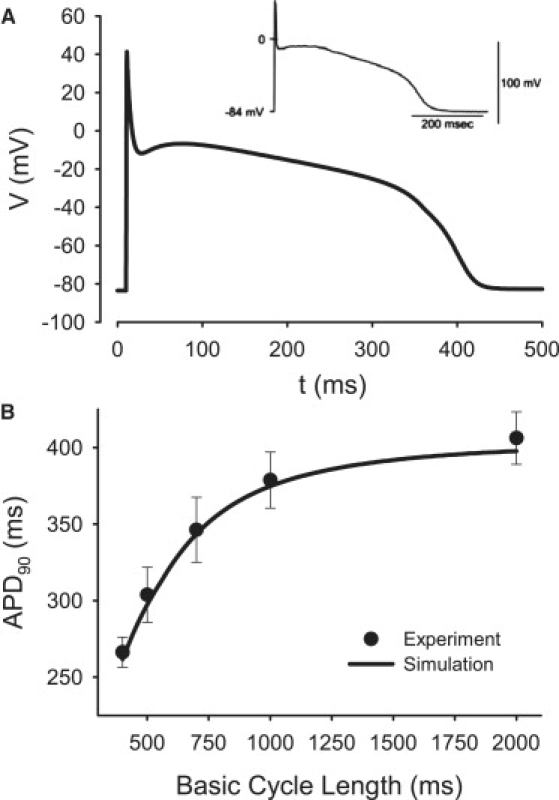
AP properties in the PF cell model. (A) Morphology compared with experimental data (25). (B) Restitution curve compared with experiment (27). APD90, AP duration at 90% repolarization.
3D tissue model
The ventricular and PF single-cell models were incorporated into a 3D tissue model describing the detailed anatomical structure of the canine ventricles (20).
The 3D ventricular wedge geometry was represented by a regular Cartesian grid of 50 × 50 × 50 points (“cells”) with a resolution of 0.35 mm; for each point, a flag variable identified whether it belonged to the endocardial, midmyocardial, or epicardial layer (20). A single PF strand consisting of 50 “cells” entered the wedge perpendicular to the endocardial surface. Values of the diffusion coefficients characterizing electrotonic coupling along and transverse to ventricular fibers, D|| = 0.60 mm2 ms−1 and D⊥ = 0.15 mm2 ms−1, were chosen to reproduce experimentally observed anisotropic AP conduction velocities in the canine ventricles (20). The value of the diffusion coefficient characterizing electrotonic coupling along the quasi-one-dimensional PF strand was chosen to produce the experimentally observed velocity of ∼1.8 m/s (28). Combinations of the fiber orientation vectors and the diffusion coefficients gave components of the tensor D at each grid point (19).
Equation 1 was solved on the geometry grid using a finite-difference partial differential equation (PDE) solver based on the explicit Euler method with time and space steps, Δt = 0.01 ms and Δx = 0.35 mm, respectively. Note that the space step of 0.35 mm corresponds to the spatial resolution of the diffusion tensor MRI data on which canine ventricular geometry has been based; the geometry has been successfully used to simulate transmural propagation in canine ventricles (20). However, to study possible effects of spatial resolution on simulation results, we have reduced the space step to 0.175 mm by introducing intermediate points between the existing grid points and linearly interpolating fiber orientations. Results of simulations with this refined model were in agreement with those using the original space step. A computer code implementing the PDE solver was parallelized under MPI and executed on the Horace supercomputer (Manchester, UK). A single run of the code simulating 1 s of activity on eight CPUs took ∼45 min. Thus, a high-resolution model incorporating detailed tissue anatomy, fiber orientation, and electrical heterogeneity within the canine PVJ has been constructed and implemented.
2D slice model
We have also studied a simple 2D model of the PVJ with a PF strand connected to a 2D caricature of a transmural slice of ventricular tissue with realistic dimensions and couplings. Note that such a model provides a feasible description for the transmural AP propagation (20). Geometry of the 2D model is illustrated in Fig. 10 A. Dimensions of the tissue were varied along the horizontal spatial coordinate, x, with the vertical width of the PF, d1, smaller than the width of the ventricular slab, d2 (10,14). The thickness of the ventricular tissue was 17.5 mm, with endocardial, midmyocardial, and epicardial regions occupying one third each (20). The diffusion coefficient, D, was also defined as a spatially nonuniform function of x (Fig. 10 B), with higher values in the PF than in ventricular tissues, D1 > D2 (28). In control simulations, parameter values were d1 = 0.7 mm, d2 = 17.5 mm, D1 = 0.8 mm2 ms−1, and D2 = 0.2 mm2 ms−1. The model produced AP conduction velocities of 1.8 m/s and 0.5 m/s in the PF and ventricular tissues, respectively, as observed experimentally (28,29). As the coupling decreased and the tissue dimensions increased between the PF and the ventricle, the AP conduction through the PVJ was discontinuous, with a time delay, ΔT, of up to ∼7.5 ms (Fig. 10 C), as seen in experiments (10,28). It is important to note that the discontinuity was due to the natural nonuniformity of the PVJ and did not require a specific resistive barrier (5,14).
Figure 10.
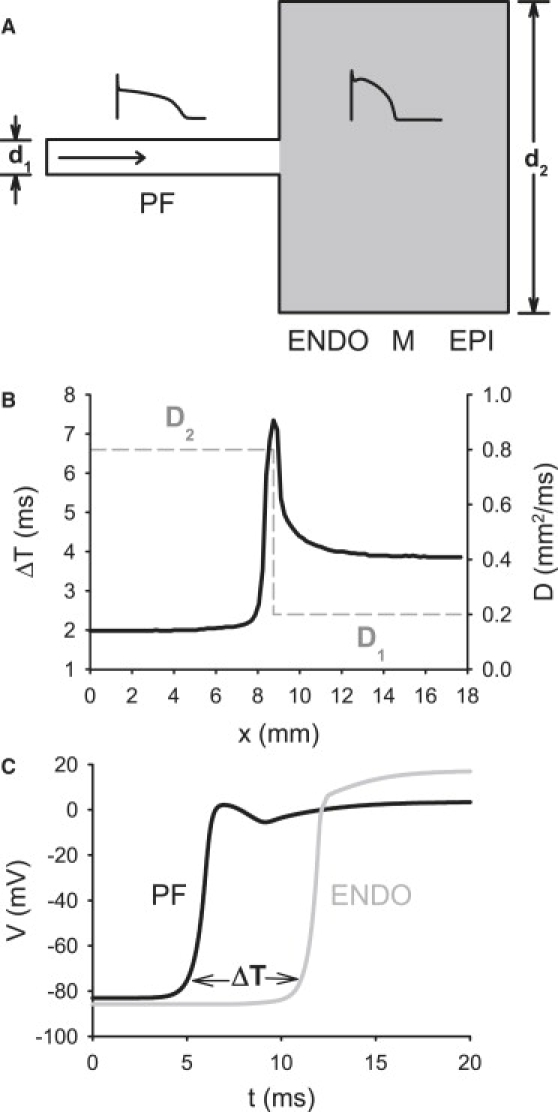
Properties of the two-dimensional slice model of the PVJ. (A) Geometry of the PVJ. A single PF runs into a slab of ventricular tissue (gray) that consists of endocardial, midmyocardial, and epicardial layers (20). The width of the PF, d1, is much smaller than the width of the ventricular slab, d2. (Insets) AP morphologies in the PF (left) and ventricular (right) cells. The horizontal arrow shows the direction of AP propagation. (B) Plots of the nonuniform diffusion coefficient, D, and the AP conduction time delay, ΔT, at the PVJ, showing profiles of D (dashed line) and ΔT (solid line) along the horizontal spatial coordinate, x. ΔT is measured over a distance of 2 mm along the x-direction, as in experiments (29). (C) Time delay between APs recorded from the PF and ventricular tissues 2 mm apart across the PVJ.
Safety factor
The safety factor (SF) has been introduced as a simple index of the robustness of conduction in cardiac tissues (3,30). It is defined as the ratio of charge generated to charge consumed by a cell during its excitation. SF > 1 indicates successful conduction, with its fraction of >1 representing the margin of safety. When SF is close to 1, conduction is critical, and when SF < 1, propagation fails. The equation used to compute SF is
| (2) |
Here, Ic is the capacitive current of the cell, Iout is the intercellular current that flows from the cell to its downstream neighbor, and Iin is the intercellular current that flows into the cell from its upstream neighbor. The domain of integration, A, can be defined as the period of time from the moment when dV / dt at the AP wavefront reaches 1% of its maximum to the moment when V reaches its maximum, Vmax (30). Note that Ic = ∂V / ∂t, Iin = −D∇V-, and Iout = −D∇V+ (with all currents normalized by the membrane capacitance, Cm).
Results
Simulations with the 2D slice model were carried out first to establish relationships between parameters of the tissue heterogeneity (primarily dimensions, d, and diffusion coefficient, D) and the AP conduction velocity and safety factor at the PVJ. Similar simulations were then carried out in the full 3D model to verify the results obtained.
2D slice simulations
As described above, parameters d1 < d2 and D1 > D2 were adjusted to experimentally validated values, which reproduced experimentally observed AP conduction velocities in the PF and ventricular tissues. Under such physiological conditions, AP conduction through the morphologically and electrically nonuniform PVJ was discontinuous, with a sharp increase in the conduction time delay, ΔT, measured over 2 mm along the x-direction. When both morphological and intercellular coupling heterogeneities were considered, the maximum measured ΔT was ∼7.5 ms at the PVJ (Fig. 10), consistent with experimental measurements of 3–10 ms (9–14). When heterogeneity in the tissue dimensions was considered alone (d1 < d2, D1 > D2), the maximum time delay, ΔT, at the PVJ was ∼4 ms. When heterogeneity in the intercellular coupling was considered alone (d1 = d2, D1 > D2,), ΔT was ∼4.5 ms (Fig. 11 A). Without nonuniformities in the tissue dimensions or coupling, AP conduction was continuous (i.e., no significant time delay was observed), even though the electrophysiological properties of the PF and ventricular cells were different.
Figure 11.
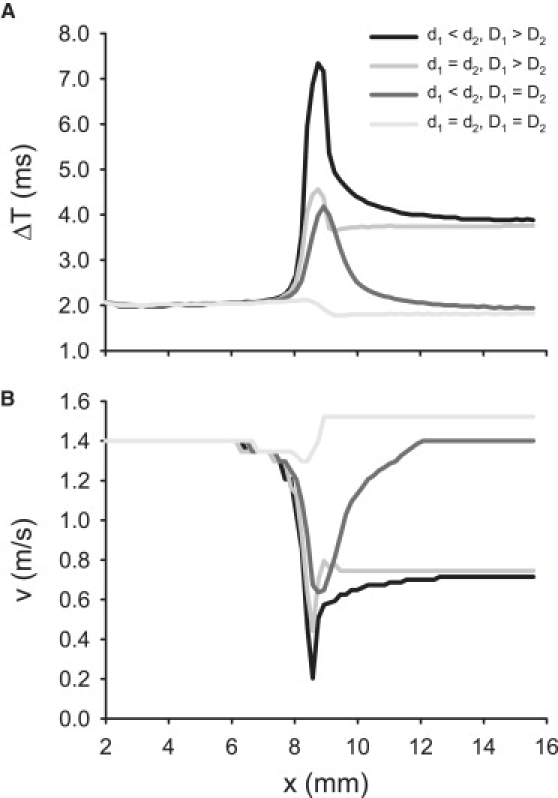
Discontinuous AP conduction through the PVJ, represented by (A) time delay, ΔT, and (B) velocity, v. Plots show profiles of ΔT and v along the horizontal spatial coordinate x. Four cases are illustrated: the PVJ with nonuniformities in both tissue geometry and diffusion coefficient (d1 < d2, D1 > D2), tissue with a nonuniform diffusion coefficient (d1 = d2, D1 > D2), tissue with a nonuniform geometry (d1 < d2, D1 = D2), and tissue where both geometry and diffusion coefficient are uniform (d1 = d2, D1 = D2).
As ΔT increased, the AP conduction velocity at the PVJ, v, decreased from ∼1.3 m/s in the uniform tissue (d1 = d2, D1 > D2,) to ∼0.2 m/s in the tissue with nonuniformities in d and D (Fig. 11 B). Note that local velocity decreases at nonuniform tissue junctions has been explained by mismatches between the electrical current source and load (4–8), and are generally considered proarrythmogenic (7,9–13), but precise relationships between the conduction velocity and safety have not been established.
The AP conduction through the PVJ and the associated SF are shown in Fig. 12: under physiological conditions (as defined above), the conduction delay resulted in a local increase in the SF around the PVJ, which can be explained by an accumulation of charge at the PVJ due to source/load mismatch. Below we describe qualitative relationships between the SF and the conduction velocity through the PVJ, v, arising under variations of the tissue heterogeneity parameters.
Figure 12.
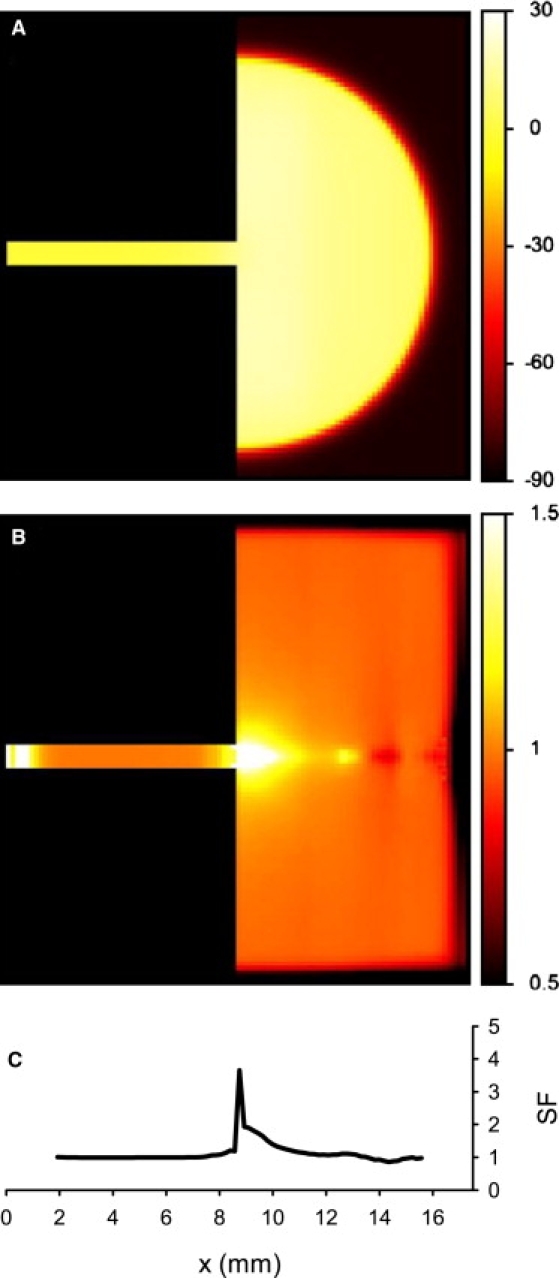
AP conduction in the 2D model of the PVJ, showing (A) spatial distribution of the transmembrane potential, V (mV), during successful AP conduction from the PF into the ventricular tissue, and (B) the resultant distribution of SF. Color keys for spatial distributions are at right. (C) Profile of the SF along the horizontal spatial coordinate, x.
Changes in velocity v can be achieved by varying either the width (d1) or the diffusion coefficient (D1) of the PF strand (Fig. 13). Paradoxically, variations (primarily decrease) in d1 that decrease v at the same time can increase SF, suggesting that slower conduction through the PVJ corresponds to higher safety (Fig. 13 A). However, the SF does not increase monotonically: as d1 is decreased to <∼1 mm, SF starts to decrease, until it eventually drops below 1 and the AP conduction through the PVJ fails. Hence, dependence of the SF on d1 has a maximum at mm, where can be considered as an “optimal” width of the PF for the conditions chosen. Note that PF bundles dissected from canine hearts can be 0.5–2.0 mm in diameter (31,32). As v monotonically increases with d1, dependence of the SF on v also has a maximum at v = v∗ ≈ 0.3 m/s (Fig. 13 C), where v∗ can be considered as an optimal velocity providing maximum safety of conduction through the PVJ.
Figure 13.
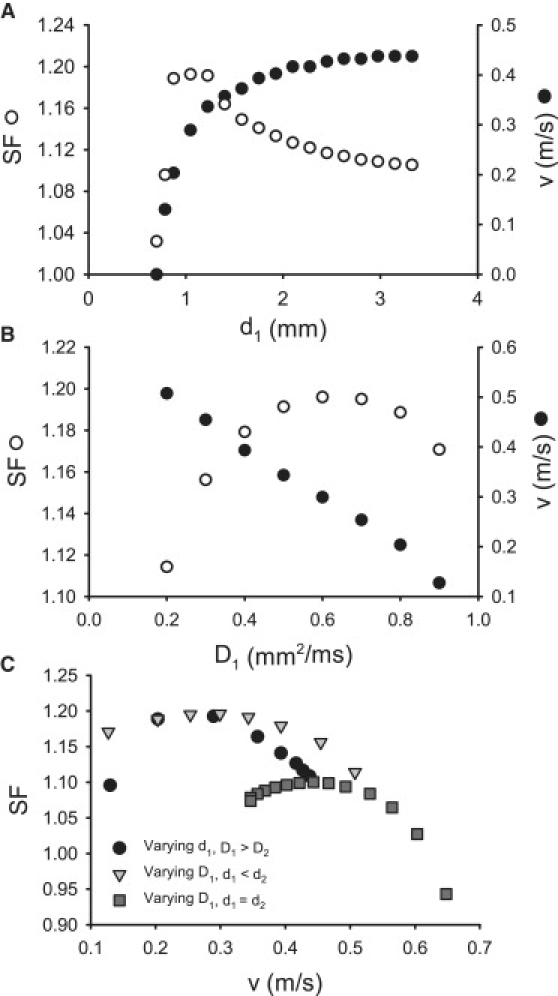
Relationships between nonuniformities of the PVJ, the AP conduction velocity, v, and the safety factor, SF. (A and B) Dependence of v and SF on width of the PF, d1 (A), and on the diffusion coefficient of the PF, D1 (B). Both velocity and SF were measured at the PVJ, where v reached a local minimum. (C) Relationships between v and SF at the PVJ. Three cases are illustrated: v is changed by varying d1, v is changed by varying D1 at the PVJ (d1 < d2), and v is changed by varying D1 in a geometrically uniform tissue (d1 = d2). In all three cases, the dependence of the SF on v has a maximum.
Dependence of the SF on D1 also exhibits a clear maximum at mm2 ms−1 (Fig. 13 B), and the respective dependence of SF on v in this case has a maximum at v = v∗ ≈ 0.3 m/s (Fig. 13 C). Note that v in our simulation is measured at the PVJ and, hence, is dependent on the gradient between D1 and D2, rather than on either of the two diffusion coefficients. Therefore, the simple relationship (1) valid for a uniform diffusion coefficient, D, does not apply in this case, and v decreases as D1 is increased (Fig. 13 B). Note also that the dependence of the SF on v has a maximum in the tissue with only one nonuniform parameter (d1 = d2, D1 > D2), at the optimal velocity v = v∗ ≈ 0.45 m/s (Fig. 13 C). These results demonstrate that both very fast and very slow conduction can be unsafe, whereas there is an optimal conduction velocity that produces the maximum SF. It is noteworthy that the optimal velocities of conduction through the PVJ, v∗, lie within the physiological range of experimentally observed AP conduction velocities.
3D wedge simulations
Considering the 3D structure of the ventricular wall, we studied conduction through the PVJ with realistic morphology using the 3D wedge model. Stimulation applied to the free-running end of the PF strand resulted in AP conduction through the PVJ into the ventricular tissue (Fig. 14). As in the 2D slice model, under physiological conditions (i.e., physiologically relevant cellular AP properties, as well as experimentally validated dimensions and intercellular couplings of the PF and ventricular tissues), conduction through the PVJ was slowed down, demonstrating a significant time delay (Fig. 14 A), a local decrease of the conduction velocity, v, and an increase of the SF at the PVJ (Fig. 14 B). With variation of the diffusion coefficient of the PF strand, the relationships between v and the SF showed similarity to those observed in 2D slices. Note that the varied parameter, D1, can be altered experimentally, for example, by applying gap junction blockers to the PF. Dependence of the SF on D1 had a maximum at ∼1.5 mm2/ms (Fig. 14 C), which is larger than that in 2D slices due to the increased electrical load imposed by the 3D mass of ventricular tissue. The corresponding dependence of SF on v had a maximum at ∼0.6 m/s (Fig. 14 D), which also fits well into the range of experimentally observed AP conduction velocities (28,29). Hence, results obtained with a simple 2D slice model have been qualitatively validated and qualitatively reevaluated by using the morphologically detailed 3D model.
Figure 14.
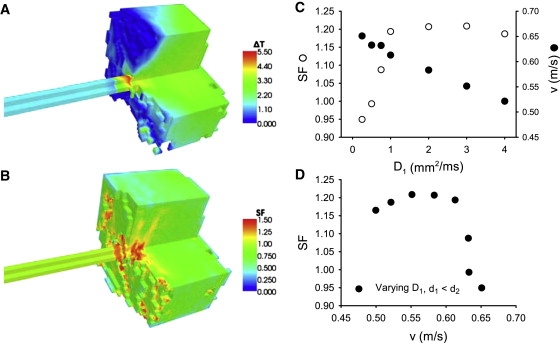
AP conduction in the 3D model of the PVJ. (A) Spatial distribution of the time delay, ΔT, during successful AP conduction from the PF into the ventricular wedge. (B) Resultant distribution of the SF. Spatial distributions are color-coded as shown at right. Note that the visible discontinuity of the 3D patterns is due to the anisotropy of the ventricular tissue. (C) Dependence of v and SF on the diffusion coefficient of the PF, D1. Both velocity and SF were measured at the PVJ, where v reached a local minimum. (D) Relationship between v and SF at the PVJ. As in Fig. 12C, the dependence of the SF on v has a maximum.
Note that quantitative differences between 2D and 3D simulations (Fig. 13 and 14) are due to different source-to-sink relations in the two models, as the same set of parameters were used for both cases. Adding the third dimension increases the mass of ventricular tissue—the sink—much more substantially than the mass of the PF—the source, which leads to quantitative (but not qualitative) differences. Thus, an optimal conduction velocity exists in both 2D and 3D, assuming values of ∼0.3 m/s and ∼0.6 m/s, respectively—both values have the same order of magnitude and fall within the experimentally reported range of conduction velocities through the PVJ. The higher optimal velocity in 3D may be explained by the fact that conduction into a large 3D mass of ventricular tissue requires faster transfer of charge though the PVJ to maintain the same level of safety as in 2D slices.
Discussion
We have developed a morphologically and electrophysiologically detailed model of the PVJ to determine relationships between its heterogeneity parameters and the velocity and safety of AP conduction through it. Simulations with the model demonstrated that when the tissue dimensions and the intercellular electrical coupling at the PVJ are varied, neither very fast nor very slow conduction is safe, and there exists an optimal velocity that provides the maximum safety factor for conduction through the junction. The respective conduction time delay across the PVJ occurs as a natural consequence of the electrophysiological and morphological differences between the PF and ventricular tissue. Primarily, the much larger ventricle imposes a large electrical load on the PF, which in combination with the disparity in electrotonic intercellular coupling leads to delays in conduction through the junction. Below, we discuss major achievements, as well as limitations, of the study, and compare our results and conclusions with mechanisms of discontinuous conduction in heterogeneous cardiac tissues reported in other studies.
Single-cell model
A new electrophysiologically detailed model describing AP properties in a canine PF cell has been developed based on modifications of the canine ventricular cell model (20). To our knowledge, this is the first species-specific mathematical model to incorporate extensive experimental data on ionic channel properties (21,24) and produce experimentally validated AP morphologies (25) and rate dependence (27) for a mammalian (primarily canine) PF cell.
Early development of single-cell cardiac models, such as the iconic DiFrancesco-Noble model (33), which integrates electrophysiological descriptions of ionic channels with a description of the ionic pump and sequestering process, provided a very general description for a mammalian PF cell. In the past two decades, the emphasis has shifted from such general models to species-specific models developed for a variety of human or animal cardiac tissue types, including the sinoatrial node, atria, and ventricles, whereas PFs have been largely neglected. However, achieving the ultimate goal of creating a virtual heart will require detailed models of all parts of the cardiac conduction system, including the PF.
The developed PF cell model was validated by its ability to reproduce experimental data for the kinetics of several major ionic currents recorded from a single species (21,24), which included INa,L, ICa,L, ICa,T, Ito, IK,r, IK,s, and IK,1 from canine PF cells. Kinetic variables, time courses, and I/V relationships for each of these currents were fitted to the experimental data (Figs. 1–6). The PF cell model equations and parameters used were also validated by the simulated AP characteristics matching experimental data (21,25,27) in the resting potential, AP overshoot, maximum upstroke velocity, low AP plateau, and long AP duration. Of most importance, the model was able to reproduce experimental data on the AP rate dependence (27) in a canine PF cell (Fig. 9). Large differences in ionic currents such as INa,L, IK,r, and IK,1 between the canine PF and ventricular cells (Figs. 7 and 8) contribute to major differences in the AP morphologies observed experimentally between these two cardiac cell types (25).
Limitations
Limitations of cardiac cell and tissue models are well documented (2,20). In our single PF cell model development, we modified the equations for all major ionic currents (INa, INa,L, ICa,L, ICa,T, Ito, IK,1, IK,r, and IK,s) in the ventricular cell model (20) based on available experimental data (21,24). However, the hyperpolarization-activated pacemaking current, If, was not introduced in the PF model, as no experimental data on its properties in canine PF cells were available. Note only that under physiological conditions, canine PFs do not show pacemaking. Besides, for pump and exchanger currents, as well as intracellular Ca2+ handling, due to the lack of experimental data concerning differences between the PF and ventricular cells, we used equations and parameters from the original ventricular model (20) and assumed no difference between these two cell types. Note also that in the 3D anatomical tissue model, the PF was considered to run perpendicular to the endocardial surface of the left ventricular wall, whereas spatial interactions between PFs and ventricular tissue in vivo can be complex (14).
Late Na+ current
Due to lack of experimental data, our formulation for INa,L was based on a single data source (24), which may limit the validity of the model properties related to this current. The quality of the experimental data (24) is also arguable, as Na+ currents were measured without blockade of K+ currents; besides, the effective patch pipette resistance was large (5–8 MΩ) and the recording temperature was not specified. However, in the absence of other data sources for canine PFs, it is reasonable to use the data (24) as the basis for INa,L formulation based on the following arguments. 1), Although K+ currents were not blocked, pharmacological evidence from the same study (24) shows that the total current was almost completely blocked by tetrodotoxin (TTX) or lignocaine and hence was predominantly Na+ current. 2), In a more recent study from the same group (34), which showed similar results, the recording temperature was explicitly specified as 37°C. 3), Large pipette resistance, R ∼ 5–8 MΩ, could present a major problem in measurements of a very large fast Na+ current, INa, but for the much smaller late sodium current, INa,L, which reaches the maximum amplitude of I ∼ −300 pA at −20 mV, such a resistance would result in a maximum error of voltage measurement of approximately IR = 300 pA × 8 MΩ = 2.4 mV. In addition, recordings from PF strands (35) have shown INa,L with a density of the same magnitude (∼5 pA/pF), which is several times higher than the respective current density in canine ventricular cells (36,37). These arguments justify the use of experimental data (24) for INa,L in our canine PF cell model.
There is experimental evidence for a prominent role of high INa,L in the PFs. Thus, the APD in PFs is much longer than in ventricular myocytes: this difference is related to INa,L, as TTX shortens the AP of PFs much more than that of ventricular myocytes (22,23); the latter study also shows that TTX decreases intracellular sodium activity much more in PF than in ventricular myocytes. Dose dependence of INa,L on TTX shows that the current is blocked by ∼50% at TTX concentrations of ∼10−6 M; such concentrations have been used in experiments (22), producing a remarkable decrease of the APD in PFs. In our model, a similar 50% block of INa,L results in a twofold APD decrease, matching the experimental data (22). However, a 50% block of INa,L in ventricular cell models results in a much smaller APD decrease, which is also consistent with experimental observations (22,36). This provides additional validation for the INa,L characteristics used in our model.
Conduction time delay
Our simulations, in line with results of earlier theoretical and experimental studies (4–8), show that the AP conduction time delay across the PVJ occurs as a natural consequence of the electrophysiological and morphological differences between the PF and ventricular tissue. At the ionic level, the delay allows the cell to accumulate a large amount of charge, provided by the membrane currents, before passing it through the PVJ for successful excitation of the ventricular tissue. At the same time, the time delay enhances the source/load mismatch at the PVJ over time. However, at optimal velocities, such enhancement should be minimal, allowing safer conduction.
Indeed, according to Eq. 2, successful conduction requires that the sum of integral currents produced (Iout) and stored (Ic) by a cell must equal or exceed the current received from other cells (Iin). Structural nonuniformities, such as changes in tissue dimensions or heterogeneities of gap junctional coupling, can create electrical imbalance between these currents and, hence, influence the conduction safety. Thus, an abrupt increase of the tissue dimensions at the PVJ (d1 < d2) means that a larger load imposed by the mass of ventricular tissue decreases the current density of Iout in comparison to Iin. On the other hand, a decrease of the intercellular coupling (D1 > D2) reduces electrical loading at the PVJ; as a result, less current leaks into the ventricular tissue at any given moment, and a larger fraction of the charge provided by the ionic current (Iion) is stored by the cell. Long conduction time delays (Fig. 11 A) allow more charge to be stored and then passed through the PVJ over time. Hence, when both nonuniformities are combined (d1 < d2, D1 > D2), source/load mismatch at the PVJ coexists with increase of the total stored/passed currents due to long conduction time delays. The balance between these two processes determines whether the SF increases or decreases when d1 or D1 are varied.
In a similar way, when the conduction velocity, v, at the PVJ is too low, the resultant time delay is long enough for a substantial amount of capacitive charge to be stored, but also long enough to enhance the mismatch between Iin and Iout at the PVJ over time. When v is too high and the time delay is short, imbalance between Iin and Iout is not enhanced, but cells at the PVJ cannot accumulate sufficient charge at their capacity. Thus, in both cases the conduction is unsafe, and there must be an optimal conduction velocity and an optimal time delay sufficient for the tissue to accumulate and pass through the PVJ substantial charge, but not long enough to let the mismatch between Iin and Iout at the junction be substantially enhanced over time.
Note that the L-type Ca2+ current, ICa,L, has been identified as the major inward current sustaining discontinuous AP conduction (3,38–40). Hence, the conduction time delay, ΔT, may be essential in providing enough time for ICa,L to become activated. At the same time, ICa,L produces significant effects on the membrane potential and the intracellular Ca2+ concentration (40) and hence may alter AP conduction properties, primarily ΔT, at the PVJ. Finding detailed ionic mechanisms of the feedback between ICa,L and ΔT at the PVJ presents an interesting challenge for a separate study, but is beyond the scope of this work.
Optimal velocity
Our simulations show the existence of an optimal velocity that provides the maximum conduction safety through the heterogeneous PVJ (Figs. 13 and 14). Simulations with a uniform one-dimensional cardiac tissue (3) suggest that the dependence of SF on the conduction velocity can also have a maximum at very slow velocities. Primarily, SF has monotonically increased when a uniform diffusion coefficient (D) in a one-dimensional tissue was decreased to very low values, and dropped abruptly only as D approached zero and the conduction velocity, , reached a nonphysiologically low value of ∼0.02 m/s (3). However, the following simple theoretical analysis demonstrates that such a maximum in a uniform tissue is not feasible, and hence can present an artifact of numerical approximation.
As Ic = ∂V / ∂t, Iin = −D∇V− and Iout = −D∇V+ (where ∇V− and ∇V+ are voltage gradients between a cell and its upstream and downstream neighbors, respectively, and all currents are normalized by the membrane capacitance, Cm), Eq. 2 can be written as
| (3) |
where a > 0 corresponds to the positive AP amplitude, b > 0 and c > 0 are positive integrals at the wave front where V− ≥ V ≥ V+, and both gradients, and , are always negative. From Eq. 3, it is clear that SF → ∞ when D → 0, and the derivative is negative for all values D > 0; hence, SF(D) is a monotonically decreasing function. Only at a singular point D = 0, cells in the tissue are not connected to each other, AP conduction fails (v = 0 and SF < 1). Thus, SF(D) in a uniform tissue cannot have a maximum at small, but nonzero, values of D (and hence, ). The previously reported “maximum” (3) could be due to numerical approximation errors during solving Eq. 1 or calculating Eq. 2. Our simulations of a uniform one-dimensional ventricular strand corroborate this: the maximum in the SF(D) dependence progressively shifts toward infinity when the space step of numerical integration, Δx, is decreased, and completely disappears for Δx < 0.003 mm; SF(D) calculated with smaller Δx is monotonic (not shown).
However, for nonuniform tissues, SF is not a monotonic function of D. In this case,
| (4) |
where is the difference in diffusion coefficients between the PF and ventricles. when , and hence, dependence of the SF on the diffusion coefficient of the PF, D1, has an optimum. Note that this holds not only for the nonuniform PVJ, but for any tissue with a nonuniform diffusion coefficient.
It is also possible that the previous study (3) actually implemented a nonuniform model with differential coupling within and between cells (see description in the Appendix of that article), as it is not explicitly stated which model they used in simulations showing the existence of a maximum SF. If so, the relationship shown between SF and D fits into our theoretical analysis. Thus, the study presented here not only predicts an optimal conduction velocity for a specific PVJ model, but also provides theoretical insights into the existence of such an optimum in nonuniform tissues and its infeasibility in uniform tissues.
Application to other tissues
Equation 1 belongs to a broad class of nonlinear reaction-diffusion equations that describe wave propagation in many excitable biological systems (1), where phenomena similar to those described in our article can exist. For example, discontinuous propagation through nonuniform junctions has been demonstrated in branching fibers of the atrioventricular node (7), infarcted ventricular tissues (15,16), and neural dendritic trees (41), and has also been associated with breakdown of propagating wave fronts during development of atrial fibrillation (42). Finding simple phenomenological relationships between the wave velocity and conduction safety indicators can provide new theoretical and practical insights into optimal conditions for wave propagation in such complex heterogeneous systems.
Appendix: Canine PF Cell Model Equations
General equations
Fast Na+ current
Late Na+ current
L-type Ca2+ current
T-type Ca2+ current
Transient outward K+ current
Fast delayed rectifier K+ current
Slow delayed rectifier K+ current
Inward rectifier K+ current
Plateau K+ current
Ca2+-dependent transient outward Cl− current
Na+-Ca2+ exchanger current
Na+-K+ pump current
Ca2+ pump current
K+-Cl− cotransporter
Na+-Cl− cotransporter
Background currents
Equilibrium potentials
Intracellular ion concentrations
Intracellular Ca2+ concentration
Ca2+/calmodulin-dependent protein kinase
NSR Ca2+ concentration
JSR Ca2+ concentration
Restricted-space Ca2+ concentration
SR release flux
SR leak flux
SR uptake flux
SR transfer flux
Parameter values and initial values for all equations are listed in Tables 2 and 3.
Table 2.
Model parameter values
| R | 8314 J/kmol K | |
| F | 96487 C/mol | |
| T | 310 K | |
| [Na+]o | 140 mM | |
| [Ca2+]o | 1.8 mM | |
| [K+]o | 5.4 mM | |
| [Cl-]o | 100 mM | |
| zNa | 1 | |
| zK | 1 | |
| zCa | 2 | |
| zCl | −1 | |
| γNai | 0.75 | |
| γNao | 0.75 | |
| γKi | 0.75 | |
| γKo | 0.75 | |
| γCai | 1.0 | |
| γCao | 0.341 | |
| gNa | 8.0 pA/pF | |
| gNa,L | 0.037375 pA/pF | |
| pCa | 0.000243 cm/s | |
| gCa,L | 0.3392328 pA/pF | |
| gCa,T | 0.13 pA/pF | |
| pCa,b | 1.995084 × 10⁻⁷ cm/s | |
| gto,1 | 0.14135944 pA/pF | |
| rNaK | 0.01833 | |
| gK,p | 0.00276 pA/pF | |
| km,to,2 | 0.1502 mM | |
| pCl | 0.0000004 cm/s | |
| gCl,b | 0.000225 pA/pF | |
| XNaCa | 0.4 | |
| iNaCa,max | 4.5 pA/pF | |
| km,Ca,act | 0.000125 mM | |
| km,Nai,1 | 12.3 mM | |
| km,Nao | 87.5 mM | |
| km,Cai | 0.0036 mM | |
| km,Cao | 1.3 mM | |
| ksat | 0.27 | |
| gNaK | 0.61875 pA/pF | |
| km,Nai,2 | 10 mM | |
| km,Ko | 1.5 mM | |
| ip,Ca | 0.0575 pA/pF | |
| km,p,Ca | 0.0005 mM | |
| CTK-Cl | 7.0756 × 10⁻⁶ mM/ms | |
| CTNa-Cl | 9.8443 × 10⁻⁶ mM/ms | |
| τr,o | 3.0 ms | |
| qleak | 0.004375 mM/ms | |
| NSR | 15.0 mM | |
| Xqup | 0.5 | |
| 0.75 | ||
| dkm,plb | 0.00017 | |
| km,up | 0.00092 mM | |
| 0.004375 mM/ms | ||
| τtr | 120.0 ms | |
| 0.047 mM | ||
| km,b,SR | 0.00087 mM | |
| 1.124 mM | ||
| km,b,SL | 0.0087 mM | |
| τss | 0.2 ms | |
| CSQN | 10.0 mM | |
| km,CSQN | 0.8 mM | |
| CMDN | 0.05 mM | |
| km,CMDN | 0.00238 mM | |
| TRPN | 0.07 mM | |
| km,TRPN | 0.0005 mM | |
| CaMK,0 | 0.05 | |
| αCa,MK | 0.05/ms | |
| βCa,MK | 0.00068/ms | |
| km,Ca,MK | 0.15 |
Table 3.
Initial values
| V | −86.9351482 |
| m | 0.00111859 |
| h | 0.990199813 |
| j | 0.993630289 |
| d | 0.00000138 |
| f | 0.999967371 |
| f2 | 0.999964108 |
| fCa | 0.985118263 |
| fCa,2 | 1.0 |
| b | 0.000087458 |
| g | 0.989496155 |
| xs1 | 0.018988645 |
| xs2 | 0.018988645 |
| xr | 0.000000014 |
| a | 0.01303108 |
| i | 0.999972058 |
| i2 | 0.999813749 |
| aa | 0.000555155 |
| mL | 0.00111859 |
| hL | 0.339310414 |
| ri | 0.999950186 |
| ro | 0.0 |
| [Ca2+]r | 0.0000834 |
| [Ca2+]JSR | 1.27169598 |
| [Ca2+]NSR | 1.271695903 |
| [Na+]i | 9.875593321 |
| [K+]i | 142.0142622 |
| [Cl−]i | 18.90029866 |
| [Ca2+]i | 0.0000834 |
| CaMK,act | 0.003264868 |
| CaMK,trap | 0.000632046 |
Acknowledgments
This work was supported by project grants from the Biotechnology and Biological Sciences Research Council (BBS/B/1678X) to O.V.A., M.R.B., and H.Z. and from the Engineering and Physical Sciences Research Council (EP/P502616/1) to P.S.
Footnotes
Oleg V. Aslanidi and Philip Stewart contributed equally to this work.
References
- 1.Tyson J.J., Keener J.P. Singular perturbation theory of traveling waves in excitable media (a review) Physica D. 1988;32:327–361. [Google Scholar]
- 2.Zipes D.P., Jalife J., editors. Cardiac Electrophysiology. From Cell to Bedside Sanders; Philadelphia: 2004. [Google Scholar]
- 3.Shaw R.M., Rudy Y. Ionic mechanisms of propagation in cardiac tissue: roles of the sodium and L-type calcium currents during reduced excitability and decreased gap junction coupling. Circ. Res. 1997;81:727–741. doi: 10.1161/01.res.81.5.727. [DOI] [PubMed] [Google Scholar]
- 4.Goldstein S., Rall W. Changes of action potential shape and velocity for changing core conductor geometry. Biophys. J. 1974;14:731–757. doi: 10.1016/S0006-3495(74)85947-3. [DOI] [PMC free article] [PubMed] [Google Scholar]
- 5.Joyner R.W., Veenstra R., Rawling D., Chorro A. Propagation through electrically coupled cells. Effects of a resistive barrier. Biophys. J. 1984;45:1017–1025. doi: 10.1016/S0006-3495(84)84247-2. [DOI] [PMC free article] [PubMed] [Google Scholar]
- 6.Cole W.C., Picone J.B., Sperelakis N. Gap junction uncoupling and discontinuous propagation in the heart. A comparison of experimental data with computer simulations. Biophys. J. 1988;53:809–818. doi: 10.1016/S0006-3495(88)83160-6. [DOI] [PMC free article] [PubMed] [Google Scholar]
- 7.Kucera J.P., Kleber A.G., Rohr S. Slow conduction in cardiac tissue. II: Effects of branching tissue geometry. Circ. Res. 1998;83:795–805. doi: 10.1161/01.res.83.8.795. [DOI] [PubMed] [Google Scholar]
- 8.Kucera J.P., Rudy Y. Mechanistic insights into very slow conduction in branching cardiac tissue: a model study. Circ. Res. 2001;89:799–806. doi: 10.1161/hh2101.098442. [DOI] [PubMed] [Google Scholar]
- 9.Mendez C., Mueller W.J., Urguiaga X. Propagation of impulses across the Purkinje fiber-muscle junction in the dog heart. Circ. Res. 1970;26:135–150. doi: 10.1161/01.res.26.2.135. [DOI] [PubMed] [Google Scholar]
- 10.Overholt E.D., Joyner R.W., Veenstra R.D., Rawling D., Wiedmann R. Unidirectional block between Purkinje and ventricular layers of papillary muscles. Am. J. Physiol. 1984;247:H584–H595. doi: 10.1152/ajpheart.1984.247.4.H584. [DOI] [PubMed] [Google Scholar]
- 11.Veenstra R.D., Joyner R.W., Rawling D.A. Purkinje and ventricular activation sequences of canine papillary muscle. Effects of quinidine and calcium on the Purkinje-ventricular conduction delay. Circ. Res. 1984;54:500–515. doi: 10.1161/01.res.54.5.500. [DOI] [PubMed] [Google Scholar]
- 12.Wiedmann R.T., Tan R.C., Joyner R.W. Discontinuous conduction at Purkinje-ventricular muscle junction. Am. J. Physiol. 1996;271:H1507–H1516. doi: 10.1152/ajpheart.1996.271.4.H1507. [DOI] [PubMed] [Google Scholar]
- 13.Gilmour R.F., Watanabe M. Dynamics of circus movement re-entry across canine Purkinje fibre-muscle junctions. J. Physiol. 1994;476:473–485. doi: 10.1113/jphysiol.1994.sp020148. [DOI] [PMC free article] [PubMed] [Google Scholar]
- 14.Tranum-Jensen J., Wilde A.A., Vermeulen J.T., Janse M.J. Morphology of electrophysiologically identified junctions between Purkinje fibers and ventricular muscle in rabbit and pig hearts. Circ. Res. 1991;69:429–437. doi: 10.1161/01.res.69.2.429. [DOI] [PubMed] [Google Scholar]
- 15.Dillon S.M., Allessie M.A., Ursell P.C., Wit A.L. Influences of anisotropic tissue structure on reentrant circuits in the epicardial border zone of subacute canine infarcts. Circ. Res. 1988;63:182–206. doi: 10.1161/01.res.63.1.182. [DOI] [PubMed] [Google Scholar]
- 16.De Bakker J.M., van Capelle F.J., Janse M.J., Tasseron S., Vermeulen J.T. Slow conduction in the infarcted human heart. “Zigzag” course of activation. Circulation. 1993;88:915–926. doi: 10.1161/01.cir.88.3.915. [DOI] [PubMed] [Google Scholar]
- 17.Fox J.J., Riccio M.L., Hua F., Bodenschatz E., Gilmour R.F. Spatiotemporal transition to conduction block in canine ventricle. Circ. Res. 2002;90:289–296. doi: 10.1161/hh0302.104723. [DOI] [PubMed] [Google Scholar]
- 18.Spach M.S., Miller W.T., Geselowitz D.B., Barr R.C., Kootsey J.M. The discontinuous nature of propagation in normal canine cardiac muscle. Evidence for recurrent discontinuities of intracellular resistance that affect the membrane currents. Circ. Res. 1981;48:39–54. doi: 10.1161/01.res.48.1.39. [DOI] [PubMed] [Google Scholar]
- 19.Panfilov A.V., Keener J.P. Re-entry in three-dimensional Fitzhugh-Nagumo medium with rotational anisotropy. Physica D. 1995;84:545–552. [Google Scholar]
- 20.Benson A.P., Aslanidi O.V., Zhang H., Holden A.V. The canine virtual ventricular wall: a platform for dissecting pharmacological effects on propagation and arrhythmogenesis. Prog. Biophys. Mol. Biol. 2008;96:187–208. doi: 10.1016/j.pbiomolbio.2007.08.002. [DOI] [PubMed] [Google Scholar]
- 21.Han W., Chartier D., Li D., Nattel S. Ionic remodeling of cardiac Purkinje cells by congestive heart failure. Circulation. 2001;104:2095–2100. doi: 10.1161/hc4201.097134. [DOI] [PubMed] [Google Scholar]
- 22.Coraboeuf E., Deroubaix E., Coulombe A. Effect of tetrodotoxin on action potentials of the conducting system in the dog heart. Am. J. Physiol. 1979;236:H561–H567. doi: 10.1152/ajpheart.1979.236.4.H561. [DOI] [PubMed] [Google Scholar]
- 23.Iacono G., Vassalle M.J. On the mechanism of the different sensitivity of Purkinje and myocardial fibers to strophanthidin. J. Pharmacol. Exp. Ther. 1990;253:1–12. [PubMed] [Google Scholar]
- 24.Vassalle M., Bocchi L., Du F. A slowly inactivating sodium current (INa2) in the plateau range in canine cardiac Purkinje single cells. Exp. Physiol. 2007;92:161–173. doi: 10.1113/expphysiol.2006.035279. [DOI] [PubMed] [Google Scholar]
- 25.Dumaine R., Cordeiro J.M. Comparison of K+ currents in cardiac Purkinje cells isolated from rabbit and dog. J. Mol. Cell. Cardiol. 2007;42:378–389. doi: 10.1016/j.yjmcc.2006.10.019. [DOI] [PubMed] [Google Scholar]
- 26.Zhang H., Holden A.V., Kodama I., Honjo H., Lei M. Mathematical models of action potentials in the periphery and center of the rabbit sinoatrial node. Am. J. Physiol. 2000;279:H397–H421. doi: 10.1152/ajpheart.2000.279.1.H397. [DOI] [PubMed] [Google Scholar]
- 27.Kondo M., Tsutsumi T., Mashima S. Potassium channel openers antagonize the effects of class III antiarrhythmic agents in canine Purkinje fiber action potentials. Implications for prevention of proarrhythmia induced by class III agents. Jpn. Heart J. 1999;40:609–619. doi: 10.1536/jhj.40.609. [DOI] [PubMed] [Google Scholar]
- 28.Joyner R.W., Overholt E.D. Effects of octanol on canine subendocardial Purkinje-to-ventricular transmission. Am. J. Physiol. 1985;249:1228–1231. doi: 10.1152/ajpheart.1985.249.6.H1228. [DOI] [PubMed] [Google Scholar]
- 29.Kanter H.L., Laing J.G., Beau S.L., Beyer E.C., Saffitz J.E. Distinct patterns of connexin expression in canine Purkinje fibers and ventricular muscle. Circ. Res. 1993;72:1124–1131. doi: 10.1161/01.res.72.5.1124. [DOI] [PubMed] [Google Scholar]
- 30.Romero L., Trenor B., Ferrero J.M., Saiz J. A sensitivity study of the safety factor for conduction in the myocardium. IEEE Comput. Cardiol. 2005;32:873–876. [Google Scholar]
- 31.Vassalle M., Lee C.O. The relationship among intracellular sodium activity, calcium, and strophanthidin inotropy in canine cardiac Purkinje fibers. J. Gen. Physiol. 1984;83:287–307. doi: 10.1085/jgp.83.2.287. [DOI] [PMC free article] [PubMed] [Google Scholar]
- 32.Christini D.J., Riccio M.L., Fox J.J., Karma A., Gilmour R.F. Control of electrical alternans in canine cardiac Purkinje fibers. Phys. Rev. Lett. 2006;96:104101. doi: 10.1103/PhysRevLett.96.104101. [DOI] [PMC free article] [PubMed] [Google Scholar]
- 33.DiFrancesco D., Noble D. A model of cardiac electrical activity incorporating ionic pumps and concentration changes. Philos. Trans. R. Soc. Lond. B Biol. Sci. 1985;307:353–398. doi: 10.1098/rstb.1985.0001. [DOI] [PubMed] [Google Scholar]
- 34.Bocchi L., Vassalle M. Characterization of the slowly inactivating sodium current INa2 in canine cardiac single Purkinje cells. Exp. Physiol. 2008;93:347–361. doi: 10.1113/expphysiol.2007.040881. [DOI] [PubMed] [Google Scholar]
- 35.Carmeliet E. Slow inactivation of the sodium current in rabbit cardiac Purkinje fibres. Pflugers Arch. 1987;408:18–26. doi: 10.1007/BF00581835. [DOI] [PubMed] [Google Scholar]
- 36.Zygmunt A.C., Eddlestone G.T., Thomas G.P., Nesterenko V.V., Antzelevitch C. Larger late sodium conductance in M cells contributes to electrical heterogeneity in canine ventricle. Am. J. Physiol. 2001;281:H689–H697. doi: 10.1152/ajpheart.2001.281.2.H689. [DOI] [PubMed] [Google Scholar]
- 37.Maltsev V.A., Reznikov V., Undrovinas N.A., Sabbah H.N., Undrovinas A. Modulation of late sodium current by Ca2+, calmodulin, and CaMKII in normal and failing dog cardiomyocytes: similarities and differences. Am. J. Physiol. 2008;294:H1597–H1608. doi: 10.1152/ajpheart.00484.2007. [DOI] [PMC free article] [PubMed] [Google Scholar]
- 38.Joyner R.W., Kumar R., Wilders R., Jongsma H.J., Verheijck E.E. Modulating L-type calcium current affects discontinuous cardiac action potential conduction. Biophys. J. 1996;71:237–245. doi: 10.1016/S0006-3495(96)79220-2. [DOI] [PMC free article] [PubMed] [Google Scholar]
- 39.Rohr S., Kucera J.P. Involvement of the calcium inward current in cardiac impulse propagation: induction of unidirectional conduction block by nifedipine and reversal by Bay K 8644. Biophys. J. 1997;72:754–766. doi: 10.1016/s0006-3495(97)78710-1. [DOI] [PMC free article] [PubMed] [Google Scholar]
- 40.Wagner M.B., Wang Y.G., Kumar R., Golod D.A., Goolsby W.N. Measurements of calcium transients in ventricular cells during discontinuous action potential conduction. Am. J. Physiol. 2000;278:H444–H451. doi: 10.1152/ajpheart.2000.278.2.H444. [DOI] [PubMed] [Google Scholar]
- 41.Vetter P., Roth A., Hausser M. Propagation of action potentials in dendrites depends on dendritic morphology. J. Neurophysiol. 2001;85:926–937. doi: 10.1152/jn.2001.85.2.926. [DOI] [PubMed] [Google Scholar]
- 42.Ong J.J., Cha Y.M., Kriett J.M., Boyce K., Feld G.K. The relation between atrial fibrillation wavefront characteristics and accessory pathway conduction. J. Clin. Invest. 1995;96:2284–2296. doi: 10.1172/JCI118284. [DOI] [PMC free article] [PubMed] [Google Scholar]