

Abstract
Phototropins control phototropism, chloroplast movement, stomatal opening, and leaf expansion in plants. Phototropin 1 (phot1) is composed of a kinase domain linked to two blue light-sensing domains, LOV2 and LOV1, which bind flavin mononucleotide. Disruption of the interaction between the LOV2 domain and a helical segment named Jα, joining LOV to the kinase domain, induces the subsequent kinase activity of phototropin 1 and further-downstream signal transduction. Here we study the effects of temperature and hydration on the light-triggered signal propagation in the phot1 LOV2 domain of Avena sativa (AsLOV2/Jα), using Fourier transform infrared spectroscopy to unravel part of the molecular mechanism of phototropin 1. We report that AsLOV2/Jα shows an intense signal in the amide I and II regions, arising mainly from β-sheet changes and the unbinding of the Jα helix from the Per-ARNT-Sim core and its subsequent partial unfolding. Importantly, these structural changes only occur under conditions of full hydration and at temperatures above 280 K. We characterized a newly isolated low-hydration intermediate that shows a downshift of high-frequency amide I signals and that possibly corresponds to loop tightening, without large β-sheet or Jα structural changes. In addition, we report a heterogeneity in AsLOV2/Jα involving two different C(4)=O conformer populations, coexisting in the dark state and characterized by C(4)=O carbonyl frequencies at 1712 cm−1 and 1694 cm−1 that are attributable to a single H-bond and two H-bonds at this site, respectively. Such conformers display slightly shifted absorption spectra and cause a splitting of the 475-nm band in the ultraviolet/visible spectra of LOV domains at low temperature.
Introduction
Phototropism, chloroplast movement, stomatal opening, and leaf expansion in plants are regulated by complex molecular mechanisms that involve two phototropins, phot1 and phot2 (1). Phot1 contains two light-sensing domains, LOV1 and LOV2, of which LOV2 is the principal domain (2). A description of the photoreceptor dynamics of the LOV2 domain is required to understand such regulatory mechanisms. The LOV2 domains belong to the superfamily of Per-ARNT-Sim (PAS) domains, found in all kingdoms of life. They constitute the signal-input domain of numerous systems, and are coupled to a wide variety of output domains (3). Because LOV domains have an ancient origin and consequently widespread occurrence, they play an important role in the detection of, and response to, blue light (4). It is thus of interest to unravel the pathway of signal propagation through the Avena sativa phot1 LOV2 domain (AsLOV2) that ultimately leads to activation of the phot1 kinase domain.
Flavin mononucleotide (FMN) is noncovalently bound to the protein via a number of hydrogen bonds and nonpolar and polar interactions (5–7). Blue-light absorption promotes noncovalently bound FMN to its singlet excited state, which in turn evolves to the triplet state at high efficiency (8–11). From the FMN triplet state, a covalent adduct between a conserved nearby cysteine residue and the C4a atom of the FMN moiety is formed (6,12–15). This state is referred to as S390 (5,6,8,12–15), and may correspond to the signaling state of the LOV domain that promotes kinase activation (1). The covalent adduct thermally decays, presumably through base catalysis (8,11,16), to regenerate the dark state at a rate that may vary by several orders of magnitude between LOV domains from different species (17,18).
The sequence alignment of LOV1 and LOV2 domains from all phototropins identified to date reveals a conserved segment associated only with LOV2 that is composed of 40 amino acids at the C-terminus. It is located outside the LOV2 domain, and forms part of the linker region between LOV2 and the kinase domain. Using NMR spectroscopy on AsLOV2, Harper et al. showed that this conserved segment forms a helical secondary structure, and hence is termed Jα (19). This helix is amphipathic, and binds to the solvent-exposed β-sheet surface of LOV2, burying hydrophobic residues on both surfaces. Upon illumination of the LOV2 domain, the LOV2/Jα interaction is eliminated; Jα loses its secondary structure, and partially unfolds (19). Because the Jα helix is part of the linker region joining LOV to the kinase domain, disruption of its interaction with the PAS core induces subsequent kinase activity of phototropin 1 and further-downstream signal transduction (20). Further evidence for significant changes in the protein secondary/tertiary structure was reported in a variety of studies (21–24).
For a number of LOV domains, x-ray structures are available (5–7,13,25,26). Strikingly, the light-induced changes in protein conformation are significantly restricted in LOV2 crystals (7,13,25,26). The crystal structure of the AsLOV2 domain with an intact Jα helix (AsLOV2/Jα) (7) shows only modest structural changes of a conserved N-terminal turn-helix-turn motif, and of a C-terminal region that contains the amphipathic Jα helix and the β-sheet protein surface on which the latter helix is packed. Both the N-terminal and C-terminal segments are involved in intermolecular contacts within the crystal lattice that are likely responsible for the smaller amplitude of light-induced structural changes, compared with LOV2 in solution. Similar phenomena of reduced protein dynamics in crystals were observed in the photoactive yellow protein (PYP) photoreceptor (27). The restriction of protein structural dynamics may also be induced by lowering the temperature and degree of hydration in a sample. In this way, controlling protein dynamics by temperature or by degree of hydration allows for the trapping of structurally intermediate states (28–32).
The ultraviolet-visible (UV-V) absorption spectrum of the adduct state in LOV domains is essentially independent of temperature, and exhibits a single band around 390 nm (hence its name, S390). In contrast, the infrared (IR) spectrum of the Adiantum phy3 LOV2 (phy3LOV2) domain is highly temperature-dependent, and involves a transition from a state denoted S390-I (below 250 K) to a state denoted S390-II at room temperature (32). These S390-I and S390-II states, as proposed by Kandori et al. (32), are characterized by small and larger changes in α-helix and β-sheet structures, respectively, and represent local (S390-I) and more global (S390-II) structural changes of the LOV2 protein upon covalent adduct formation. Phy3LOV2 at low hydration forms a S390-I like state (29). However, no indication was found for a significant loss of α-helical structure in all Fourier transform infrared (FTIR) experiments on phy3LOV2 (32–34) reported so far, implying that no unfolding of the Jα helix occurred in these systems. This apparent disparity between NMR and FTIR results suggests that the structural dynamics of AsLOV2 and phy3LOV2 are different, or that protein dynamics were restricted in FTIR experiments on phy3LOV2.
Here, we study light-induced signal propagation in AsLOV2/Jα as a function of temperature, by means of FTIR spectroscopy under conditions of optimal hydration. We report that the FTIR light-minus-dark spectrum of AsLOV2 at physiological temperatures shows an anomalously strong differential signal in the amide I α-helical frequency region, indicating full unbinding of the Jα helix from the PAS core and its partial unfolding. These large-scale protein structural changes only occur above 280 K. We denote this state as S390-III. By preparing a partly dehydrated sample by means of centrifugation and gentle partial evaporation, the amide I α-helical feature disappears, and a structural intermediate, denoted S390-I2, becomes evident. We also observed that two FMN C(4)=O conformers coexist in the dark state that are singly and doubly H-bonded to nearby amino acids. These conformers display slightly shifted absorption spectra, and cause a splitting of the 475-nm band in the UV/V spectra of LOV domains at low temperatures (35–38).
Materials and Methods
LOV2 expression and purification
The LOV2 domain of Avena sativa (oat) phototropin 1 (AsLOV2) was expressed and purified as previously described (19). It was expressed from a construct spanning residues 404–560 (construct generously provided by L. Neil and K. Gardner of the University of Texas Southwestern Medical Center, Dallas, TX). The collected fractions containing AsLOV2 from the His-Trap HP column (GE Healthcare, Netherlands) contained ∼150 mM imidazole, and were further dialyzed against a buffer containing 20 mM Tris/HCl (pH 8) plus 10 mM NaCl (10 mL of AsLOV2 solution against 5 L buffer), and further purified using a 6-mL Resource Q ion-exchange column (GE Healthcare), with an NaCl gradient to ensure complete removal of imidazole. The sample was stored in 20 mM Tris/HCl (pH 8) and 50 mM NaCl.
For control experiments, the His-tag and B1 domains of G protein fused to the AsLOV2 domain were cleaved using TEV protease (Invitrogen, Netherlands), as described previously (20). The FTIR experiments on cleaved and uncleaved constructs produced identical results.
Differential FTIR spectroscopy
Infrared difference spectra were recorded using an FTIR spectrometer (model IFS 66s, Bruker, Germany), equipped with a nitrogen-cooled photovoltaic mercury cadmium telluride detector (20 MHz, KV 100, Kolmar Technologies, Newburyport, MA). A blue LED emitting at 470 nm (5-mW output) was used for photo-conversion at saturating intensity. Low-temperature spectra were measured using a cryostat (Optisat DN, Oxford, Abingdon, UK) with a temperature controller (ITC4, Oxford) and liquid nitrogen as coolant. The FTIR sample was cooled to the set temperature, and after full equilibration (∼15 min), background (inverse of Fourier transform (FT−1) of I0) and sample (FT−1 of I) interferograms were recorded before and after switching on the blue light. Background and sample interferograms were the average of 500 and 2000 interferograms, recorded at 4-cm−1 resolution, respectively. After a Fourier transform, the obtained absorption spectrum represented the light-minus-dark FTIR difference spectrum. The sample was brought to room temperature between measurements at different temperatures. Two recordings were averaged for each temperature. The FTIR sample was made with a drop of 2 μL of OD450 nm of ∼100 (8 mM AsLOV2 in 20 mM Tris/HCl, pH 8, and 50 mM NaCl), spread between two tightly fixed CaF2 windows without any spacer and greased for tightness. A partly dehydrated sample (PDS) was prepared by slowly evaporating a 6-μL drop of OD450 nm of ∼100 to a volume of ∼2 μL. The steady-state FTIR light-dark difference spectra of a fully hydrated sample and the PDS are given in Fig. S1 of the Supporting Material. Photoconversion is dependent on temperature, and amounts to ∼40%, 70%, and 80% at 77 K, 150 K, and 300 K, respectively (32,35).
Results and Discussion
Light- induced changes of secondary and tertiary structures in AsLOV2
We performed temperature-dependent FTIR spectroscopy on AsLOV2 in the amide I-carbonyl, amide II, and fingerprint regions to probe the FMN and protein conformational changes upon illumination (Fig. 1). All vibrational bands of FMN and the protein in the similar phy3LOV2 domain were assigned previously, using isotopic labeling (34). In addition, it was shown that in phy3LOV2, the FMN bands are essentially temperature-independent in the amide I region (32).
Figure 1.
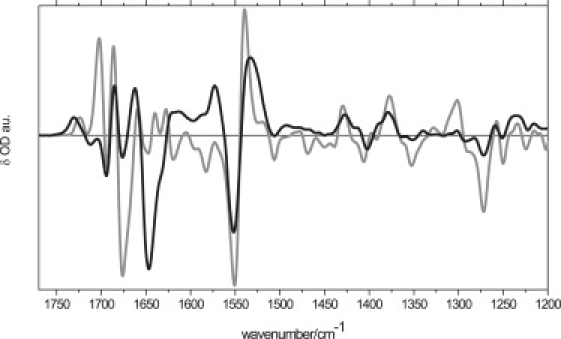
FTIR spectra were recorded in fully hydrated AsLOV2/Jα as a function of temperature in the 1750–1200-cm−1 region at 140 K (thick gray line) and 300 K (thick black line).
Fig. 2 a shows the light-minus-dark FTIR spectra from 140 K to 300 K in the carbonyl region between 1750 cm−1 and 1600 cm−1. At different temperatures, photoconversion varied from 40% to 80%. To compare the extent of protein structural changes, spectra were normalized on the 1730(+) cm−1 band, of which the amplitude is proportional to the number of adduct states (32). Between 140 K and 250 K, a pronounced temperature dependence (factor of 2 in amplitude) is evident for bands at 1676(−)/1702(+) cm−1, along with a weak dependence for 1647(−)/1640(+) cm−1, 1659(+) cm−1, and 1634(−)/1628(+) cm−1. Similar bands were evident in phy3LOV2 according to Kandori et al. (32), and were assigned to the amide I modes of turns, the α-helix, and the β-sheet (32,34), on the basis of often-assumed distinct frequency ranges of 1670–1700 cm−1, 1640–1670 cm−1, and 1615–1650 cm−1 for loops, α-helix, and β-sheet amide I absorption, respectively (39).
Figure 2.
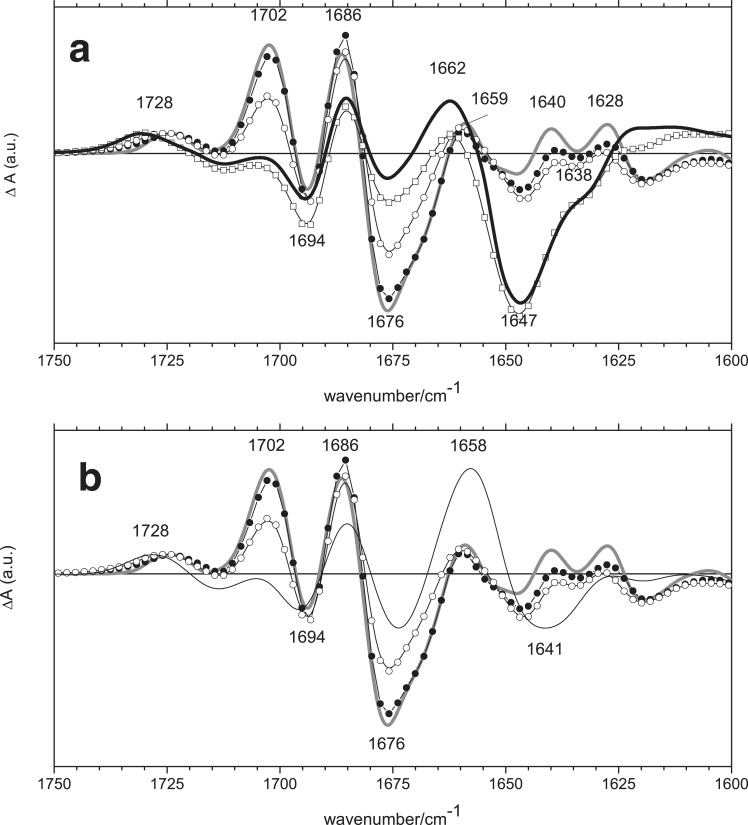
(a) FTIR spectra were recorded in fully hydrated AsLOV2/Jα as a function of temperature in the 1750–1600-cm−1 region at 140 K (thick gray line), 180 K (solid circle), 250 K (open circle), 280 K (open square), and 300 K (thick black line). (b) FTIR spectra were recorded in fully hydrated AsLOV2/Jα as a function of temperature in the 1750–1600-cm−1 region between 140 K and 250 K. Thin black line shows FTIR spectrum of a partly dehydrated sample (PDS) measured at 300 K.
In general, the dispersion in amide I absorption for different secondary structure elements follows from differences in transition dipole-coupling between the backbone C=O oscillators, through-bond coupling, hydrogen bonding, and π-π interactions (40–42). However, for globular proteins such as the LOV2 domain, caution must be taken in assigning amide I frequencies, because some of its LOV2 domain secondary structure elements are rather short and irregular, and “termination” effects can become important (42). This is particularly true for the high-frequency side of the amide I envelope, traditionally assigned to loops. Thus, we regard the assignment of amide I bands near 1700–1670 cm−1 by Kandori et al. (32) to loop structural elements in LOV2 as tentative, because they may also correspond to other segments of the PAS fold. For the LOV2 β-sheet and α-helices, amide I bands at low and medium frequencies can be assigned more confidently.
The 1676(−) cm−1 band contains contributions from the FMN C(2)=O and PAS-fold amide I at all temperatures. In the light state, this high-frequency amide I band upshifts from 1676(−) cm−1 to 1702(+) cm−1 at temperatures below 250 K, and downshifts to ∼1660 cm−1 at temperatures between 280 K and 300 K. The FMN C(2)=O upshifts to 1686(+) cm−1 and is essentially temperature-independent. The band at 1694(−) cm−1, previously observed in phy3LOV2 but not assigned (34), is temperature-independent and is assigned to FMN C(4)=O in the dark state, as discussed below. The 1712(−)/1731(+) cm−1 bandshift is clearly temperature-dependent (Figs. 1 and 2), and is assigned to C(4)=O of FMN (32,34). Overall, the FTIR spectra between 140 K and 250 K are very similar to those reported by Kandori et al. for phy3LOV2 (32).
Between 250 K and 280 K, covalent adduct formation is accompanied by very pronounced protein structural changes. The 280 K spectrum shows a large bleach at 1647 cm−1, a frequency which corresponds to α-helix amide I vibrations (32,39). Such a large signal in this frequency region was not observed previously in other LOV domains with FTIR spectroscopy (2,29,32,43–46). The LOV2 core contains several (mostly short) α-helical segments, in addition to the Jα helix that packs on the β-sheet. The NMR experiments of Harper et al. on exactly the same type of sample, under similar (full) hydration conditions, demonstrated that these core α-helical segments remain largely unaffected upon photo-activation, whereas the Jα helix demonstrates a large movement by dissociating from the LOV2 core and partial unfolding (19). Thus, the large negative signal at 1647 cm−1 is predominantly related to the Jα helix. The 1647 cm−1 band may also contain a minor contribution from the N-terminus, composed of a helix-turn-helix motif, which undergoes light-induced changes in the AsLOV2 x-ray structure (7). Because the Jα helix is thought to undergo partial unfolding in the signaling state (19), its induced absorption is expected to be broad, and corresponding at higher frequency to an amide I random structure near 1650 cm−1 (47). This signal was not obvious in our spectra. However, we observed that the differential features in the 280 K and 300 K spectra near 1660 cm−1 were superimposed on a broad, positive absorption signal compared with those at lower temperatures, which may correspond to the unfolded Jα helix.
The negative shoulder at 1640–1630(−) cm−1 is assigned to β-sheet modes, and is accompanied by a broad positive band extending toward the lower frequency with two apparent, weakly resolved maxima at 1622(+) cm−1 and 1611(+) cm−1. Such a downshift of a β-sheet amide I band suggests β-sheet motion in AsLOV2, and possibly a tightening as proposed for Phy3LOV2 (29,32). This broad positive band extends toward the low frequency until it joins the amide II mode at 1537(+) cm−1 (see below), which indicates (together with the amplitude of the Jα signal) a global change within the PAS fold above 280 K. Such a drastic structural change was not observed in previously measured LOV domains, including that of phy3LOV2 at room temperature (34). It very likely corresponds to Jα-unbinding from the PAS core as the last step after β-sheet motion. In analogy with the nomenclature introduced by Kandori et al. (32), we denote this final, physiologically relevant “signaling state” of LOV2/Jα as S390-III.
To assess the effect of dehydration, a PDS was prepared by partial evaporation, as described in Materials and Methods. Dehydration has the same effect as temperatures above 200 K, as observed for phy3LOV2 (29). The obtained light-minus-dark spectrum of AsLOV2 at 300 K is shown in Fig. 2 b (thin black line), along with the temperature-dependent FTIR spectra of the fully hydrated sample between 140 K and 250 K. We observed that, compared with the 280 K and 300 K spectra of the hydrated sample, the large bleach at 1647 cm−1 is absent, indicating that even under mildly reduced hydration conditions, the Jα helix does not unfold upon illumination.
Compared with the 250 K spectrum of the hydrated sample (Fig. 2 b, open circles), the PDS spectrum at 300 K is characterized by the disappearance of the amide I band at 1702(+) cm−1, the appearance of a strong, positive band at 1658 cm−1, and increased negative band amplitudes in the α-helix and β-sheet regions at 1641 cm−1 and ∼1634 cm−1, respectively. The light-state C(4)=O frequency is at 1728 cm−1, between those of the hydrated sample for the 250 K and 280 K spectra at 1725 cm−1 and 1730 cm−1, respectively. The position of this band is related to the extent of β-sheet changes, because C(4)=O is connected via H-bond to Asn-492, which belongs to the D-strand, as proposed by Iwata et al. (29). This is consistent with the amplitude of the negative band in the β-sheet region in the PDS spectrum, which is between those observed at 250 K and 280 K. The protein in the PDS transforms into an intermediate between the one observed at 250 K and 280 K, in which full Jα helix motion is not yet achieved, even if the β-sheet changes are stronger and the amide I band at 1676(−) cm−1 downshifts to 1658(+) cm−1. This is in sharp contrast with an upshift of the 1676(−) cm−1 amide I band to 1702(+) cm−1 at low temperature (Fig. 2 B, open and solid circles and gray line) and at very low hydration (14). Because the C(4)=O light-state frequency, the α-helix and β-sheet changes, and the amide I band at 1676(−)/1658(+) cm−1 of the PDS are between those of the 250 K and 280 K spectra, we assign the light state of the PDS to an S390 intermediate state between S390-I and S390-II (nomenclature of Kandori et al. (32)). Therefore, we denote this intermediate S390-I2. This S390-I2 is very similar to the S390-II of phy3-LOV2, but shows a much weaker β-sheet band at 1629(+) cm−1.
The AsLOV2 light-minus-dark FTIR spectrum of Swartz et al. (14) at room temperature is similar to our 250 K spectrum with a very similar C(4)=O frequency at 1725 cm−1, indicating that this state has a comparable C(4)=O FMN configuration in the light state. As discussed above, the PDS spectrum appears to represent a next step in the AsLOV2 photocycle between S390-I and S390-II. This finding suggests that our PDS contains more water than the sample used by Swartz et al. (14), and is consistent with the circumstance that our PDS sample was not a rehydrated film; nor did we lyophilize the LOV2 domain before the spectroscopy experiments.
Fig. 3 shows the temperature-dependent FTIR spectra on fully hydrated AsLOV2 in the region 1600 cm−1 and 1200 cm−1. Most bands observed in this frequency region belong to FMN and result from covalent adduct formation with the conserved cysteine. They will be discussed later. Between 140 K and 250 K, only small differences are evident. Upon increasing the temperature from 250 K to 280–300 K, a large spectral change is evident in the amide II region, around 1570 cm−1 and 1530 cm−1. Considering that the FMN bands are temperature-independent in this frequency region and that the amide II band in the dark state of phy3LOV2 was observed around 1550 cm−1 (34), we assign the 1551(−)/1573(+) cm−1 bandshift to an amide II change in AsLOV2. The negative band at 1551 cm−1 also contains a significant contribution of the FMN C(10a)=N1 stretch. The amplitude of the positive band at 1573 cm−1 is so intense at 280–300 K that the 1583 cm−1 band (which belongs to FMN C(4a)=N(5)) is only visible as a dip in the positive shoulder of the 1573 cm−1 band. These drastic changes in the amide II region at room temperature were not evident in other LOV domains (14,32,45,46), and likely correspond to unbinding and partial unfolding of the Jα helix.
Figure 3.
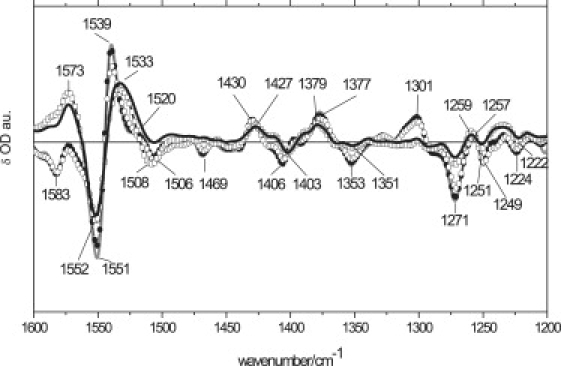
FTIR spectra were recorded in fully hydrated AsLOV2/Jα as a function of temperature in the 1600–1200-cm−1 region at 140 K (thick gray line), 180 K (solid circle), 250 K (open circle), 280 K (open square), and 300 K (thick black line).
AsLOV2 shows intense signals arising from the Jα helix and the β-sheet amide I and amide II vibrational modes at room temperature. The amplitude of vibrational mode changes is significantly larger than those observed previously for other LOV domains (14,29,32,34,44,45). Such changes are also accompanied by amide I frequency and intensity changes near 1676 cm−1. The low-hydration intermediate clearly shows a downshift of the 1676 cm−1 amide I band to 1658 cm−1 (which was assigned to loop-tightening (29,32)) without complete Jα unfolding. The temperature-dependent and hydration-dependent switch of helical motion highlights the importance of water-molecule rearrangements in the propagation of protein structural changes: when the water melts, full-signal propagation is evident in AsLOV2. This finding is consistent with the notion that in photoreceptor proteins, intraprotein water molecules are as essential for biological functions as amino acids (48). This may have some implications for low-temperature/hydration stress in plants, because our results strongly suggest that the activation of kinase activity of phototropins is suppressed below 273 K or under low-hydration conditions, implying the necessity of cryoprotectant in plant cells for plants living in cold-winter regions.
To summarize our assignment of low-temperature and low-hydration FTIR spectroscopy on AsLOV2 amide I and II modes, we propose the following sequence of events for signaling-state formation to occur (Fig. 4):
-
1.
S390-I: Adduct formation between FMN and Cys-966 results in an upshift of the amide I band at 1676 cm−1, observed at 77 K and 150 K in this study and elsewhere (29)
-
2.
Formation of S390-I is accompanied by weak α-helix and β-sheet motion, as probed by the C(4)=O frequency, which upshifts to ∼1725 cm−1, as observed at 250 K in this study and elsewhere (29). The light-state crystal structures of phy3 and AsLOV2 domains likely correspond to one of these later intermediates (7,13).
-
3.
Further structural perturbation of the β-sheet involves Phe-1010 and Gln-1029 in phy3LOV2 (43,49).
-
4.
S390-I2: Downshift of amide I band at 1676 cm−1, possibly corresponding to strengthening of the loop region (29,32), triggers further α-helix and weak β-sheet motion, as observed in this study for the PDS at room temperature.
-
5.
S390-II: Full β-sheet motion was observed and defined as S390-II previously (29).
-
6.
S390-III: Strong α-helix and β-sheet motion. The signal propagates outside the PAS core via release of the Jα-helix from the β-sheet of the LOV core, as observed above 280 K in this study. These events involve motion of the binding hot spots I539, A536, and I532, as determined by NMR for AsLOV2/Jα (20).
Figure 4.
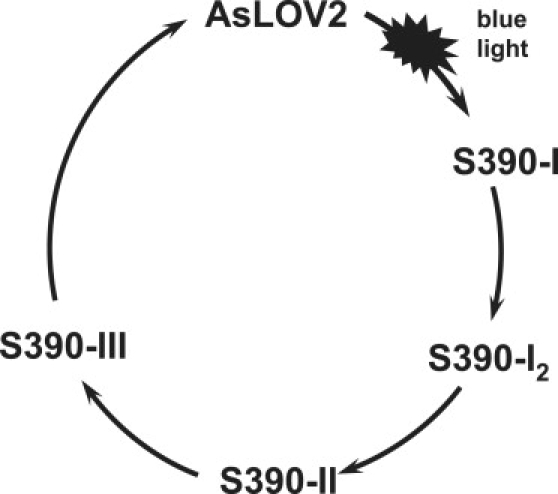
Schematic model proposed for blue-light signal propagation from FMN to β-sheet surface of PAS core, inducing Jα unbinding and subsequent kinase activity in LOV2 domains. S390-I undergoes limited short-range protein changes (29,32). S390-I2 was identified in this study as low-hydration intermediate S390-II was defined by Kandori et al. (29) and follows S390-I2, because it exhibits more β-sheet changes but no large Jα changes. S390-III undergoes long-range structural changes, modifying the PAS core surface and extending outside through disruption of interaction with Jα helix and its unfolding. See text for details.
Multiple FMN C(4)=O conformers exist in the dark state of AsLOV2
The AsLOV2/Jα FTIR spectra in the carbonyl region exhibit a number of bands that belong to both the FMN and amide I modes. We assign three C=O stretch frequencies at 1712, 1694, and 1676 cm−1 to FMN (Fig. 2 a). The 1712 cm−1 and 1676 cm−1 bands are readily assigned to C(4)=O and C(2)=O of FMN, respectively (34). The 1694(−) cm−1 band was observed in all measured LOV domains to date, i.e., Chlamydomonas phototropin LOV1, Chlamydomonas phototropin LOV2, YtvA-LOV, AsLOV2, phy3LOV2, and phy3LOV1, but was not assigned (14,44–46). Interestingly, our time-resolved IR femtosecond pump probe spectra show these three negative bands during the singlet-excited state of FMN (Alexandre et al. in the accompanying article). On this basis, we unambiguously assign the 1694 cm−1 band to the FMN carbonyl mode. Moreover, the same three negative bands were evident in the semiquinone-minus-oxidized FMN FTIR spectra of AsLOV2 and AsLOV2C39A, where amide I or other protein modes do not make a contribution (50). There are two possible assignments for the 1694 cm−1 band, i.e., FMN C(2)=O or C(4)=O. Assignment to FMN C(2)=O would correspond to a C(2)=O conformer free of H-bonding, considering that the other C(2)=O conformer at 1676(−) cm−1 is doubly H-bonded. A 1694(−) cm−1 conformer implies that the two H-bonding partners, Gln-513 and Asn-492, should not interact with C(2)=O, which is not consistent with the crystallographic (7) and recent NMR (51) data indicating strong H-bonding at C(2)=O in the dark state. Thus, assignment of the 1694(−) cm−1 band to FMN C(2)=O is unlikely.
Assignment of the 1694(−) cm−1 band to FMN C(4)=O would correspond to a C(4)=O conformer that is doubly H-bonded in the dark, considering that the other C(4)=O conformer at 1712(−) cm−1 is singly H-bonded in the dark, as shown in Fig. 5. A doubly H-bonded C(4)=O conformation is consistent with the crystallographic structure, which shows two potential H-bonding partners: Gln-513 and Asn-492 (7). Upon mutation of the Gln-513 (AsLOV2 numbering) in phy3LOV2, the C(4)=O upshifts from 1710(−) cm−1 to 1723(−) cm−1 (43), indicating the existence of an H-bond between Gln-513 and C(4)=O in the dark state. There is no evidence of a contribution from Asn-492 related to the 1710 cm−1 band in the dark. We conclude that the 1710–1712(−) cm−1 band corresponds to a FMN C(4)=O conformer, singly hydrogen-bonded to Gln-513. This band upshifts to 1725–1730(+) cm−1 in the light, corresponding to a breaking or weakening of the hydrogen bond (52).
Figure 5.
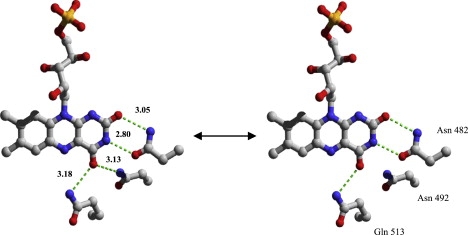
Close-up of dark-state AsLOV2 x-ray structure in vicinity of FMN (Protein Data Bank code 2V1A). The potential H-bond partners of the FMN isoalloxazine moiety are Asn-482 at 2.8 Å of FMN-N(3) and 3.05 Å of FMN-C(2)=O, Asn-492, and Gln-513 at 3.13 Å and 3.18 Å of FMN-C(4)=O. C(4)=O is in equilibrium between doubly H-bonded by Asn-492 and Gln-513 (left) and singly H-bonded to Gln-513 (right), as revealed by their respective stretching frequencies at 1694 cm−1 and 1712 cm−1. The reactive conserved cysteine Cys-450 at 3.83 Å of FMN-N(5) was omitted for clarity.
Positive signals that potentially correspond to a light-induced frequency shift of the 1694 cm−1 band were found at 1687 cm−1 and 1730 cm−1 (at 300 K). The positive band at 1702 cm−1 was excluded because of its strong temperature dependence, which is characteristic of amide I modes. If the 1694 cm−1 band represents a doubly H-bonded C(4)=O frequency in the dark state, then a downshift to 1687 cm−1 upon light-state formation implies H-bond strengthening or a new H-bond partner. The latter possibility is inconsistent with the available crystal structures (6,7,13,25). An upshift to 1730 cm−1 seems reasonable and consistent with the light-state crystal structure in which the light state C(4)=O is free of H-bonding or only weakly H-bonded by Asn-492.
The observation of a majority of doubly H-bonded C(4)=O in the crystal structure is consistent with our observation that the 1694 cm−1 band is about 3–4 times more intense than the 1712 cm−1 band, indicating a majority of doubly H-bonded C(4)=O conformers in AsLOV2. Such an equilibrium at room temperature is consistent with molecular-dynamics simulations (53), which predict an H-bond between Asn-492 and C(4)=O, with an occupancy of 0.8 and 0.4 for Chlamydomonas phototropin LOV1 and Phy3LOV2, respectively. The presence of C(4)=O conformers in LOV domains may have mechanistic implications, because it confers conformational flexibility to the immediate vicinity of FMN C(4)=O.
It is interesting to compare the presence of multiple C(4)=O conformers in LOV2 with the IR signatures observed in sensors of blue light using flavin adenine dinucleotide (FAD) (BLUF) domains. In BLUF domains, the light-minus-dark FTIR spectra are dominated by a light-induced downshift of the FAD C(4)=O from 1713(−) cm−1 to 1693(+) cm−1 (54,55). Concomitantly, the absorption spectrum of oxidized FAD in the BLUF domain red-shifts by ∼10 nm (56,57), which was explained by increased hydrogen-bond strength to FAD C(4)=O (58,59). The C(4)=O frequencies in the BLUF dark and light state match the C(4)=O frequencies of the two dark-state conformers in LOV2, i.e., 1712(−) and 1694(−) cm−1. This observation suggests that an equilibrium of “BLUF-like dark state” and “BLUF-like light state” exists in the dark state of AsLOV2. If this hypothesis is correct, then as in BLUF domains, the two C(4)=O conformers in LOV2 should show a spectral shift of ∼10 nm relative to each other. Strikingly, the low-temperature absorption spectra of several LOV2 domains at 77 K show a splitting of the lowest FMN absorption band (near 474 nm at room temperature) into two bands at ∼470 and 480 nm (35,37,38). Fig. 6 shows the second derivative of the AsLOV2 absorption spectrum of AsLOV2 at room temperature and at 77 K. At room temperature, the main negative band at 480 nm contains a shoulder at ∼470 nm, indicating that at least two spectral forms constitute the absorption band. The envelope observed at room temperature, containing the two peaks at 470 nm and 480 nm, splits into two separate peaks at 470 nm and 483 nm at 77 K. We propose that the 470-nm and 480-nm double band, present at room temperature, is attributable to two C(4)=O conformer populations of the LOV2 domain that have shifted their absorption spectra because of a single and double H-bond to FMN C(4)=O. The doubly H-bonded C(4)=O should be the red-shifted conformer, and was shown to be present at up to 70% in our FTIR data, consistent with the higher amplitude of the “red” 480-nm band compared with the “blue” 470-nm band.
Figure 6.
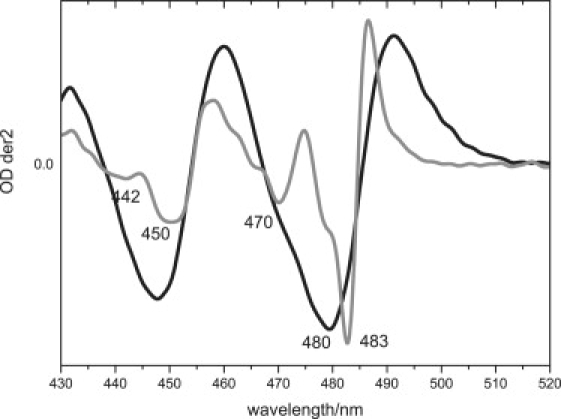
Second derivative of absorption spectrum of AsLOV2/Jα at 300 K (black line) and 77 K (gray line).
Temperature dependence of FMN C(4)=O frequency in the AsLOV2 light state
Fig. 7 shows the frequency of the FMN C(4)=O vibrational mode in the light state as a function of temperature. Upon raising the temperature from 140 K to 300 K, it shifts from 1724(+) cm−1 to 1731(+) cm−1. A similar dependence was reported by Kandori et al. for the phy3LOV2 domain (32). Here, we discuss the C(4)=O temperature-dependent frequency shift in AsLOV2 in relation to recently elucidated x-ray structures at 105 K and room temperature (7). In the dark state, we assign the 1712(−) cm−1 band to a singly H-bonded C(4)=O at room temperature. The downshift from 1716(−) cm−1 to 1712(−) cm−1 upon increasing the temperature is likely attributable to an H-bond strengthening to Gln-513, as observed in AsLOV2 crystal structures at 105 K and at room temperature (7). Part of this shift can also be attributed to compensation by the large, positive band at 1700 cm−1. In the light state, the C(4)=O frequency shows an upshift from 1724(+) cm−1 to 1731(+) cm−1 upon increasing temperature. This shift can be explained by the formation of a hydrogen bond to Asn-492 at low temperature but not at room temperature. Thus, the 1724(+) cm−1 band at low temperature is assigned to C(4)=O, which has lost its H-bond with Gln-513 in the dark state, but is hydrogen-bonded to Asn-492 in the light state. Asn-492 is connected to the D-strand of the β-sheet, which may show a weak and a large-scale motion at low temperature and room temperature, respectively (Fig. 2). Possibly, Asn-492 is pulled away from C(4)=O by β-sheet motion at room temperature. Thus, as proposed by Yamamoto et al (49), the C(4)=O frequency may act as a probe of β-sheet structural changes. This notion is consistent with its position at 1724 cm−1 in LOV1, which does not show any β-sheet changes (44,45).
Figure 7.
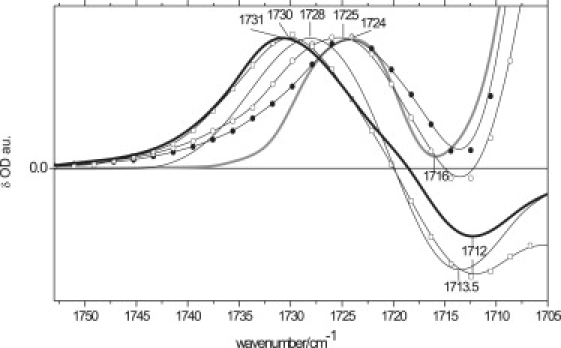
FTIR spectra were recorded in fully hydrated AsLOV2/Jα as a function of temperature in C4=O carbonyl-stretch region between 1750 cm−1 and 1700 cm−1 at 140 K (thick gray line), 180 K (solid circle), 250 K (open circle), 280 K (open square), and 300 K (thick black line). Thin black line shows FTIR spectrum of a partly dehydrated sample (PDS) measured at 300 K.
The AsLOV2 crystal structure shows two possible conformations for Gln-513 in the light state at room temperature, but only one conformer at 105 K. This finding implies the involvement of Gln-513 in the evident upshift upon increasing temperature. Accordingly, the AsLOV2 1724(+) cm−1 band obtained at 140 K can be fitted with a single Gaussian, centered at 1725 cm−1, whereas at 180 K, 230 K, 280 K, and 300 K, two Gaussians are required to fit the bands at 1726 cm−1, 1727 cm−1, 1730 cm−1, and 1731 cm−1, respectively (data not shown). Both Gaussians upshift with temperature in parallel, and are centered at ∼1725–1730 cm−1 and 1730–1735 cm−1, respectively. The C(4)=O bands at 1730 cm−1 and 1735 cm−1 can be attributed to two populations, weakly H-bonded to Asn-492 and/or Gln-513, and non-H-bonded, respectively. Possibly, the 1735 cm−1 band represents a flipped Gln-513 in the AsLOV2 structure.
Temperature dependence of FMN modes in the 1600–1200 cm−1 region
Fig. 3 shows the low-temperature light-minus-dark FTIR spectra of AsLOV2/Jα from 140 K to 300 K in the 1600–1200 cm−1 region. Our spectra exhibit the specific IR bandshift pattern for adduct formation at all temperatures, as reported for other LOV domains (14,32,45,46), and will not be discussed in detail.
In the spectral window from 1200 cm−1 to 1600 cm−1, between 140 K and 250 K, AsLOV2 shows a relatively weak temperature dependence. Most of the bands shift ∼2 cm−1. Above 250 K, however, the FMN C(10a)=N1 stretch bands at 1550(−) cm−1 and 1508(−) cm−1 show a clear amplitude change and a small bandshift, respectively. These latter bands upshift to 1533(+) cm−1 at room temperature in the light state. Below 250 K, the C(10a)=N1 stretch light-state modes show a weaker temperature dependence, with an isobestic point at 1520 cm−1 and a zero-crossing evolving from 1517 cm−1 to 1512 cm−1 at 140 K and 300 K, respectively. Changes at 1539/1520(+) cm−1 were assigned to the FMN C(10a)=N1-C(2)=O stretch system, which is expected to be sensitive to variations in H-bonds at the carbonyls and to the C(4a) sp3 conformation. This suggests slightly different adduct states at different temperatures, because of the altered structure of the FMN binding site. Surprisingly, the positive-band doublet of phy3LOV2 at room temperature is similar to that of AsLOV2 (1539/1520(+) cm−1) below 250 K (32), suggesting a different adduct conformation in AsLOV2 at 280 K. This finding is consistent with NMR data that show different C(4a) characteristics for AsLOV2 and phy3LOV2 at room temperature (51). In addition, this doublet shows some variability among different LOV domains, and its ratio is even reversed in YtvA, where the 1520(+) cm−1 band is higher in amplitude than the band around 1540(+) cm−1. The exact reason for such differences remains unclear. Temperature-dependent changes in C=N stretch modes are accompanied by the disappearance of negative bands at 1469 cm−1, 1450 cm−1, and 1438 cm−1 and 1353(−)/1301(+) cm−1, assigned mainly to δ (C7-C8)/ν(C7/8-Me) (ring I) and δ (C7-Me)/ν(C8/6-C9/7) (rings I and II) and ν(N10-C10a)/ν(C5a-C9a,6) at room temperature. This suggests that at low temperatures and low hydration levels, the formation of the adduct state involves more isoalloxazine modes, particularly in rings I and II. The adduct state under such conditions may be strained by a lack of protein dynamics, and adopts a distorted, high-energy electronic configuration.
Conclusions
The effects of temperature and hydration on the structural dynamics of AsLOV2/Jα were probed, using FTIR spectroscopy. AsLOV2 shows an intense signal in the amide I region, arising mainly from α-helices, accompanied by significant changes in β-sheet modes and high-frequency amide I modes. We interpret the α-helical changes as arising from unbinding of the Jα helix from the PAS core and its subsequent partial unfolding (19), and denote this state S390-III. Importantly, these structural changes only occur under conditions of full hydration and at temperatures of 280 K and higher. Thus, water in its liquid state is required for full motion of the Jα helix. We characterize a newly isolated low-hydration intermediate, denoted S390-I2, which shows a downshift of the amide I band at 1676–1658 cm−1, without complete Jα unfolding. In addition, we report a heterogeneity in AsLOV2/Jα involving two different C(4)=O conformer populations, characterized by carbonyl frequencies at 1712 cm−1 and 1694 cm−1, respectively. The two conformers are assigned to singly and doubly H-bonded FMN C(4)=O, respectively. These two H-bonding conditions at C(4)=O shift the UV-V absorption spectrum of AsLOV2/Jα, resulting in a structured absorption band at 475 nm at room temperature, and a splitting of this band at low temperatures.
Supporting Material
A figure is available at http://www.biophysj.org/biophysj/supplemental/S0006-3495(09)00803-0.
Supporting Material
Acknowledgments
The A. sativa phototropin 1 LOV2 construct was generously provided by Kevin Gardner (Southwestern Medical Center, University of Texas, Dallas, TX).
J.T.M.K. was supported by the Earth and Life Sciences Council of the Netherlands Foundation for Scientific Research via a VIDI grant. M.T.A.A. was supported by the Netherlands Foundation for Scientific Research through the Molecule to Cell Program and the Human Frontier Science Program.
References
- 1.Christie J.M., Briggs W.R. Blue-light sensing and signaling by the phototropins. In: Briggs W.R., Spudich J.L., editors. Handbook of Photosensory Receptors. Wiley-VCH Verlag GmbH & Co.; Weinheim, Germany: 2005. pp. 277–304. [Google Scholar]
- 2.Christie J.M., Swartz T.E., Bogomolni R.A., Briggs W.R. Phototropin LOV domains exhibit distinct roles in regulating photoreceptor function. Plant J. 2002;32:205–219. doi: 10.1046/j.1365-313x.2002.01415.x. [DOI] [PubMed] [Google Scholar]
- 3.Taylor B.L., Zhulin I.B. PAS domains: internal sensors of oxygen, redox potential, and light. Microbiol. Mol. Biol. Rev. 1999;63:479–506. doi: 10.1128/mmbr.63.2.479-506.1999. [DOI] [PMC free article] [PubMed] [Google Scholar]
- 4.Briggs W.R. The LOV domain: a chromophore module servicing multiple photoreceptors. J. Biomed. Sci. 2007;14:499–504. doi: 10.1007/s11373-007-9162-6. [DOI] [PubMed] [Google Scholar]
- 5.Crosson S., Moffat K. Structure of a flavin-binding plant photoreceptor domain: insights into light-mediated signal transduction. Proc. Natl. Acad. Sci. USA. 2001;98:2995–3000. doi: 10.1073/pnas.051520298. [DOI] [PMC free article] [PubMed] [Google Scholar]
- 6.Fedorov R., Schlichting I., Hartmann E., Domratcheva T., Fuhrmann M. Crystal structures and molecular mechanism of a light-induced signaling switch: the Phot-LOV1 domain from Chlamydomonas reinhardtii. Biophys. J. 2003;84:2474–2482. doi: 10.1016/S0006-3495(03)75052-8. [DOI] [PMC free article] [PubMed] [Google Scholar]
- 7.Halavaty A.S., Moffat K. N- and C-terminal flanking regions modulate light-induced signal transduction in the LOV2 domain of the blue light sensor phototropin 1 from Avena sativa. Biochemistry. 2007;46:14001–14009. doi: 10.1021/bi701543e. [DOI] [PubMed] [Google Scholar]
- 8.Swartz T.E., Corchnoy S.B., Christie J.M., Lewis J.W., Szundi I. The photocycle of a flavin-binding domain of the blue light photoreceptor phototropin. J. Biol. Chem. 2001;276:36493–36500. doi: 10.1074/jbc.M103114200. [DOI] [PubMed] [Google Scholar]
- 9.Kennis J.T.M., Crosson S., Gauden M., van Stokkum I.H.M., Moffat K. Primary reactions of the LOV2 domain of phototropin, a plant blue-light photoreceptor. Biochemistry. 2003;42:3385–3392. doi: 10.1021/bi034022k. [DOI] [PubMed] [Google Scholar]
- 10.Schuttrigkeit T.A., Kompa C.K., Salomon M., Rudiger W., Michel-Beyerle M.E. Primary photophysics of the FMN binding LOV2 domain of the plant blue light receptor phototropin of Avena sativa. Chem. Phys. 2003;294:501–508. [Google Scholar]
- 11.Kottke T., Heberle J., Hehn D., Dick B., Hegemann P. Phot-LOV1: photocycle of a blue-light receptor domain from the green alga Chlamydomonas reinhardtii. Biophys. J. 2003;84:1192–1201. doi: 10.1016/S0006-3495(03)74933-9. [DOI] [PMC free article] [PubMed] [Google Scholar]
- 12.Salomon M., Eisenreich W., Durr H., Schleicher E., Knieb E. An optomechanical transducer in the blue light receptor phototropin from Avena sativa. Proc. Natl. Acad. Sci. USA. 2001;98:12357–12361. doi: 10.1073/pnas.221455298. [DOI] [PMC free article] [PubMed] [Google Scholar]
- 13.Crosson S., Moffat K. Photoexcited structure of a plant photoreceptor domain reveals a light-driven molecular switch. Plant Cell. 2002;14:1067–1075. doi: 10.1105/tpc.010475. [DOI] [PMC free article] [PubMed] [Google Scholar]
- 14.Swartz T.E., Wenzel P.J., Corchnoy S.B., Briggs W.R., Bogomolni R.A. Vibration spectroscopy reveals light-induced chromophore and protein structural changes in the LOV2 domain of the plant blue-light receptor phototropin 1. Biochemistry. 2002;41:7183–7189. doi: 10.1021/bi025861u. [DOI] [PubMed] [Google Scholar]
- 15.Salomon M., Christie J.M., Knieb E., Lempert U., Briggs W.R. Photochemical and mutational analysis of the FMN-binding domains of the plant blue light receptor, phototropin. Biochemistry. 2000;39:9401–9410. doi: 10.1021/bi000585+. [DOI] [PubMed] [Google Scholar]
- 16.Alexandre M.T., Arents J.C., van Grondelle R., Hellingwerf K.J., Kennis J.T. A base-catalyzed mechanism for dark state recovery in the Avena sativa phototropin-1 LOV2 domain. Biochemistry. 2007;46:3129–3137. doi: 10.1021/bi062074e. [DOI] [PubMed] [Google Scholar]
- 17.Kasahara M., Swartz T.E., Olney M.A., Onodera A., Mochizuki N. Photochemical properties of the flavin mononucleotide-binding domains of the phototropins from Arabidopsis, rice, and Chlamydomonas reinhardtii. Plant Physiol. 2002;129:762–773. doi: 10.1104/pp.002410. [DOI] [PMC free article] [PubMed] [Google Scholar]
- 18.Losi A., Polverini E., Quest B., Gartner W. First evidence for phototropin-related blue-light receptors in prokaryotes. Biophys. J. 2002;82:2627–2634. doi: 10.1016/S0006-3495(02)75604-X. [DOI] [PMC free article] [PubMed] [Google Scholar]
- 19.Harper S.M., Neil L.C., Gardner K.H. Structural basis of a phototropin light switch. Science. 2003;301:1541–1544. doi: 10.1126/science.1086810. [DOI] [PubMed] [Google Scholar]
- 20.Harper S.M., Christie J.M., Gardner K.H. Disruption of the LOV-J alpha helix interaction activates phototropin kinase activity. Biochemistry. 2004;43:16184–16192. doi: 10.1021/bi048092i. [DOI] [PubMed] [Google Scholar]
- 21.Eitoku T., Nakasone Y., Zikihara K., Matsuoka D., Tokutomi S. Photochemical intermediates of Arabidopsis phototropin 2 LOV domains associated with conformational changes. J. Mol. Biol. 2007;371:1290–1303. doi: 10.1016/j.jmb.2007.06.035. [DOI] [PubMed] [Google Scholar]
- 22.Chen E., Swartz T.E., Bogomolni R.A., Kliger D.S. A LOV story: the signaling state of the phot1 LOV2 photocycle involves chromophore-triggered protein structure relaxation, as probed by far-UV time-resolved optical rotatory dispersion spectroscopy. Biochemistry. 2007;46:4619–4624. doi: 10.1021/bi602544n. [DOI] [PubMed] [Google Scholar]
- 23.Nakasako M., Iwata T., Matsuoka D., Tokutomi S. Light-induced structural changes of LOV domain-containing polypeptides from Arabidopsis phototropin 1 and 2 studied by small-angle x-ray scattering. Biochemistry. 2004;43:14881–14890. doi: 10.1021/bi0485530. [DOI] [PubMed] [Google Scholar]
- 24.Corchnoy S.B., Swartz T.E., Lewis J.W., Szundi I., Briggs W.R. Intramolecular proton transfers and structural changes during the photocycle of the LOV2 domain of phototropin 1. J. Biol. Chem. 2003;278:724–731. doi: 10.1074/jbc.M209119200. [DOI] [PubMed] [Google Scholar]
- 25.Moglich A., Moffat K. Structural basis for light-dependent signaling in the dimeric LOV domain of the photosensor YtvA. J. Mol. Biol. 2007;373:112–126. doi: 10.1016/j.jmb.2007.07.039. [DOI] [PMC free article] [PubMed] [Google Scholar]
- 26.Zoltowski B.D., Schwerdtfeger C., Widom J., Loros J.J., Bilwes A.M. Conformational switching in the fungal light sensor vivid. Science. 2007;316:1054–1057. doi: 10.1126/science.1137128. [DOI] [PMC free article] [PubMed] [Google Scholar]
- 27.Xie A., Kelemen L., Hendriks J., White B.J., Hellingwerf K.J. Formation of a new buried charge drives a large-amplitude protein quake in photoreceptor activation. Biochemistry. 2001;40:1510–1517. doi: 10.1021/bi002449a. [DOI] [PubMed] [Google Scholar]
- 28.Kandori H., Iwata T., Hendriks J., Maeda A., Hellingwerf K.J. Water structural changes involved in the activation process of photoactive yellow protein. Biochemistry. 2000;39:7902–7909. doi: 10.1021/bi000357f. [DOI] [PubMed] [Google Scholar]
- 29.Iwata T., Yamamoto A., Tokutomi S., Kandori H. Hydration and temperature similarly affect light-induced protein structural changes in the chromophoric domain of phototropin. Biochemistry. 2007;46:7016–7021. doi: 10.1021/bi7003087. [DOI] [PubMed] [Google Scholar]
- 30.van der Horst M.A., van Stokkum I.H., Dencher N.A., Hellingwerf K.J. Controlled reduction of the humidity induces a shortcut recovery reaction in the photocycle of photoactive yellow protein. Biochemistry. 2005;44:9160–9167. doi: 10.1021/bi050237d. [DOI] [PubMed] [Google Scholar]
- 31.Balashov S.P., Ebrey T.G. Trapping and spectroscopic identification of the photointermediates of bacteriorhodopsin at low temperatures. Photochem. Photobiol. 2001;73:453–462. doi: 10.1562/0031-8655(2001)073<0453:tasiot>2.0.co;2. [DOI] [PubMed] [Google Scholar]
- 32.Iwata T., Nozaki D., Tokutomi S., Kagawa T., Wada M. Light-induced structural changes in the LOV2 domain of Adiantum phytochrome3 studied by low-temperature FTIR and UV-visible spectroscopy. Biochemistry. 2003;42:8183–8191. doi: 10.1021/bi0345135. [DOI] [PubMed] [Google Scholar]
- 33.Reference deleted in proof.
- 34.Iwata T., Nozaki D., Sato Y., Sato K., Nishina Y. Identification of the C=O stretching vibrations of FMN and peptide backbone by 13C-labeling of the LOV2 domain of Adiantum phytochrome3. Biochemistry. 2006;45:15384–15391. doi: 10.1021/bi061837v. [DOI] [PubMed] [Google Scholar]
- 35.Schleicher E., Kowalczyk R.M., Kay C.W.M., Hegemann P., Bacher A. On the reaction mechanism of adduct formation in LOV domains of the plant blue-light receptor phototropin. J. Am. Chem. Soc. 2004;126:11067–11076. doi: 10.1021/ja049553q. [DOI] [PubMed] [Google Scholar]
- 36.Kay C.W.M., Schleicher E., Kuppig A., Hofner H., Rudiger W. Blue light perception in plants—detection and characterization of a light-induced neutral flavin radical in a C450A mutant of phototropin. J. Biol. Chem. 2003;278:10973–10982. doi: 10.1074/jbc.M205509200. [DOI] [PubMed] [Google Scholar]
- 37.Sato Y., Nabeno M., Iwata T., Tokutomi S., Sakurai M. Heterogeneous environment of the S-H group of Cys966 near the flavin chromophore in the LOV2 domain of Adiantum neochrome1. Biochemistry. 2007;46:10258–10265. doi: 10.1021/bi701022v. [DOI] [PubMed] [Google Scholar]
- 38.Gauden, M., S. Crosson, I.H.M. van Stokkum, R. van Grondelle, K. Moffat, et al. 2004. Low-temperature and time-resolved spectroscopic characterization of the LOV2 domain of Avena sativa phototropin 1. In Femtosecond Laser Applications in Biology. S. Avrillier and J. M. Tualle, editors. Proc. SPIE. 5463:97–104.
- 39.Krimm S., Bandekar J. Vibrational spectroscopy and conformation of peptides, polypeptides, and proteins. Adv. Protein Chem. 1986;38:181–364. doi: 10.1016/s0065-3233(08)60528-8. [DOI] [PubMed] [Google Scholar]
- 40.Huang R., Kubelka J., Barber-Armstrong W., Silva R., Decatur S.M. Nature of vibrational coupling in helical peptides: an isotopic labeling study. J. Am. Chem. Soc. 2004;126:2346–2354. doi: 10.1021/ja037998t. [DOI] [PubMed] [Google Scholar]
- 41.Cheatum C.M., Tokmakoff A., Knoester J. Signatures of beta-sheet secondary structures in linear and two-dimensional infrared spectroscopy. J. Chem. Phys. 2004;120:8201–8215. doi: 10.1063/1.1689637. [DOI] [PubMed] [Google Scholar]
- 42.Brauner J.W., Flach C.R., Mendelsohn R. Quantitative reconstruction of the amide I contour in the IR spectra of globular proteins: from structure to spectrum. J. Am. Chem. Soc. 2005;127:100–109. doi: 10.1021/ja0400685. [DOI] [PubMed] [Google Scholar]
- 43.Nozaki D., Iwata T., Ishikawa T., Todo T., Tokutomi S. Role of Gln1029 in the photoactivation processes of the LOV2 domain in Adiantum phytochrome3. Biochemistry. 2004;43:8373–8379. doi: 10.1021/bi0494727. [DOI] [PubMed] [Google Scholar]
- 44.Iwata T., Nozaki D., Tokutomi S., Kandori H. Comparative investigation of the LOV1 and LOV2 domains in Adiantum phytochrome3. Biochemistry. 2005;44:7427–7434. doi: 10.1021/bi047281y. [DOI] [PubMed] [Google Scholar]
- 45.Ataka K., Hegemann P., Heberle J. Vibrational spectroscopy of an algal Phot-LOV1 domain probes the molecular changes associated with blue-light reception. Biophys. J. 2003;84:466–474. doi: 10.1016/S0006-3495(03)74866-8. [DOI] [PMC free article] [PubMed] [Google Scholar]
- 46.Bednarz T., Losi A., Gartner W., Hegemann P., Heberle J. Functional variations among LOV domains as revealed by FT-IR difference spectroscopy. Photochem. Photobiol. Sci. 2004;3:575–579. doi: 10.1039/b400976b. [DOI] [PubMed] [Google Scholar]
- 47.Barth A. Infrared spectroscopy of proteins. Biochim. Biophys. Acta. 2007;1767:1073–1101. doi: 10.1016/j.bbabio.2007.06.004. [DOI] [PubMed] [Google Scholar]
- 48.Garczarek F., Gerwert K. Functional waters in intraprotein proton transfer monitored by FTIR difference spectroscopy. Nature. 2006;439:109–112. doi: 10.1038/nature04231. [DOI] [PubMed] [Google Scholar]
- 49.Yamamoto A., Iwata T., Tokutomi S., Kandori H. Role of Phe1010 in light-induced structural changes of the neo1–LOV2 domain of Adiantum. Biochemistry. 2008;47:922–928. doi: 10.1021/bi701851v. [DOI] [PubMed] [Google Scholar]
- 50.Alexandre M.T.A., van Grondelle R., Hellingwerf K.J., Robert B., Kennis J.T.M. Perturbation of the ground-state electronic structure of FMN by the conserved cysteine in phototropin LOV2 domains. Phys. Chem. Chem. Phys. 2008;10:6693–6702. doi: 10.1039/b810040c. [DOI] [PubMed] [Google Scholar]
- 51.Eisenreich W., Joshi M., Illarionov B., Richter G., Romisch-Margl W. (13)C isotopologue editing of FMN bound to phototropin domains. FEBS J. 2007;274:5876–5890. doi: 10.1111/j.1742-4658.2007.06111.x. [DOI] [PubMed] [Google Scholar]
- 52.Abe M., Kyogoku Y. Vibrational analysis of flavin derivatives—normal coordinate treatments of lumiflavin. Spectrochim. Acta [a] Mol. Biomol. Spectrosc. 1987;43:1027–1037. [Google Scholar]
- 53.Freddolino P.L., Dittrich M., Schulten K. Dynamic switching mechanisms in LOV1 and LOV2 domains of plant phototropins. Biophys. J. 2006;91:3630–3639. doi: 10.1529/biophysj.106.088609. [DOI] [PMC free article] [PubMed] [Google Scholar]
- 54.Masuda S., Hasegawa K., Ishii A., Ono T. Light-induced structural changes in a putative blue-light receptor with a novel FAD binding fold sensor of blue-light using FAD (BLUF): Slr1694 of Synechocystis sp PCC6803. Biochemistry. 2004;43:5304–5313. doi: 10.1021/bi049836v. [DOI] [PubMed] [Google Scholar]
- 55.Masuda S., Hasegawa K., Ono T. Light-induced structural changes of apoprotein and chromophore in the sensor of blue light using FAD (BLUF) domain of AppA for a signaling state. Biochemistry. 2005;44:1215–1224. doi: 10.1021/bi047876t. [DOI] [PubMed] [Google Scholar]
- 56.Masuda S., Bauer C.E. AppA is a blue light photoreceptor that antirepresses photosynthesis gene expression in Rhodobacter sphaeroides. Cell. 2002;110:613–623. doi: 10.1016/s0092-8674(02)00876-0. [DOI] [PubMed] [Google Scholar]
- 57.Laan W., van der Horst M.A., van Stokkum I.H., Hellingwerf K.J. Initial characterization of the primary photochemistry of AppA, a blue-light-using flavin adenine dinucleotide-domain containing transcriptional antirepressor protein from Rhodobacter sphaeroides: a key role for reversible intramolecular proton transfer from the flavin adenine dinucleotide chromophore to a conserved tyrosine? Photochem. Photobiol. 2003;78:290–297. doi: 10.1562/0031-8655(2003)078<0290:icotpp>2.0.co;2. [DOI] [PubMed] [Google Scholar]
- 58.Anderson S., Dragnea V., Masuda S., Ybe J., Moffat K. Structure of a novel photoreceptor, the BLUF domain of AppA from Rhodobacter sphaeroides. Biochemistry. 2005;44:7998–8005. doi: 10.1021/bi0502691. [DOI] [PMC free article] [PubMed] [Google Scholar]
- 59.Kennis J.T.M., Groot M.L. Ultrafast spectroscopy of biological photoreceptors. Curr. Opin. Struct. Biol. 2007;17:623–630. doi: 10.1016/j.sbi.2007.09.006. [DOI] [PubMed] [Google Scholar]
Associated Data
This section collects any data citations, data availability statements, or supplementary materials included in this article.