

Abstract
Several biophysical techniques have been used to determine differences in the aggregation profile (i.e., the secondary structure, aggregation propensity, dynamics, and morphology of amyloid structures) and the effects on cell viability of three variants of the amyloid β peptide involved in Alzheimer's disease. We focused our study on the Glu22 residue, comparing the effects of freshly prepared samples and samples aged for at least 20 days. In the aged samples, a high propensity for aggregation and β-sheet secondary structure appears when residue 22 is capable of establishing polar (Glu22 in wild-type) or hydrophobic (Val22 in E22V) interactions. The Arctic variant (E22G) presents a mixture of mostly disordered and α-helix structures (with low β-sheet contribution). Analysis of transmission electron micrographs and atomic force microscopy images of the peptide variants after aging showed significant quantitative and qualitative differences in the morphology of the formed aggregates. The effect on human neuroblastoma cells of these Aβ12–28 variants does not correlate with the amount of β-sheet of the aggregates. In samples allowed to age, the native sequence was found to have an insignificant effect on cell viability, whereas the Arctic variant (E22G), the E22V variant, and the slightly-aggregating control (F19G-F20G) had more prominent effects.
Abbreviations used: AFM, atomic force microscopy; AD, Alzheimer's disease; Aβ, amyloid β peptide; CD, circular dichroism; FAD, familial Alzheimer's disease; FTIR, Fourier transform infrared; MTSSL, (1-oxyl-2,2,5,5-tetramethyl-pyrroline-3-methyl) methanethiosulfonate spin label; MTT, (3-(4,5-dimethylthiazol-2-yl)-2,5-diphenyltetrazolium bromide); ppII, polyproline II; SDSL-EPR, site-directed spin-labeled electron paramagnetic resonance; TEM, transmission electron microscopy; WT, wild-type
Introduction
Aggregation processes are related to the misfolding of proteins and subsequent onset of diseases such as AD, transmissible spongiform encephalopathy, and type II diabetes (1). In the case of AD, the disease is associated with the deposition in the brain of fibrils with a characteristic β-sheet structure. However, it was recently postulated that neurotoxicity is more dependent on the presence of oligomeric species (2). The major components of these fibrils and oligomers are the 40- and 42-residue amyloid β peptides. The K17LVFFA21 region (hydrophobic central core) of these peptides has been shown to be important for aggregation, but other regions contribute as well, since several smaller nonoverlapping fragments form fibrils in vitro. Fibrillization, which is a nucleation-dependent process, involves a wide variety of aggregated species ranging from dimers to large fibrils. The overall picture of the ensemble of structures and the kinetics of their reactions on a timescale of weeks will be called the “aggregation profile” in this work.
As in sporadic AD, FAD, an inherited form of AD, promotes neurotoxic effects through different intermediate species, such as protofibrils. Most of the variants related to FAD, such as the Dutch (E22Q), Italian (E22K), and Arctic (E22G) variants, are found in position 22 of the Aβ peptide. The Arctic variant is characterized by an early onset of the disease, and the protofibrils have been suggested as the neurotoxic agent in this FAD (3,4).
Since residue 22 is a determinant for FAD, we analyzed the role of residue 22 in the aggregation and toxicity of the Aβ peptide using a short Aβ fragment, Aβ12–28, and variants thereof (see Table 1 for peptide sequences). We chose this fragment because 1), it includes the central hydrophobic core (residues 17–21); 2), it enables electrostatic and salt bridge interactions involving some of its charged residues (His13, His14, Lys16, Glu22, Asp23, and Lys28) (5,6); 3), it forms fibrils (7); and 4), it may clarify conflicting results obtained with Aβ1–40 and Aβ1–42 in studies focusing on variants at position 22 (8–11). Here we focus on the local effects of the variants using a shorter version of the peptide, in accordance with other recent studies with shorter fragments (12,13).
Table 1.
Aβ12–28 peptide sequences used in this study
| Peptide variant | Nomenclature |
|---|---|
| VHHQKLVFFAEDVGSNK | WT∗ |
| VHHQKLVFFAGDVGSNK | E22G |
| VHHQKLVFFAVDVGSNK | E22V |
| VHHQKLVGGAEDVGSNK | GG |
 |
E11C-MTSSL† |
 |
F20C-MTSSL |
Underlined residues indicate the different substitutions.
The dot in the chemical structure indicates the nitroxide radical.
In this study we used several biophysical methods to investigate the consequences of amino acid exchange at position 22 by comparing the Aβ12–28 peptide native sequence with the Arctic variant (E22G) and a variant not found in FAD patients (E22V). In the variants, the acidic residue 22 of the native sequence is replaced by either the smallest side-chain Gly, which should increase the backbone flexibility, or by a hydrophobic side chain of Val, which is not able to undergo polar interactions. As a less-aggregating control, we also included the double variant F19G-F20G (GG) (14). To characterize the differences in secondary structure as a function of the amino acid at position 22, we used CD and FTIR spectroscopy methods. A Congo red binding assay, AFM images, and TEM micrographs were used to quantify amyloid/fibrillar aggregates and their morphology. SDSL-EPR was used to determine the aggregation dynamics of the different variants. To correlate the biophysical and aggregation profile of the peptides with their toxicity, we also assayed cell viability for the different variants.
Materials and Methods
Sample preparation
Peptides of immunograde purity were purchased from NeoSystem Laboratoire (Strasbourg, France). Fresh samples of the different Aβ12–28 variants were prepared using the protocol described in Jarvet et al. (15). The final concentrations were 0.04 mM or 1 mM in 10 mM sodium phosphate buffer at pH 7.25. The samples were aged by keeping 1 mM of the freshly prepared samples at room temperature for 20–25 days.
CD spectroscopy
Thermal unfolding experiments on fresh samples at 0.04 mM (kept in ice before the starting of the experiment) were acquired in a JASCO 720 spectrometer (JASCO, Easton, MD) with cuvettes of 2 mm pathlength. The temperature was kept stable for 8 min at each temperature step with a PTC-343 temperature controller. The resulting spectra are the average of 10 scans collected at a 100 nm/min scan rate and a detector response time of 2 s at each temperature. Buffer subtraction was used for baseline correction. For the experiments with 1 mM of the aged peptide variant, a 50 μm detachable cuvette was used.
FTIR spectroscopy
FTIR spectroscopy was performed with a Bruker IFS66 spectrometer (Bruker, Ettlingen, Germany) at a resolution of 2 cm−1. A total of 1000 scans were collected. Then 1 mM of each peptide sample in 2H2O was placed between two BaF2 windows with a 30 μm well and the sample was thermostated at 293 K for 30 min before measurements were obtained. Buffer subtraction was performed until the band at 1460 cm−1 (HOD exchange) was almost absent. Sample preparation and aging were carried out as described above but using deuterated reagents.
Electron microscopy
For electron microscopy, 10 μL of the aged samples were placed onto copper grids coated with formvar and carbon, and adsorption of the aggregates was allowed for 10 min. Excess solvent was removed and the grids were washed twice with double-distilled water to remove salts. Staining of the aggregates with a 3% uranyl acetate solution was carried out for 1 min. Another double-distilled water wash was performed and excess of solvent was removed with Whatman paper (Whatman, Kent, UK). The grids were allowed to dry before micrographs were acquired in a Tecnai 12 BT (FEI, Hillsboro, OR) microscope with a Gatan US 1000 P camera (Gatan, Pleasanton, CA).
AFM
AFM measurements were performed on a PICO PLUS microscope (Agilent, Santa Clara, CA) under tapping mode using a 100 μm scanner with acoustically driven cantilevers operating at a resonance frequency in the 5–10 kHz range. The scanning resolution was 512 × 512 pixels. The scanning was performed in trace and retrace to avoid scan artifacts. For ambient imaging, the aged samples of the different variants were diluted 100-fold in MilliQ water (Millipore, Billerica, MA). After 5 min incubation on freshly cleaved mica, the samples were subsequently washed three times with 200 μL MilliQ water and dried overnight at room temperature. The dimensions of the amyloid structures were analyzed by AFM cross-section analysis.
EPR spectroscopy
Aβ11–28 E11C and Aβ12–28 F20C peptides (with a Cys placed in position 11 or 20, respectively) were purchased from NeoSystem Laboratoire (Strasbourg, France). Spin labeling of these Cys-substituted peptides with MTSSL was carried out as previously described (16). A concentration of 0.01 mM of spin-labeled peptide (E11C-MTSSL or F20C-MTSSL) was mixed with 0.99 mM of each of the unlabeled peptides and kept under aging conditions. A control with only 0.01 mM of the spin-labeled peptide was kept under aging conditions. The spectra did not show any line-broadening or significant intensity loss, indicating the absence of aggregates under these conditions.
Continuous-wave EPR spectra were recorded on a Bruker Lexus500 spectrometer (Bruker, Ettlingen, Germany) at 9.8 GHz, and 50 μL of each sample were placed in a 1 mm glass capillary. An average of 25 scans were obtained at a modulation frequency of 100 kHz with 1 G of modulation amplitude over a 100 G scan width. Measurements were carried out at room temperature.
Congo red binding assay
To determine the level of aggregation by Congo red absorption, we used a modified variant of the protocol described in Klunk et al. (17). Aliquots of the peptide sample (final concentration 0.04 mM) were mixed with Congo red (final concentration of 0.003 mM). The absorbance at 400 and 540 nm was recorded in a JASCO V-560 UV/Vis spectrophotometer (JASCO, Easton, MD). The association of Congo red to Aβ aggregates was determined by the following formula:
The values obtained were zeroed for the value of Congo red without peptide sample, yielding the ratio shown below in Fig. 5.
Figure 5.
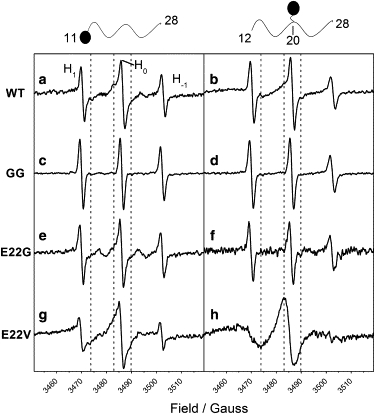
SDSL-EPR of aged Aβ12–28 peptide samples. The different monomeric peptide samples were incubated in 10 mM phosphate buffer at pH 7.25, allowing aggregation for 20 days in the presence of E11C or F20C labeled with MTSSL. The unlabeled peptide being investigated is indicated on the left. The labeled peptide is indicated by a cartoon representation with a circle showing the relative position of the label. The ratio (mM/mM) of unlabeled to labeled peptide was 0.99:0.01, giving a final peptide concentration of 1 mM. The spectral features of the nitroxide spin label are indicated by the H1, H0, and H−1 triplet. The spectra for the different mixtures are plotted in the following order: (a) WT + E11C-MTSSL, (b) WT + F20C-MTSSL, (c) GG + E11C-MTSSL, (d) GG + F20C-MTSSL, (e) E22G + E11C-MTSSL, (f) E22G + F20C-MTSSL, (g) E22V + E11C-MTSSL, and (h) E22V + F20C-MTSSL. Dashed lines are visual guides to help the reader.
MTT cell viability assay
Cell viability was examined by means of the MTT assay, which depends on the reduction of the tetrazolium salt MTT to formazan by living cells. Human SH-SY5Y neuroblastoma cells were cultured in 24-well plates and treated overnight with 0.01 mM of the different Aβ fragments (both aged and freshly prepared). After treatment, an MTT solution (0.3 mg/mL) made in serum-free modified Eagle's medium without phenol red was then added to the cells. After 1 h of incubation at 37°C, the MTT solution was aspirated and DMSO was added to the cells. Aliquots were transferred to a 96-well plate and absorbances were measured at 540 nm in a plate reader (Safire II-Basic; Tecan Austria GmbH, Grödig, Austria). Results were expressed as percentages of the respective value obtained for cells treated with 10 mM sodium phosphate buffer at pH 7.25.
Results
We compared the aggregation profile of different variants of the Aβ12–28 peptide with substitutions at position 22 (Table 1) from the starting point to the formation of fibrils. For that purpose, a comparison of the properties of fresh samples and aged samples (kept at room temperature for 20–25 days) was carried out.
Secondary structure
The thermal stability of the secondary structure of the monomers (freshly prepared sample at 0.04 mM) of the different variants was monitored by CD (Fig. 1). A temperature ramp from 0 to 60°C was performed, and the irreversibility of the secondary structure transitions was evaluated by reacquiring the spectrum at 0°C after the thermal ramp. For one of the peptides (E22V), it was possible to determine the midpoint of the transition by fitting the data to a sigmoid function.
Figure 1.
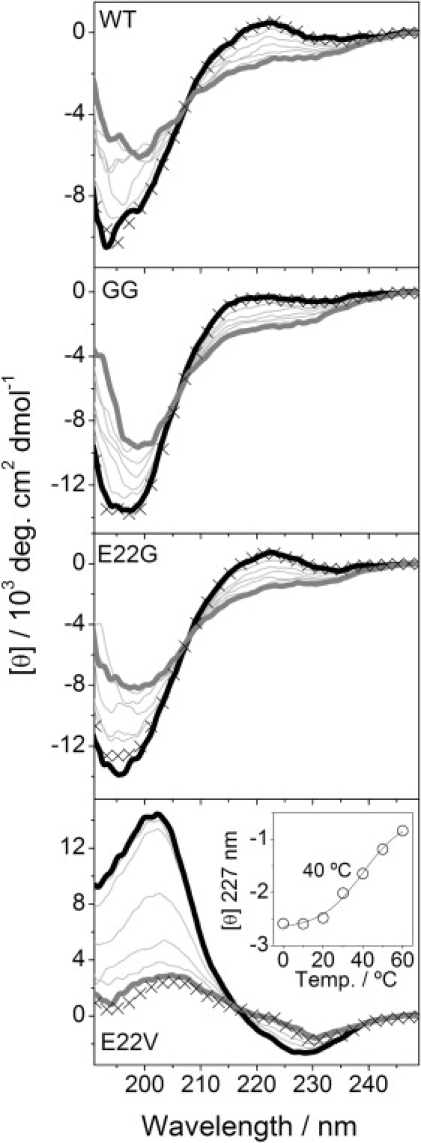
Thermal unfolding of Aβ12–28 variants. Thermal ramps were performed from 0 (thick black line) to 60°C (thick gray line). CD spectra were acquired each 10°C (20, 30, 40, 50°C; thin gray lines). The reversibility was checked by acquiring a 0°C spectrum (represented by × symbol) after the thermal ramp. For E22V, the inset plot shows the evolution of the mean residual molar ellipticity at the specified wavelength. The midpoint of the transition (40°C) is indicated corresponding to the inflection point of sigmoid equation fit. All peptide samples (0.04 mM) were in 10 mM phosphate buffer at pH 7.25 and kept in ice before starting the experiment.
For the Aβ12–28 WT, a statistical distribution of structures (negative intense minimum at 195 nm) with a considerable ppII helix contribution (positive shoulder at ∼220 nm) was detected (Fig. 1) (18). As the temperature increased, the positive shoulder decreased, indicating less ppII helix at higher temperatures. This structural transition was reversible. The variant GG showed less ppII helix contribution at low temperature, and a further decrease was detected at ∼222 nm (reversible transition) as the temperature increased. The Aβ12–28 fragment containing the arctic E22G variant gave CD spectra similar to those obtained for the WT (Fig. 1), and showed a reversible thermal transition corresponding to ppII helix loss. The Aβ12–28 fragment with the E22V variant showed the most striking behavior, with a typical β-sheet spectrum for the fresh sample at 0.04 mM (19), and a maximum at 202 nm and a minimum at 227 nm (Fig. 1). Heating led to an irreversible transition with a midpoint at 40°C, which was accompanied by a loss of the CD signal indicative of the formation of large, light-scattering aggregates.
We analyzed the secondary structure of the aggregated state of the different peptides (1 mM of peptide aged for at least 20 days) by FTIR spectroscopy. This technique is less sensitive than CD to scattering effects induced by aggregation, and has been widely used to assess the secondary structure of proteins (20). The most commonly used band is the amide I band, which is sensitive to hydrogen bonding and secondary structure. To avoid overlap by water absorption in this region, we performed the analysis of the amide I′ band after deuteration of the peptide and subsequent aging of the sample for 20 days.
Fig. 2 shows the secondary structure of the aggregated/high concentration state for the different peptides. For secondary structure assignment, we used the wavenumber intervals defined in Byler and Susi (21). WT showed a typical antiparallel β-sheet spectrum indicated by a low wavenumber band with high intensity (1616 cm−1) and a high wavenumber band ∼10 times less intense (1685 cm−1). The control sample (GG) at 1 mM exhibited a spectrum with a broad and low-intensity band centered at 1643 cm−1 that did not indicate a preference for a particular type of secondary structure. The Arctic variant E22G showed a broad spectrum centered at 1660–1645 cm−1, which is characteristic of the presence of helical structures and sampling of a broad range of Φ and Ψ angles. There was also some β-sheet contribution indicated by a shoulder at 1619 cm−1. The E22V spectrum showed a β-sheet structure similar to that of WT, with the presence of the 1616 and 1685 cm−1 bands.
Figure 2.
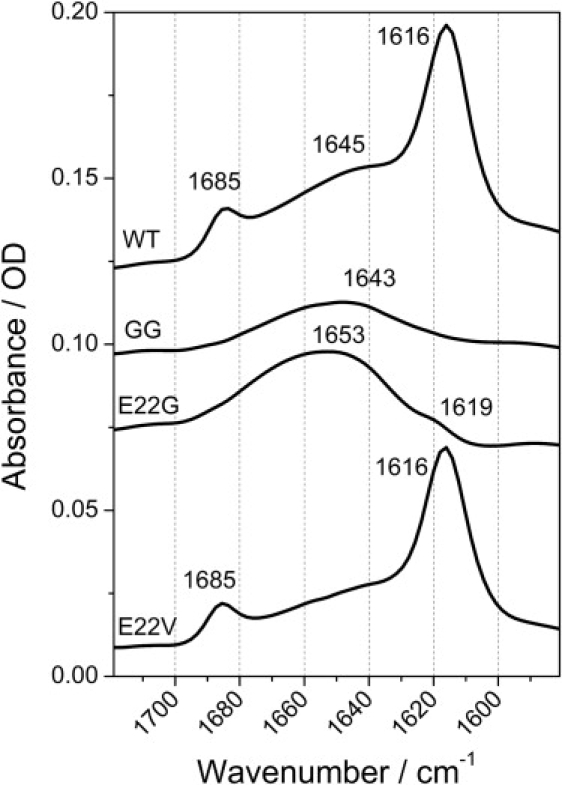
FTIR spectra of aged peptide samples; 1 mM of peptide in 10 mM deuterated phosphate buffer at pH 7.25 incubated for 20 days at room temperature. The amide I′ region for the different peptides is plotted. All the spectra are shown in their original scale, upshifted in the ordinate scale for a clearer presentation.
Using FTIR spectroscopy, we were able to discriminate between the different kinds of aggregates originating from the different peptide sequences. CD spectroscopy could not discriminate between the different secondary structures of samples with high concentration; instead, a loss of the CD signal was evident, probably due to light-scattering effects (data not shown). A similar loss of CD signal was observed for the fresh E22V peptide with increased temperature (Fig. 1).
Amyloid morphology
To assess the morphology of the aggregates obtained with the different peptides, we used TEM (Fig. 3) and AFM (Fig. 4). In the TEM images, the aged WT, E22G, and E22V peptides presented observable aggregates (Fig. 3, a, c, and d), in contrast to the GG peptide (Fig. 3 b). The WT peptide (Fig. 3 a) had the known typical fibrillar morphology (7), with a fibril diameter of ∼5–10 nm. These fibrils were seldom stacked. E22G (Fig. 3 c) showed the same fibril diameter, but these fibrils were arranged in a network-like fashion. Also for E22V (Fig. 3 d) the diameter was between 5 and 10 nm, but the fibrils were highly stacked, indicating a higher degree of packing of these fibrils.
Figure 3.

Electron micrographs of the different Aβ12–28 fragments. The scale bar equals 100 nm except where indicated. Insets show micrographs with different length scales. (a) WT aggregates; the inset scale bar corresponds to 500 nm. (b) GG peptide; no aggregates were observed. (c) E22G aggregates; the inset scale bar equals 2000 nm. (d) E22V aggregates; the inset scale bar equals 500 nm.
Figure 4.
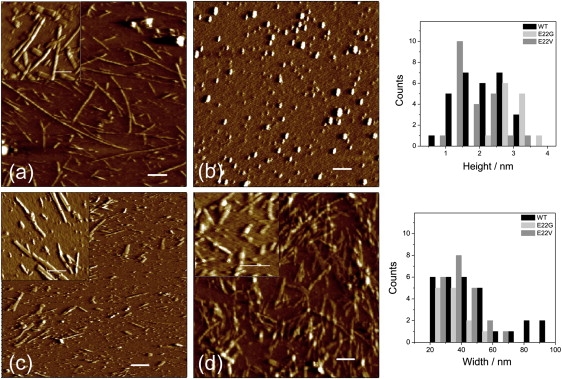
AFM images of the different Aβ12–28 fragments. The scale bar equals 200 nm. The inset scale bar corresponds to 50 nm. (a) WT aggregates. (b) GG peptide. Note the oligomeric forms. (c) E22G aggregates. (d) E22V aggregates. The height and width distribution of the different aggregates is plotted for all the variants except for GG.
AFM analysis provided detail information on the amyloid structures of Aβ peptides. In the AFM analysis shown in Fig. 4, WT formed mature fibrils and other aggregates (Fig. 4 a), which were characterized by a wide distribution of widths measured at a half-height (corresponding to the diameter of the analyzed cross sections). The widths ranged from 20 to 100 nm and the heights varied from ∼1.5 to 3.5 nm. The minimal height detected for WT short filaments was ∼0.5 nm. It is noteworthy that this is below the commonly accepted height for a single amyloid protofilament (∼2 nm as shown in previous studies (22,23)). This indicates that the initial amyloid filaments for Aβ12–28 were significantly thinner than amyloid structures of proteins and polypeptides of larger molecular weight. The longer fibrils were characterized by larger height, which further increased during the lateral assembly and intertwisting of constituting protofilaments. We observed a proportional increase in the periodicity of twisting with increasing width of the fibrils, which may reflect the larger number of filaments involved in the fibril formation. Of interest, ribbon-like assemblies appeared with a width distribution of 40–80 nm and a height distribution of 2.0–2.5 nm (Fig. 4 a, inset), indicating the presence of an additional pathway of fibrillar lateral assembly. Individual oligomers with a height of ∼1.45 nm and width of ∼23.5 nm were also observed, but in significantly smaller amounts.
Large aggregates were absent in the GG peptide sample (Fig. 4 b). Round-shaped assemblies characterized by a very wide distribution of heights (data not shown) were observed. None of them translated into filamentous species even after very prolonged incubation, indicating that these multimeric complexes were most likely the end-product of peptide self-assembly. Probably, the rounded-shaped oligomers are simply formed by the fusing of even smaller oligomeric species present in solution.
The E22G variant formed very rigid and straight rod-shaped structures with heights from 2 to 4 nm, which correspond most likely to individual protofilaments (Fig. 4 c). These structures displayed the tendency to associate laterally together into thicker assemblies with 20–60 nm of width. These rod-like species did not display any tendency to twist or interwind, meaning that they are more likely to be formed by lateral accumulations. This is consistent with the wide distribution of the fibrillar width compared with the relatively narrow distribution in their heights (Fig. 4).
The most massive amyloid structures were observed in the sample of E22V peptide (Fig. 4 d). In the extensive network we detected some individual filamentous structures of ∼1 nm in height, but mostly thick fibrillar bundles. In contrast to the WT peptide amyloids, only relatively short fibrillar aggregates (not exceeding 400 nm in length) were observed on the mica surface. Compared with the amyloid aggregates of E22G peptide, the fibrils of E22V peptide were characterized by significant flexibility reflected in the interwinding of individual protofilaments and in their overall bending. The periodicity along the fibril axis displayed a dependence on width similar to that of the WT peptide amyloid (Fig. 4 a). Some round-shaped oligomeric structures were also present in the sample with ∼1 nm in height and ∼16.5 nm in diameter.
Amyloid dynamics
SDSL-EPR has been used previously to determine the arrangement of amyloid fibrils (24). Inter- and intramolecular distances have been calculated and accurate models of aggregates have been suggested. In this study, we present an SDSL-EPR approach to compare the aggregation behavior of different peptides.
A spin-labeled probe was present during the aggregation process. The probe consisted of an Aβ11–28 native sequence with an E11C substitution or an Aβ12–28 native sequence with a F20C substitution. Thus, after MTSSL labeling, the spin label was located either in the N-terminus (E11C-MTSSL) or in the middle of the Aβ peptide (F20C-MTSSL), yielding two kinds of probe (Table 1). Line-broadening, indicating restriction of movement of a spin label, should be affected by the relative position of the spin label in the peptide and by the aggregation profile of the peptide.
To minimize any sample preparation artifacts due to labeled peptide, the molar ratio of the probe (spin-labeled peptide) to the nonlabeled peptide was kept at 1:100. The different peptides were incubated for at least 20 days in the presence of either one probe or the other. CD spectra at 0.01 mM of these labeled peptides did not show any significant secondary structure changes compared with the WT Aβ12–28 (data not shown). After the incubation, EPR spectra were recorded (Fig. 5). Isotropic rapid tumbling of the spin label is represented by narrow spectral lines. The slower dynamics of the spin label gives rise to broader lines. The GG sample with both probes shows the sharpest EPR lines (comparable to 0.01 mM of spin-labeled peptide alone; not shown), indicating rapid tumbling (Fig. 5, c and d).
The WT peptide gave rise to an EPR spectrum composed of a rapid component and an immobilized component, as indicated by the appearance of shoulders in the H0 line in the presence of both probes (Fig. 5, a and b). Similarly, the N-terminal probe in the presence of the E22G variant showed at least two components indicating immobilization of some of the spin labels. In the presence of the F20C-MTSSL probe, E22G showed mainly a rapid component (Fig. 5 f). The most striking case was E22V, which showed strong immobilization of the spin label in both cases in which the F20C-MTSSL probe showed the most reduced mobility (Fig. 5, g and h). This result is in agreement with the tight packing of the E22V fibrils shown by TEM and AFM.
For all variants except GG, the spectra cannot be explained by single species, indicating a mixture of both rapidly and slowly tumbling species (Fig. 5). This mixture of at least two mobility patterns (slow and fast regimes) was more evident when the label was placed at the N-terminus (Fig. 5, left panel). The observed EPR signals suggest that the degree of incorporation of spin-labeled peptide into tightly packed aggregates varies between the peptide variants and may depend on the properties of the formed aggregates. A high degree of incorporation of the probe into the aggregates should give rise to an EPR spectrum characteristic of an immobilized spin label, and a low degree of incorporation should result in a spectrum dominated by rapidly tumbling spin-labeled peptides free in solution. The EPR spectra, therefore, should depend on both the concentrations of the various aggregated species present and the “tolerance” of the aggregates for the spin-labeled peptide. Accordingly, they should also reflect the three-dimensional structure of the aggregates. From this, it is evident that the three-dimensional structures of the WT aggregates are quite different from those of the E22V variant, although the secondary structure and the amount of aggregates (see the section below) are very similar.
Amyloid quantification
To assess the concentration of the aggregates for the different Aβ12–28 peptide variants, the Congo red binding assay was used (17). This assay was previously used to quantify the fibrillar amyloid state of various peptides (25,26). Fig. 6 a indicates the amount of aggregates reached by the different variants under aging conditions (1 mM of peptide incubated for 20 days at room temperature). E22V and WT reached the highest level of aggregation, followed by E22G (almost twofold less aggregation than WT). The GG control showed some Congo red binding, indicating the presence of aggregates in aged samples. Steady-state Thioflavin T fluorescence measurements were also conducted with the same samples, showing the same trend (data not shown).
Figure 6.
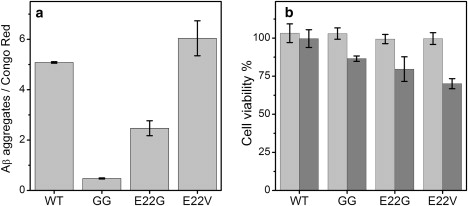
Amyloid quantification and effect on cell viability of the aged Aβ12–28 peptide samples. (a) Congo red binding assay; 3 μM Congo red absorbance was monitored in the presence of a 40 μM aliquot of the aged peptide samples (1 mM initial concentration). The average of at least three independent experiments is plotted and the standard deviation is shown by error bars. (b) MTT assay to assess cell viability. Human SH-SY5Y neuroblastoma cells were incubated overnight in the presence of 0.01 mM of fresh (light gray bars) or aged (gray bars) peptide in 10 mM phosphate buffer at pH 7.25. Three replicates for at least two independent experiments were measured. The cell viability values were normalized for the values obtained for cells treated with buffer alone.
Cell viability
We analyzed the effects of the different peptide variants on the viability of SH-SY5Y neuroblastoma cells. The treatment with 0.01 mM of freshly prepared peptide samples did not show any effect, and the treatment with aged WT peptide also had no effect on cell viability. However, treatment with 0.01 mM of aged samples containing GG, E22G, and E22V decreased cell viability to 86%, 79%, and 70%, respectively (Fig. 6 b). GG is the most surprising case, because any level of toxicity in this slightly aggregating variant is unexpected. For a direct comparison, more-toxic peptides, such as Aβ1–42 and Aβ25–35 at 0.01 mM, have been reported to decrease the viability of human neuroblastoma cells to 32% and 51%, respectively (27).
Discussion
In this study we biophysically characterized the secondary structure, thermal transition, amyloid content, aggregate morphology (i.e., the aggregation profile), dynamics, and toxicity of different variants of the Aβ12–28 fragment to determine the relevance for aggregation and toxicity of residue 22 of the Aβ peptide. The nature of this residue has been shown to be linked to certain forms of FAD, which suggests that it is crucial for the aggregation profile of the peptide. The results presented here give stronger support for that concept.
The Arctic variant (E22G) has been described in patients showing early onset of AD and a protofibril-mediated neurotoxic mechanism (28,29). E22V is a variant that has not been described in patients. However, this variant involves a single nucleotide substitution in the codon for position 22, indicating some probability to occur. We also characterized a slightly aggregating variant (GG) (14), mainly as a control, which in structural terms behaved as expected. The outcomes of this study are summarized in Table 2.
Table 2.
Properties of the different Aβ12–28 variants studied
| Secondary structure∗ |
Thermal transition |
Amyloid / fibrillization |
Spin label incorporation |
Effect on cell viability |
|||
|---|---|---|---|---|---|---|---|
| Fresh sample | Aged sample | Fresh sample | Aged sample | Aged sample | Fresh sample | Aged sample | |
| WT | r.c. / ppII | β | Reversible | +++†/+‡ | Intermediate | No | No |
| GG | r.c. / ppII | r.c. | Reversible | +/− | None | No | Yes |
| E22G | r.c. / ppII | h / β | Reversible | ++/+ | Intermediate | No | Yes |
| E22V | β | β | Irreversible | +++/+ | High | No | Yes |
| Method | CD | FTIR | CD | Congo red / TEM and AFM | SDSL-EPR / TEM | MTT assay | |
Statistical sampling of a broad range of ϕ and ψ angles (r.c.); polyproline II helix (ppII); β-sheet (β); helix (h).
The amount of amyloid content detected in the Congo red experiments is translated into a relative scale (+ for small and +++ for maximal amyloid content).
The presence (+) or absence (−) of fibrils is derived from the TEM and AFM experiments.
E22V showed a β-sheet secondary structure (in both freshly prepared and aged states) and a high propensity to aggregate. The tight packing of these massive aggregates was revealed by TEM and AFM. As compared with WT, the substitution of a polar negatively charged residue (glutamic acid) by a nonpolar neutral amino acid (valine) led to irreversible aggregation even at low concentration (Fig. 1) and increased cell toxicity (Fig. 6 b), but a similar β-sheet secondary structure of the aggregates (Fig. 2). On the other hand, substituting the glutamic acid by the shortest possible side chain (glycine in E22G) reduced the β-sheet propensity, as observed by FTIR. This variant yielded a lower amount of amyloid aggregates, and they showed a different morphology and stacking of the aggregates compared to the native sequence and E22V. Thus, the E22G variant formed very rigid and rod-like amyloid structures in contrast to the more-flexible and intertwisted fibrillar assemblies for WT and the E22V variant. The aged E22G sample was more cytotoxic than the WT. Even the GG variant was cytotoxic, although it produced only a small number of round-shaped aggregates and had no preference for a particular type of ordered secondary structure. Likely, the flexibility introduced by the two glycines prevented the adoption of a particular secondary structure and an ordered arrangement of monomers in the oligomers.
The results show that position 22 (Table 1) is crucial for the aggregation profile of the Aβ fragments. Valine is capable of establishing strong van der Waals interactions, probably packing the aggregates by extending the length of the central hydrophobic core by at least one residue (17–22). On the other hand, the glutamic acid in WT makes strong polar interactions (5). E22V substitutes a strong polar interaction, such as a salt bridge or hydrogen bond, by a strong hydrophobic interaction, resulting in a tighter packing of the thick fibrillar bundles detected by TEM and AFM. Gly22 in E22G has no possibility of interaction, which likely decreases the chances of intermolecular packing, but it does add more flexibility, which then promotes a mixture of secondary structures.
Peptides with β-sheet structure in the aged aggregated state formed amyloid fibrils, as revealed by Congo red assay, TEM, and AFM. However, the correlation is not quantitative. According to previous studies, some of the toxic aggregates possess a high percentage of β-sheet structure. However, other secondary structures may also be toxic, as found in disordered or α-helical toxic intermediates (4). In this study, examples of this are the E22G and the GG variants. The aged state of these low-β-sheet content (if any, for GG) variants affected the viability of human SH-SY5Y neuroblastoma cells, whereas the aged native sequence did not show any effect. This argues for a relatively nontoxic glutamic acid (WT) and a toxic glycine (E22G) at position 22 in this shorter fragment. In both glycine variants, less amyloid aggregates correlated with higher cytotoxicity as compared with the WT.
The process of aggregation of Aβ peptide monomers into different kinds of neurotoxic and nontoxic aggregates is very complex (30). As described in a recent study (12), variants at position 22 and 23 destabilize the folding nucleus of Aβ peptide. The data argue for a rearrangement of the monomer folding core in subsequent aggregation. The Arctic E22G variant leads to higher oligomerization propensity and to a different aggregation profile, mostly because of the elimination of electrostatic interactions (change in the starting point of the aggregation process) (5). Molecular-dynamics simulations have suggested that variants involving residue 22 are not expected to affect the structure of the folding core of Aβ peptide, but rather affect long-range interactions outside the 21–30 sequence (13). Our results provide evidence that substitutions at position 22 of Aβ lead to drastic local effects. Some of these substitutions affect folding of the monomeric Aβ12–28, as indicated by the β-sheet structure of mostly monomeric E22V and less ppII contributions for E22G as compared with WT. This in turn leads to different aggregation profiles as indicated by differences in secondary structure, fibril structure, spin-label incorporation, and Congo red staining. The TEM and AFM images describe somewhat different aspects of the fibril structures, but on the whole the results they present for the different variants (e.g., the absence of fibrillar aggregates for the F19G,F20G (GG) variant and the dense fibrils for the E22V variant) are in agreement.
The different aggregation profiles for Aβ variants detected here call for extra caution when comparing aggregation processes associated with AD and FAD. Since the structures and concentrations of the various oligomeric and aggregated species are different, the neurotoxic mechanisms may also vary between AD and FAD. Knowledge about the structural properties of the different peptide variants involved in FAD is essential for understanding these diseases. As shown here, a single substitution in Aβ can change the structures and concentrations of the various oligomeric and aggregated species. We conclude that this aggregation profile is in general expected to be different for FAD and AD. As a consequence, in vivo modulating factors are also expected to differ. This could result in a higher or lower accumulation of potentially neurotoxic species, such as oligomeric forms of the peptide, or even in different neurotoxic mechanisms.
Acknowledgments
The authors thank Britt-Marie Olsson and Torbjörn Astlind for helpful technical assistance, and Dr. Jens Danielsson and Dr. Göran Eriksson for valuable comments and critical readings of the manuscript.
This work was supported by grants from the Swedish Research Council (to A.G.) and Knut och Alice Wallenbergs Stiftelse (to A.B.), and a Catalan Government Postdoctoral Fellowship “Beatriu de Pinos” (2005 BP-A 10085 to A.P.-M.). Further support was obtained from the European Commission (contract LSHG-CT-2004-512052), the Carl Trygger Foundation, the Marianne and Marcus Wallenberg Foundation, the Swedish Foundation for Strategic Research (Bio-X), and the Swedish Brain Foundation.
Contributor Information
Alex Perálvarez-Marín, Email: apm@dbb.su.se.
Andreas Barth, Email: andreas.barth@dbb.su.se.
References
- 1.Soto C., Estrada L., Castilla J. Amyloids, prions and the inherent infectious nature of misfolded protein aggregates. Trends Biochem. Sci. 2006;31:150–155. doi: 10.1016/j.tibs.2006.01.002. [DOI] [PubMed] [Google Scholar]
- 2.Selkoe D.J. Folding proteins in fatal ways. Nature. 2003;426:900–904. doi: 10.1038/nature02264. [DOI] [PubMed] [Google Scholar]
- 3.Hartley D.M., Walsh D.M., Ye C.P., Diehl T., Vasquez S. Protofibrillar intermediates of amyloid β-protein induce acute electrophysiological changes and progressive neurotoxicity in cortical neurons. J. Neurosci. 1999;19:8876–8884. doi: 10.1523/JNEUROSCI.19-20-08876.1999. [DOI] [PMC free article] [PubMed] [Google Scholar]
- 4.Walsh D.M., Hartley D.M., Kusumoto Y., Fezoui Y., Condron M.M. Amyloid β-protein fibrillogenesis. Structure and biological activity of protofibrillar intermediates. J. Biol. Chem. 1999;274:25945–25952. doi: 10.1074/jbc.274.36.25945. [DOI] [PubMed] [Google Scholar]
- 5.Baumketner A., Shea J.E. Folding landscapes of the Alzheimer amyloid-β (12–28) peptide. J. Mol. Biol. 2006;362:567–579. doi: 10.1016/j.jmb.2006.07.032. [DOI] [PubMed] [Google Scholar]
- 6.Hilbich C., Kisters-Woike B., Reed J., Masters C.L., Beyreuther K. Aggregation and secondary structure of synthetic amyloid βA4 peptides of Alzheimer's disease. J. Mol. Biol. 1991;218:149–163. doi: 10.1016/0022-2836(91)90881-6. [DOI] [PubMed] [Google Scholar]
- 7.Rabanal F., Tusell J.M., Sastre L., Quintero M.R., Cruz M. Structural, kinetic and cytotoxicity aspects of 12–28 β-amyloid protein fragment: a reappraisal. J. Pept. Sci. 2002;8:578–588. doi: 10.1002/psc.418. [DOI] [PubMed] [Google Scholar]
- 8.Miravalle L., Tokuda T., Chiarle R., Giaccone G., Bugiani O. Substitutions at codon 22 of Alzheimer's aβ peptide induce diverse conformational changes and apoptotic effects in human cerebral endothelial cells. J. Biol. Chem. 2000;275:27110–27116. doi: 10.1074/jbc.M003154200. [DOI] [PubMed] [Google Scholar]
- 9.Murakami K., Irie K., Morimoto A., Ohigashi H., Shindo M. Neurotoxicity and physicochemical properties of Aβ mutant peptides from cerebral amyloid angiopathy: implication for the pathogenesis of cerebral amyloid angiopathy and Alzheimer's disease. J. Biol. Chem. 2003;278:46179–46187. doi: 10.1074/jbc.M301874200. [DOI] [PubMed] [Google Scholar]
- 10.Melchor J.P., McVoy L., Van Nostrand W.E. Charge alterations of E22 enhance the pathogenic properties of the amyloid β-protein. J. Neurochem. 2000;74:2209–2212. doi: 10.1046/j.1471-4159.2000.0742209.x. [DOI] [PubMed] [Google Scholar]
- 11.Murakami K., Irie K., Morimoto A., Ohigashi H., Shindo M. Synthesis, aggregation, neurotoxicity, and secondary structure of various A β 1–42 mutants of familial Alzheimer's disease at positions 21–23. Biochem. Biophys. Res. Commun. 2002;294:5–10. doi: 10.1016/S0006-291X(02)00430-8. [DOI] [PubMed] [Google Scholar]
- 12.Grant M.A., Lazo N.D., Lomakin A., Condron M.M., Arai H. Familial Alzheimer's disease mutations alter the stability of the amyloid β-protein monomer folding nucleus. Proc. Natl. Acad. Sci. USA. 2007;104:16522–16527. doi: 10.1073/pnas.0705197104. [DOI] [PMC free article] [PubMed] [Google Scholar]
- 13.Krone M.G., Baumketner A., Bernstein S.L., Wyttenbach T., Lazo N.D. Effects of familial Alzheimer's disease mutations on the folding nucleation of the amyloid β-protein. J. Mol. Biol. 2008;381:221–228. doi: 10.1016/j.jmb.2008.05.069. [DOI] [PMC free article] [PubMed] [Google Scholar]
- 14.Mansfield S.L., Gotch A.J., Harms G.S., Johnson C.K., Larive C.K. Complementary analysis of peptide aggregation by NMR and time-resolved laser spectroscopy. J. Phys. Chem. B. 1999;103:2262–2269. [Google Scholar]
- 15.Jarvet J., Danielsson J., Damberg P., Oleszczuk M., Gräslund A. Positioning of the Alzheimer Aβ (1–40) peptide in SDS micelles using NMR and paramagnetic probes. J. Biomol. NMR. 2007;39:63–72. doi: 10.1007/s10858-007-9176-4. [DOI] [PubMed] [Google Scholar]
- 16.Magzoub M., Kilk K., Eriksson L.E., Langel U., Gräslund A. Interaction and structure induction of cell-penetrating peptides in the presence of phospholipid vesicles. Biochim. Biophys. Acta. 2001;1512:77–89. doi: 10.1016/s0005-2736(01)00304-2. [DOI] [PubMed] [Google Scholar]
- 17.Klunk W.E., Jacob R.F., Mason R.P. Quantifying amyloid β-peptide (Aβ) aggregation using the Congo red-Aβ (CR-aβ) spectrophotometric assay. Anal. Biochem. 1999;266:66–76. doi: 10.1006/abio.1998.2933. [DOI] [PubMed] [Google Scholar]
- 18.Jarvet J., Damberg P., Danielsson J., Johansson I., Eriksson L.E. A left-handed 3(1) helical conformation in the Alzheimer Aβ (12–28) peptide. FEBS Lett. 2003;555:371–374. doi: 10.1016/s0014-5793(03)01293-6. [DOI] [PubMed] [Google Scholar]
- 19.Eker F., Griebenow K., Schweitzer-Stenner R. Stable conformations of tripeptides in aqueous solution studied by UV circular dichroism spectroscopy. J. Am. Chem. Soc. 2003;125:8178–8185. doi: 10.1021/ja034625j. [DOI] [PubMed] [Google Scholar]
- 20.Barth A. Infrared spectroscopy of proteins. Biochim. Biophys. Acta. 2007;1767:1073–1101. doi: 10.1016/j.bbabio.2007.06.004. [DOI] [PubMed] [Google Scholar]
- 21.Byler D.M., Susi H. Examination of the secondary structure of proteins by deconvolved FTIR spectra. Biopolymers. 1986;25:469–487. doi: 10.1002/bip.360250307. [DOI] [PubMed] [Google Scholar]
- 22.Malisauskas M., Zamotin V., Jass J., Noppe W., Dobson C.M. Amyloid protofilaments from the calcium-binding protein equine lysozyme: formation of ring and linear structures depends on pH and metal ion concentration. J. Mol. Biol. 2003;330:879–890. doi: 10.1016/s0022-2836(03)00551-5. [DOI] [PubMed] [Google Scholar]
- 23.Morozova-Roche L.A., Zamotin V., Malisauskas M., Ohman A., Chertkova R. Fibrillation of carrier protein albebetin and its biologically active constructs. Multiple oligomeric intermediates and pathways. Biochemistry. 2004;43:9610–9619. doi: 10.1021/bi0494121. [DOI] [PubMed] [Google Scholar]
- 24.Torok M., Milton S., Kayed R., Wu P., McIntire T. Structural and dynamic features of Alzheimer's Aβ peptide in amyloid fibrils studied by site-directed spin labeling. J. Biol. Chem. 2002;277:40810–40815. doi: 10.1074/jbc.M205659200. [DOI] [PubMed] [Google Scholar]
- 25.Kasai S., Urushibata S., Hozumi K., Yokoyama F., Ichikawa N. Identification of multiple amyloidogenic sequences in laminin-1. Biochemistry. 2007;46:3966–3974. doi: 10.1021/bi062097t. [DOI] [PubMed] [Google Scholar]
- 26.Klunk W.E., Jacob R.F., Mason R.P. Quantifying amyloid by Congo red spectral shift assay. Methods Enzymol. 1999;309:285–305. doi: 10.1016/s0076-6879(99)09021-7. [DOI] [PubMed] [Google Scholar]
- 27.Schaeffer V., Meyer L., Patte-Mensah C., Eckert A., Mensah-Nyagan A.G. Dose-dependent and sequence-sensitive effects of amyloid-β peptide on neurosteroidogenesis in human neuroblastoma cells. Neurochem. Int. 2008;52:948–955. doi: 10.1016/j.neuint.2008.01.010. [DOI] [PubMed] [Google Scholar]
- 28.Paivio A., Jarvet J., Gräslund A., Lannfelt L., Westlind-Danielsson A. Unique physicochemical profile of β-amyloid peptide variant Aβ1–40E22G protofibrils: conceivable neuropathogen in arctic mutant carriers. J. Mol. Biol. 2004;339:145–159. doi: 10.1016/j.jmb.2004.03.028. [DOI] [PubMed] [Google Scholar]
- 29.Whalen B.M., Selkoe D.J., Hartley D.M. Small non-fibrillar assemblies of amyloid β-protein bearing the Arctic mutation induce rapid neuritic degeneration. Neurobiol. Dis. 2005;20:254–266. doi: 10.1016/j.nbd.2005.03.007. [DOI] [PubMed] [Google Scholar]
- 30.Dobson C.M. Protein folding and misfolding. Nature. 2003;426:884–890. doi: 10.1038/nature02261. [DOI] [PubMed] [Google Scholar]