Abstract
We have examined the relative longitudinal flexural resonance frequency shift of a PMN-PT/tin PEMS with a DC bias electric field, E, in humidity detection. We showed that the relative resonance frequency shift could be enhanced by applying an E to the PMN-PT layer during detection. A maximum enhancement of more than three times in resonance frequency shift was observed at E = −6 kV/cm as compared to the resonance frequency shift without a bias field. The maximal relative resonance frequency shift at E = −6 kV/cm was about 1000 times larger than could be accounted for by mass loading alone.
Keywords: Piezoelectric microcantilever sensor, frequency shift, enhancement, DC bias, Young’s modulus, Domain switching
1. Introduction
A piezoelectric microcantilever sensor (PEMS) consists of a highly piezoelectric layer such as lead zirconate titanate (PZT) or lead magnesium niobate-lead titanate (PMN-PT) bonded to a nonpiezoelectric layer such as silica or tin. For biological1–8 or chemical9 sensing, receptor to a target analyte is immobilized on the sensor surface. Binding of the target analyte to the receptor on the sensor surface changes the PEMS resonance frequency shift, which is monitored for detection. Unlike silicon-based microcantilevers, the detection resonance frequency shift of PEMS has been shown to be two orders of magnitude higher than could be expected by mass change alone.1–9 A recent humidity detection study using PMN-PT-based PEMS indicated that the two orders of magnitude detection sensitivity enhancement was a result of the Young’s modulus change in the PMN-PT layer due to non-180° polarization domain switching in the PMN-PT layer.10 Meanwhile, a separate study showed that applying a DC bias electric field (DC field, E thereafter) to the PMN-PT layer changed the Young’s modulus of the PMN-PT layer.11 This indicated that the underlying polarization domain switching that caused the observed Young’s modulus change may be controlled by a DC field and that one may use a DC bias field, E, as a means to further enhance the resonance frequency shift of a PMN-PT PEMS in detection. In this study, we demonstrated that the flexural-mode resonance frequency shift of a PMN-PT PEMS can be further enhanced by applying a DC bias field in humidity detection.
2. Experimental
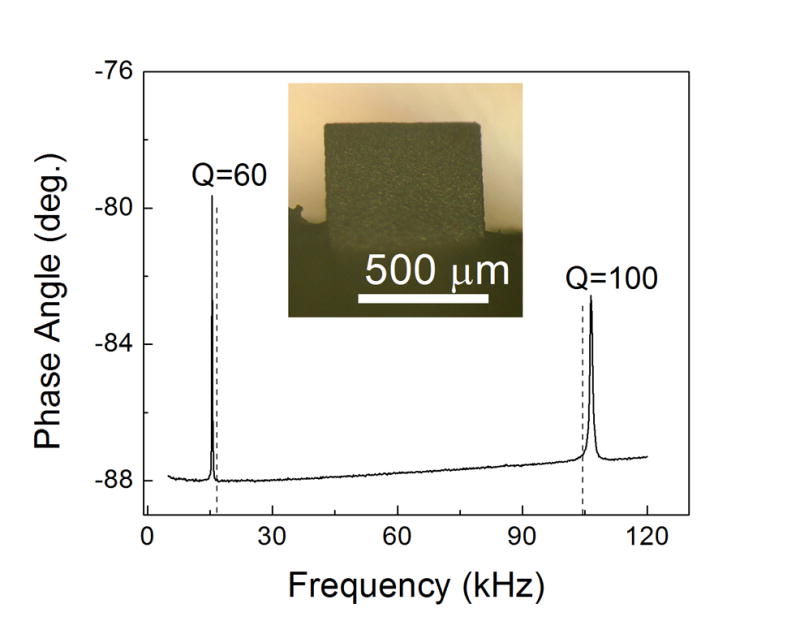
The PMN-PT/tin PEMS used was 650±100 μm long and 700±50 μm wide constructed from an 8-μm thick PMN-PT freestanding film12,13 bonded to a 6-μm tin layer. The PMN-PT/tin PEMS was fabricated and poled as previously described. 10,11 An optical micrograph viewed from the top (gold) side of PEMS is shown as an insert in Fig. 1. The phase angle versus frequency resonance spectrum measured with an electric impedance analyzer (Agilent 4294A, Agilent, Palo Alto, CA) is shown in Fig. 1 where the phase angle, θ = tan−1(Im(I)/Re(I)), was the angle between the real part, Re(I), and the imaginary part, Im(I), of the complex electrical impedance, I. Off resonance the PEMS behaved as a capacitor with θ ≅ −90°. At resonance, the large mechanical vibrations induced a large piezoelectric voltage in phase with the input voltage causing θ to deviate from −90° With the Young’s modulus and density of PMN-PT (tin) being Ep = 80 GPa and ρp = 7.9 g/cm3 (En = 50 GPa and ρn = 7.3 g/cm3), respectively. The theoretically calculated 1st and 2nd flexural-mode resonance frequencies of the PEMS14 are marked by the dashed vertical lines in Fig. 1. That the vertical lines coincided with the peaks around 17 and 105 kHz indicates that they were the 1st and 2nd flexural resonance peaks. The Q values were 60, 100 for the 1st and 2nd peaks, respectively where Q was the ratio of the resonance frequency to the peak width at half the peak height.
Fig. 1.

Phase angle versus frequency flexural resonance spectra of the PEMS. The insert is an optical micrograph of the PEMS.
For humidity detection, the PMN-PT/tin PEMS was placed in a sealed glovebox (Bel-Art Products, Pequannock, NJ). The humidity detection experiment was carried out by measuring the first-mode flexural resonance frequency of the PMN-PT/tin PEMS at various relative humidity levels between 60% relative humidity (RH) and 30% RH with a DC bias electric field ranging from −9 to 9 kV/cm. The temperature inside the glovebox was maintained at 23 ±0.1°C throughout the humidity detection experiments.10
3. Results and discussion
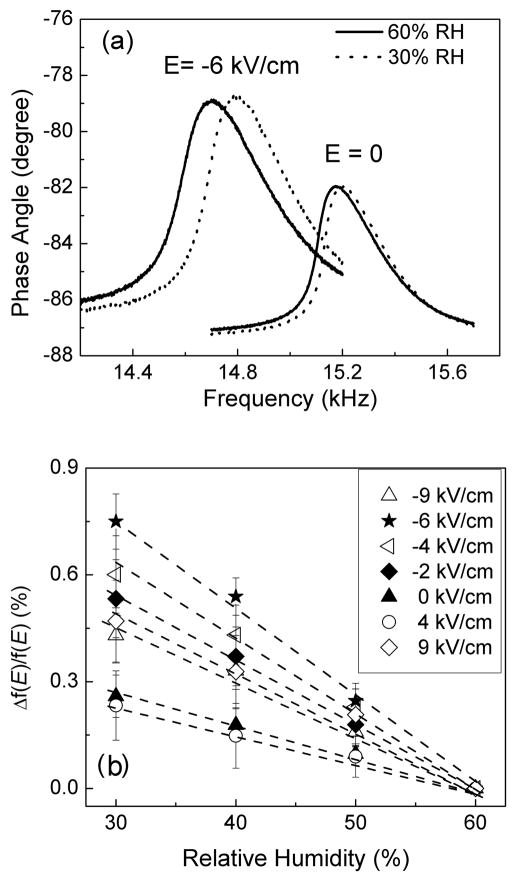
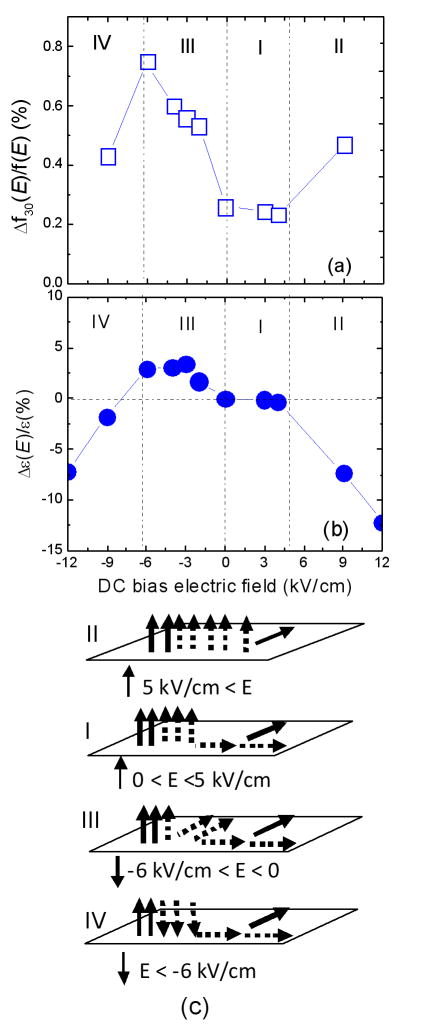
The flexural resonance frequency spectra at 30%RH, and 60%RH obtained at E = 0 and E = −6 kV/cm are shown in Fig. 2(a). Clearly, for the same RH, the resonance frequency was lower at E = −6 kV/cm than at E = 0. Furthermore, the resonance frequency increased with a decreasing RH as a result of desorption of water molecules from the sensor surface only that the resonance frequency shifted much more at E = −6 kV/cm than at E = 0. To more closely examine the effect of E on humidity detection resonance frequency shift, we carried out humidity detection in the same 60–30% humidity range but with a different DC bias electric field. In Fig. 2(b), we plot Δf(E)/f(E) versus RH at various DC bias electric field E where f(E) and Δf(E) were respectively the resonance frequency at 60%RH and the difference between the resonance frequency of a given RH and that of 60%RH measured with a DC bias electric field, E. As can be seen, the magnitude of the slope of Δf(E)/f(E) versus RH for most E≠0 was larger than that of E = 0. To better see the effect of E on Δf(E)/f(E), we plot Δf30(E)/f(E) versus E in Fig. 3(a) where Δf30(E) is resonance frequency shift from 60%RH to 30%RH with a DC bias field, E. As can be seen, Δf30(E)/f(E) increased from about 0.25% for E = 0, to a maximum of about 0.75% at E = −6 kV/cm and to about 0.45 % at E = 9 and 9 -kV/cm. Note that Δf30(E)/f(E) at E = −6 kV/cm and that at 9 and −9 kV/cm were about 3 and 1.8 times the Δf30(E)/f(E) at E = 0, respectively.
Fig. 2.
(a) Phase angle versus frequency resonance spectra at various RHs with E = −6 kV/cm and E = 0, and (b) relative resonance frequency shift Δf(E)/f(E) versus relative humidity at various E. The lines are only to guide the eye.
Fig. 3.
(a) Δf30(E)/f, (b) Δε(E)/ε versus E and (c) schematics of the polarization orientation switching in regions I, II, III, and IV of (a) and (b).
For comparison, the relative resonance frequency shift due to the mass change of the PEMS from desorption of water molecules was deduced using15 (Δf30/f)mass = −Δm/2M where Δm=(ΔΓSn+ΔΓAu)wL and M = (ρptp+ρntn)wL were the mass change and the mass of the PEMS with ΔΓSn and ΔΓAu denoting the water molecule adsorption density change on the tin and gold surface, w and L the PEMS width and length, and ρp = 7.9 g/cm3 and tp = 8 μm (ρn = 7.3 g/cm3 and tn = 6 μm) the density and thickness of the PMN-PT (tin) layer, respectively. The mass density change on the tin surface and that on the gold surface from 60%RH to 30%RH were ΔΓSn = −1.3 and ΔΓAu = −0.4 ng/mm2, respectively.13 The deduced (Δf30/f)mass = 7.9×10⁻⁶, which was 320 times too small to account for the observed resonance frequency shift of 2.5×10⁻³ at E = 0 and about 1000 and 600 times smaller than the resonance frequency shifts of 7.5×10⁻³ at E = −6 kV/cm and 4.5×10⁻³ at either 9 or −9 kV/cm, respectively.
As shown earlier, the resonance frequency shift of the PMN-PT PEMS during humidity detection was a result of the Young’s modulus change in the PMN-PT layer as a result of the non-180° polarization domain switching.10 It is known that the relative dielectric constant of a ferroelectric is sensitive to non-180° polarization domain switching.16,17 To examine if the present DC-biased electric field enhanced resonance frequency shift was due to enhanced non-180° polarization domain switching in the PMN-PT layer, we measured the relative dielectric constant, ε, as a function the DC bias electric field, E. Figure 3(b) shows Δε(E)/ε versus E where Δε (E) = ε(E) − ε and ε and ε(E) are the dielectric constant at E = 0 an E ≠ 0, respectively. As can be seen the relative dielectric constant changes with E. From Δε(E)/ε versus E plot in Fig. 3(b), four regions of behavior may be inferred. In Region I (0 < E < 5 kV/cm) Δε(E)/ε exhibited little change indicating minimal non-180° domain switching in this region. A schematic of the polarization configuration representing region I is shown in I of Fig. 3(c). The minimal change in Δf30(E)/f(E) in region I is consistent with the observed little change in Δε(E)/ε in this region. When E > 5 kV/cm, Δε(E)/ε decreased sharply due to the switching of the in-plane polarization to the direction of the electric field parallel to the polarization. A schematic of Region II is shown as II of Fig. 3(c). For −6 kV/cm < E < 0 (Region III), Δε(E)/ε increased with a negative DC bias electric field, indicating that under a negative DC field, i.e., electric field whose direction was opposite to the polarization some of the initially vertical polarizations switched to an in-plane direction instead of switching directly to the negative field direction as schematically shown in III of Fig. 3(c). For E < −6 kV/cm (Region IV), Δε(E)/ε decreased with an increasing negative DC field, indicating that switching of in-plane polarization to the negative field direction as schematically shown in IV of Fig. 3(c). From Figs. 3(a) and 3(b), one can see that the higher Δf30(E)/f(E) values at −6 kV/cm < E < 0 (Region III) was related to the increased in-plane polarization population in this range. The increase in in-plane polarization due to a negative DC field increased the “switchability” of the polarization domains18 thereby enhancing the resonance frequency shift in the presence of a negative DC field in Region III. Note when the magnitude of the DC field was large enough such as in regions II and IV the DC field coerced the polarization into the field direction, which also enhanced the relative resonance frequency shift even though the effect was not as high as that at E = −6 kV/cm. Note that the polarization in region II was not saturated yet. Both the direction and the magnitude of the polarization could further change with field due to the fact that the PMN-PT was on a rhombohedral (R)-tetragonal (T) morphotropic phase boundary and that more switching between the R phase to the T phase occurred in this region to result in a high Δf30(E)/f(E).
4. Conclusions
In summary, we have investigated the relative flexural resonance frequency shift of a PMN-PT/tin PEMS in humidity detection with a DC bias electric field. It is shown that the relative flexural resonance frequency shift can be enhanced by applying a DC bias electric field to the PMN-PT layer during detection. The maximum enhancement occurred at a DC bias electric field of −6 kV/cm where the negative DC field began to switch the in-plane polarization to the field direction. That the detection flexural resonance frequency shift was enhanced by a DC bias electric field further confirmed that the detection flexural resonance frequency shift of the present PMN-PT PEMS was due to the Young’s modulus change in the PMN-PT layer induced by the polarization orientation switching in the PMN-PT layer. The DC-bias-field-enhanced relative resonance frequency shift at −6 kV/cm was 0.75%, about 1000 times what could be accounted for by mass loading alone.
Acknowledgments
This work was supported in part by National Institutes of Health (NIH) grant R01 EB00720 and by the Nanotechnology Institute (NTI) of Southeastern Pennsylvania.
Footnotes
Publisher's Disclaimer: This is a PDF file of an unedited manuscript that has been accepted for publication. As a service to our customers we are providing this early version of the manuscript. The manuscript will undergo copyediting, typesetting, and review of the resulting proof before it is published in its final citable form. Please note that during the production process errors may be discovered which could affect the content, and all legal disclaimers that apply to the journal pertain.
Contributor Information
Qing Zhu, Department of Materials Science and Engineering, Drexel University, Philadelphia, PA 19104.
Wan Y. Shih, School of biomedical Engineering, Science, and Health System, Drexel University, Philadelphia, PA 19104
Wei-Heng Shih, Department of Materials Science and Engineering, Drexel University, Philadelphia, PA 19104.
References
- 1.Hwang KS, Lee JH, Park J, Yoon DS, Park JH, Kim TS. In-situ quantitative analysis of a prostate-specific antigen (PSA) using a nanomechanical PZT cantilever. Lab Chip. 2004;4:547–552. doi: 10.1039/b410905h. [DOI] [PubMed] [Google Scholar]
- 2.Lee JH, Kim TS, Yoon KH. Effect of mass and stress on resonant frequency shift of functionalized Pb(Zr0.52Ti0.48)O3 thin film microcantilever for the detection of C-reactive protein. Appl Phys Lett. 2004;84:3187–3189. [Google Scholar]
- 3.Lee JH, Hwang KS, Park J, Yoon KH, Yoon DS, Kim TS. Immunoassay of prostate-specific antigen (PSA) using resonant frequency shift of piezoelectric nanomechanical microcantilever. Biosens and Bioelectron. 2005;20:2157–2162. doi: 10.1016/j.bios.2004.09.024. [DOI] [PubMed] [Google Scholar]
- 4.Capobianco J, Shih WY, Shih WH. Methyltrimethoxysilane-insulated piezoelectric microcantilevers for direct, all-electrical biodetection in buffered aqueous solutions. Rev Sci Instr. 2006;77:125105. [Google Scholar]
- 5.Capobianco J, Shih WY, Shih WH. 3-mercaptopropyltrimethoxysilane as insulating coating and surface for protein immobilization for piezoelectric microcantilever sensors. Rev Sci Instr. 2007;78:046106. doi: 10.1063/1.2727466. [DOI] [PubMed] [Google Scholar]
- 6.McGovern JP, Shih WY, Shih WH. In situ detection of Bacillus anthracis spores using fully submersible, self-exciting, self-sensing PMN-PT/Sn piezoelectric microcantilevers. The Analyst. 2007;132:777–783. doi: 10.1039/b704579d. [DOI] [PubMed] [Google Scholar]
- 7.Zhu Q, Shih WY, Shih WH. In situ, in-liquid, all-electrical detection of Salmonella typhimurium using lead titanate zirconate/gold-coated glass cantilevers at any dipping depth. Biosens Bioelectron. 2007;22:3132–3138. doi: 10.1016/j.bios.2007.02.005. [DOI] [PMC free article] [PubMed] [Google Scholar]
- 8.Zhu Q, Shih WY, Shih WH. Real-time, label-free, all-electrical detection of Salmonella typhimurium using lead titanate zirconate/gold-coated glass cantilevers at any relative humidity. Sens Actuator B: Chem. 2007;125:379–388. doi: 10.1016/j.snb.2007.02.030. [DOI] [PMC free article] [PubMed] [Google Scholar]
- 9.Shen Z, Shih WY, Shih WH. Self-exciting, self-sensing PbZr0.53Ti0.47O3/SiO2 piezoelectric microcantilevers with femtogram/Hertz sensitivity. Appl Phys Lett. 2006;89:023506. [Google Scholar]
- 10.Zhu Q, Shih WY, Shih W-H. Mechanism of flexural resonance frequency shift of a piezoelectric microcantilever sensor during humidity detection. Appl Phys Lett. 2008;92:183505. doi: 10.1063/1.2921050. [DOI] [PMC free article] [PubMed] [Google Scholar]
- 11.Zhu Q, Shih WY, Shih W-H. Mechanism of the flexural resonance frequency shift of a piezoelectric microcantilever sensor in a dc bias electric field. Appl Phys Lett. 2008;92:033503. doi: 10.1063/1.2921050. [DOI] [PMC free article] [PubMed] [Google Scholar]
- 12.Shih WY, Luo H, Li H, Martorano C, Shih WH. Sheet geometry enhanced giant piezoelectric coefficients. Appl Phys Lett. 2006;89:242913. [Google Scholar]
- 13.Luo HY. PhD thesis, Colloidal processing of PMN-PT thick films for piezoelectric sensor applications Drexel University. 2005 [Google Scholar]
- 14.Shen Z, Shih WY, Shih W-H. Mass detection sensitivity of piezoelectric cantilevers with a nonpiezoelectric extension. Rev Sci Ins. 2006;77:065101. [Google Scholar]
- 15.Yi JW, Shih WY, Shih WH. Effect of length, width, and mode on the mass detection sensitivity of piezoelectric unimorph cantilevers. J Appl Phys. 2002;91(3):1680–1686. [Google Scholar]
- 16.Xu F, Trolier-McKinstry S, Ren W, Baomin Xu, Xie Z-L, Hemker KJ. Domain wall motion and its contribution to the dielectric and piezoelectric properties of lead zirconate titanate films. J Appl Phys. 2001;89(2):1336–1348. [Google Scholar]
- 17.Haun MJ. PhD thesis, Thermodynamic theory of the lead zirconate-titanate solid solution system. The Pennsylvania State University; 1988. [Google Scholar]
- 18.Liu SF, Ren W, Mukherjee BK, Zhang SJ, Shrout TR, Rehrig PW, Hackenberger WS. The piezoelectric shear strain coefficient of <111>-oriented Pb (Zn1/3Nb2/3)O3-PbTiO3 piezocrystals. Appl Phys Lett. 2003;83:2886–2888. [Google Scholar]


