

Abstract
Detailed understanding of IKs gating complexity may provide clues regarding the mechanisms of repolarization instability and the resulting arrhythmias. We developed and tested a kinetic model to interpret physiologically relevant IKs properties, including pause-dependence and modulation by β-adrenergic receptors (β-AR). IKs gating was evaluated in guinea-pig ventricular myocytes at 36°C in control and during β-AR stimulation (0.1 μmol/L isoprenaline (ISO)). We tested voltage dependence of steady-state conductance (Gss), voltage dependence of activation and deactivation time constants (τact, τdeact), and pause-dependence of τact during repetitive activations (τreact). The IKs model was developed from the Silva and Rudy formulation. Parameters were optimized on control and ISO experimental data, respectively. ISO strongly increased Gss and its voltage dependence, changed the voltage dependence of τact and τdeact, and modified the pause-dependence of τreact. A single set of model parameters reproduced all experimental data in control. Modification of only three transition rates led to a second set of parameters suitable to fit all ISO data. Channel unitary conductance and density were unchanged in the model, thus implying increased open probability as the mechanism of ISO-induced Gss enhancement. The new IKs model was applied to analyze ISO effect on repolarization rate-dependence. IKs kinetics and its β-AR modulation were entirely reproduced by a single Markov chain of transitions (for each channel monomer). Model-based analysis suggests that complete opening of IKs channels within a physiological range of potentials requires concomitant β-AR stimulation. Transient redistribution of state occupancy, in addition to direct modulation of transition rates, may underlie β-AR modulation of IKs time dependence.
Introduction
The delayed rectifier potassium current (IK) accounts for the majority of repolarizing current during the action potential plateau, and its time dependence contributes to the rate-dependent shortening of action potential duration (APD). The slowly activating component of IK, referred to as IKs, is strongly upregulated by phosphorylation through protein kinase A (PKA) (1–3), thus balancing the increase in inward current elicited by β-adrenergic stimulation of ICaL. The IKs channel is constituted by four KCNQ1 proteins, which can form functional homomeric potassium channels, plus an uncertain (probably two) number of KCNE1 β-subunits (4,5). Loss of function of IKs due to KCNQ1 mutations in humans is associated with QT prolongation and a high incidence of Torsade de Pointes (TdP) ventricular tachycardia (LQT1 syndrome) (6,7). In LQT1 patients, TdP typically ensues during physical or emotional stress, conditions that involve high levels of β-adrenergic stimulation (7). Taken together, the β-adrenergic modulation of IKs and the arrhythmic consequences of LQT1 mutations strongly suggest a role of IKs in the complex pattern of current changes required to maintain repolarization stability during sympathetic activation. Because of channel kinetic properties, current amplitude during repolarization is rate-dependent. Thus, in vivo, sympathetic activation modulates repolarization currents by the concurrence of direct action on adrenergic receptors and heart-rate changes. We have shown that these two factors interact in a complex way and that their match may be crucial for repolarization stability (8). Rate-dependent increase in IKs has been generally attributed to incomplete channel deactivation during short diastolic intervals, causing rate-dependent accumulation of channels in the open state. However, this should only affect the magnitude of “instantaneous” IKs appearing during the action potential upstroke, a view disputed by our observation that the “time-dependent component” of IKs onset is mainly enhanced by fast pacing (8,9). This was tentatively interpreted as rate-dependent accumulation of channels in a nonconductive state from which activation may occur rapidly (9). This interpretation has been elegantly formalized by Silva and Rudy (10) in a numerical model of IKs. This model accurately reproduced the features of IKs rate-dependence observed under basal conditions in experiments on guinea pig myocytes.
The purpose of this work was to test whether the complex interaction between direct and rate-dependent effects of β-adrenergic modulations of IKs could be interpreted within the framework of the same kinetic model. To this aim, IKs kinetics and its adrenergic and rate-dependent modulations were evaluated in guinea-pig ventricular myocytes and subsequently used as the reference for identification of the model parameters.
The results obtained extend the applicability of the model structure proposed by Silva and Rudy (10) to a broad range of complex conditions and provide insights on the molecular mechanisms potentially accounting for direct and rate-dependent adrenergic modulation of IKs.
Materials and Methods
The presented investigation conforms to the Guide to the Care and Use of Laboratory Animals published by the U.S. National Institutes of Health (NIH publication No. 85-23, revised 1996) and endorsed by the University of Milan.§
Myocyte studies
Ventricular myocytes from Hartley guinea pigs were used within 12 h from isolation. Whole-cell IKs measurements were performed at 36°C in the presence of ICaL, INCX, and IKr blockade. IKs identity was verified at the end of each experiment by checking complete elimination of time-dependent outward current upon specific IKs blockade. Information on myocyte isolation procedure, experimental solutions, and channel blockers is provided in the Supporting Material (section 1.2).
The voltage dependencies of steady-state activation, activation kinetics, and deactivation kinetics were evaluated by voltage step protocols described in the Supporting Material (section 1.2). Steady-state activation data were fitted by the Boltzmann function, from which midactivation potential (V0.5), inverse slope factor (1/S), and asymptotic current amplitude (Imax) were estimated. IKs kinetics during activation was quantified by biexponential fitting of current onset during the depolarizing steps; to exclude the activation delay, the initial 2% of the time course was not considered. The faster exponential component was used to quantify the kinetics of IKs onset (τact). Pause-dependence of IKs onset kinetics was analyzed by a two-step protocol, as we have described in a previous study (8). Briefly, two activating steps (S1 and S2) were separated by a variable pause. IKs onset during S2 included an instantaneous component, followed by a time-dependent one; the time-dependent component, referred to as “reactivation”, was fitted and its time constant (τreact) was estimated as for activation (11). Dependency of τreact on the S1–S2 interval, referred to as “restitution”, was quantified by monoexponential fitting to yield the restitution time constant (τrest). The same criteria for quantification of IKs kinetics were applied for experimental and model results.
Each experimental protocol was performed in control conditions and in the presence of 0.1 μmol/L of isoprenaline (ISO), a concentration one log unit above the half-maximal effective concentration (12.9 nM) (12)). Control and ISO measurements were performed within the same myocyte, thus allowing for internal comparison.
Statistical analysis
Experimental data are presented as mean ± standard error (SE). Differences in experimental activation, deactivation and reactivation data sets between control and ISO were tested by two-way ANOVA for paired measurements (SAS/LAB software); difference was defined by significance of F statistics for either the treatment factor, or the treatment by voltage interaction. Curve fitting was performed by the least-square method (Origin Microcal 7.0); goodness of fitting was tested by the chi-square test on correlation coefficients (R). Differences between parameter means were tested by Student's t-test for paired measurements, and with post-hoc analysis (SAS/LAB software) in the case of multiple comparisons. Sample size for each protocol is reported in the respective figure legend.
In the analysis of myocyte experiments, curve fitting was performed on data from individual cells and results are reported as the mean ± SE of parameter estimates; in this case, differences between curves were tested by comparing parameter populations. To obtain a reference for model optimization, curves fitted on averaged myocyte data points were also obtained. Parameters from “average” experimental curves (reported without SE) were used only to provide a quantitative comparison with model-generated curves. Parameters obtained by fitting an average curve may differ slightly from the mean of individual cell parameters.
Computational analysis
The Markov model structure (Fig. S1) implemented in this study was derived by Silva and Rudy (10). It describes the properties of IKs, including all of its KCNQ1 and KCNE1 subunits, by means of 15 closed states to account for four independent voltage sensors, each undergoing two conformational changes before channel opening. The group of closed states representing channels for which the first transition has been completed by only part of the four voltage sensors is called “Zone 2”. The group of closed states representing channels in which the first transition has been completed by all four voltage sensors is called “Zone 1”. There are two open states. The whole-cell IKs current is given by:
| (1) |
The variable Po represents the sum of the probabilities of occurrence in the open states, V is the membrane potential, and EKs is the K+ reversal potential. GKs is the maximum membrane conductance obtained as the product of channel density (σ) and the unitary channel conductance (gKs). EKs was set to −72.4 mV, as measured in preliminary experiments (8). GKs was set to 12 nS and remained unchanged under ISO stimulation. GKs dependence on changes in cytosolic Ca2+ was neglected, because ISO modulation of IKs gating was analyzed under conditions ruling out its contribution (with both ICaL and INCX blocked).
The expressions describing transition rates between channel states and their parameters are reported in Tables S1 and S2. Parameter identification was based on model optimization versus experimental data, as described in the Supporting Material (section 1.3). MATLAB 7 and Simulink (The MathWorks, Natick, MA) were used for all the numerical computations.
Implementation of previous Hodgkin-Huxley-type models
To test whether alternative models could reproduce specific IKs features such as pause-dependence (also referred to as “restitution”) of reactivation rate, we implemented the formulations proposed by Terrenoire et al. (13) and by Imredy et al. (12), respectively. The two models were applied (with their original parameter values) to compute IKs and its modulation by ISO in the S1–S2 protocol. This section, presented in detail in the Supporting Material (section 2.2), is summarized here.
Action potential simulations
The effect of 100 nM ISO was simulated by modulation of IKs (according to presented results), ICaL (scaled by a factor of 1.5), and rate of Ca2+ uptake by the sarco/endoplasmic reticulum Ca2+-ATPase (SERCA) flux scaled by a factor of 1.5. Changes in conductances other than IKs were required, because ICaL directly contributes to APD and SERCA flux can indirectly affect the Na+/Ca2+ exchanger current. In the case of ICaL, simple scaling is an approximation of PKA-dependent modulation, which also involves shifts in activation and inactivation voltage dependency (14), but may be adequate for our purposes.
Results
IKs properties in myocytes under control conditions
Voltage dependence of IKs gating properties measured from myocytes in control is illustrated by open symbols in Figs. 1 and 2; sample current records are shown in Fig. S2. Boltzmann fitting of steady-state activation curves of individual cells yielded V0.5 = 26.6 ± 2.5 mV, 1/S = 12.0 ± 0.7 mV, and Imax= 197 ± 26 pA. However, even at the most positive potential tested, steady-state current failed to show clear-cut saturation in most of the experiments; thus, the parameters estimated by Boltzmann fitting should be interpreted with caution and are reported here only for comparison with previous work.
Figure 1.
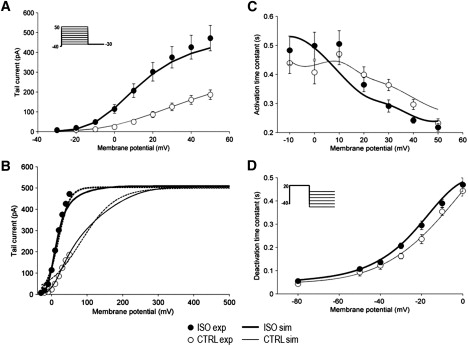
ISO effect on voltage dependence of IKs gating. Experimental data (mean ± SE) shown by symbols (control: open symbols; ISO: solid symbols); model simulations by lines (control: thin lines; ISO: thick lines). (A) Steady-state activation (n = 15). (B) Extension of steady-state activation simulations over a wider range of potentials (experimental data points as in A superimposed for comparison); dotted lines represent Boltzmann fitting of simulated data. (C) Activation kinetics (n = 15); (D) Deactivation kinetics (n = 16). Voltage protocols in inset.
Figure 2.
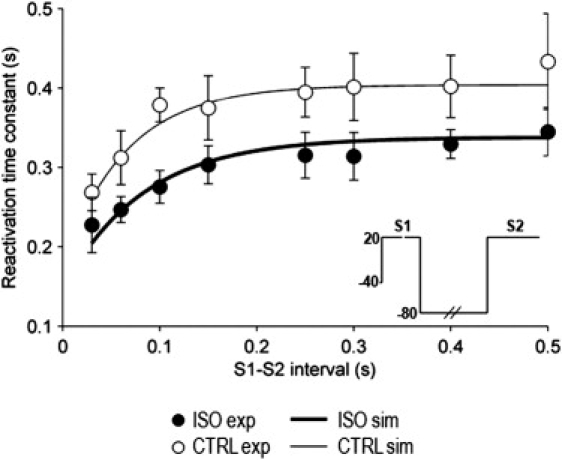
ISO effect on IKs reactivation kinetics and its pause-dependence (restitution, n = 5). Reactivation time constants (τreact) are plotted versus S1–S2 intervals. Meaning of symbols and lines as in Fig. 1. Experimental data points from Rocchetti et al. (8).
The time constant of the fast component of IKs activation (τact, Fig. 1 C) remained unchanged between 0 and 10 mV and decreased between 10 and 50 mV. Deactivation time constant (τdeact, Fig. 1 D) decreased monotonically with membrane hyperpolarization. At 0 mV, deactivation rate did not differ significantly from activation rate (τdeact = 443 ± 22 ms; τact = 407 ± 39 ms, NS).
The reactivation of IKs, analyzed by the S1–S2 protocol, was composed of a time-independent (instantaneous) component and a time-dependent one (Fig. S2 C). As the S1–S2 interval was shortened, the instantaneous component of IKs activation during S2 increased, with a time course reflecting channel deactivation at –80 mV. The time constant (τreact) of the time-dependent component increased as S1–S2 was prolonged. The dependency of τreact on S1–S2 (Fig. 2) was fitted by a single exponential, with a time constant (τrest) of 68.5 ms and an asymptotic value of τreact of 411 ms. Because reactivation after a sufficiently long S1–S2 interval is equivalent to activation from resting conditions, the asymptote of τreact was similar to that ofτact at the same membrane potential (20 mV, τact = 399 ms).
Model identification under control conditions
As described in the Supporting Material (section 1.3), the Markov model (Fig. S1) was optimized to reproduce all the experimental results in control by a single set of parameters. Model simulations of gating voltage dependence in control are shown in Figs. 1 and 2 by thin lines (symbols omitted for clarity); simulations of sample IKs records are shown in Fig. S2. Within the voltage range tested experimentally (≤50 mV), the simulated steady-state activation curve visually overlapped the data (Fig. 1 A); indeed, Boltzmann fitting of simulated points (R2 > 0.99) yielded parameters similar to those obtained by fitting mean experimental values (V0.5 = 25.6 vs. 25.6 mV, inverse slope factor = 14.6 vs. 13.0 mV, and asymptote = 231 vs. 215 pA.). However, extension of simulations to potentials beyond 50 mV showed a further increase in steady-state current, which achieved a saturation value (Imax) of 509 pA at much more positive potentials (Fig. 1 B). Interestingly, the Boltzmann function could not be adequately fitted to the extended activation curve predicted by the model (Fig. 1 B), even if no constraint was put on parameter estimation.
Simulated voltage dependence of τact was consistent with that of experimental data (Fig. 1 C), even if τact was overestimated at 50 mV. Voltage dependence of τdeact was accurately reproduced by simulations over the wide range of membrane potentials tested (Fig. 1 D).
As shown in Fig. 2, IKs reactivation and its restitution were also well predicted by the model; exponential fitting of simulated restitution (R > 0.93) yielded a τrest of 62.9 ms and an asymptotic τreact of 406 ms, with both values similar to those measured in myocytes (68.5 ms and 411 ms, respectively).
To summarize, except for minor quantitative inaccuracy in the prediction of activation rate, the model reproduced IKs gating features examined by all of the protocols. Such a stringent validation confirms the adequacy of the IKs model structure proposed by Silva and Rudy (10).
IKs properties in myocytes during β-adrenergic stimulation
Voltage dependency of IKs gating properties measured from myocytes during exposure to ISO is illustrated by solid symbols in Figs. 1 and 2; sample current records are shown in Fig. S2. β-receptor stimulation by ISO markedly increased IKs amplitude (Fig. 1 A), with smaller but significant effects on its kinetics (Fig. 1, C and D).
Boltzmann fitting of steady-state activation curves of individual cells yielded a V0.5 of 15.7 ± 1.9 mV, a 1/S of 11.9 ± 0.6 mV, and an Imax of 464 ± 62 pA. A significant difference was found for Imax (266 ± 34% of control; p < 0.05; Fig. 1 A) and V0.5 (Δ = −10 ± 2.2 mV; p < 0.05) between ISO and control. However, as in control conditions, also in the presence of ISO, steady-state current failed to show clear-cut saturation.
The voltage dependence of activation time constant (τact, Fig. 1 C) was slightly rotated clockwise by ISO, thus resulting in a slowing of activation between 0 and 10 mV and acceleration between 10 and 50 mV (p < 0.05 for voltage by treatment interaction in ANOVA).
Deactivation was slowed by ISO (Fig. 1 D, p < 0.05 for treatment in ANOVA). In particular, τdeact was increased by a maximum of 59 ms at −20 mV (p < 0.05); at diastolic potential (−80 mV), τdeact was 43 ± 2.5 ms in control and 55 ± 2.9 ms with ISO (NS).
Exponential fitting of the restitution of τreact (Fig. 2) yielded an asymptotic τreact of 339 ± 8 ms (p < 0.05 versus control) and a τrest of 132 ± 30 ms (192% of control; p < 0.05). Thus, ISO significantly accelerated reactivation at all S1–S2 intervals (p < 0.05 for treatment in ANOVA) and slowed the restitution process, thereby extending its influence to a wider range of diastolic intervals.
IKs model identification during β-adrenergic stimulation
ISO effects detected in myocytes were reproduced, within the same model structure used in control, by adjusting the parameters governing the transitions between channel states (Fig. 3). The Gmax parameter (see Eq. 1) was deliberately kept constant to test the hypothesis that its change is theoretically unnecessary to account for IKs response to ISO. The ground for such a hypothesis is discussed in the detail in the Supporting Material (section 3.2).
Figure 3.
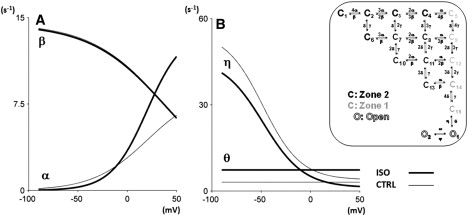
Changes in the voltage dependence of model transition rates (see schematic on the right) required to model ISO effects. (A) Zone 2 forward (α) and backward (β) transition rates. (B) Opening (θ) and closing (η) transition rates. Thin lines for control conditions; thick lines for ISO. Transitions rates unaffected by ISO not shown for simplicity.
Simulations of gating voltage dependence in ISO are shown in Figs. 1 and 2 by thick lines (symbols omitted for clarity); simulations of sample IKs records are shown in Fig. S2. Boltzmann fitting of the simulated steady-state activation curves during ISO yielded a V0.5 of 10.3 mV (−15.3 mV versus control), 1/S of 12.1 mV (−2.5 mv versus control), and an Imax of 436 pA (188% of control). These parameters should be compared with those obtained by fitting mean experimental values, which estimated (R2 > 0.99) a V0.5 of 14.2 mV (−11.4 mV versus control), a 1/S of 11.9 (−1.1 mV versus control), and an Imax of 484.1 pA (225% of control). Thus, when analyzed by Boltzman fit over the physiological range of potentials, modeled and experimental data consistently indicated that ISO increased Imax and shifted V0.5, without changing 1/S. However, when simulations were extended to potentials beyond 50 mV, the same Imax value was achieved in ISO and control (509 pA, Fig. 1 B), ISO markedly increased the steepness of the activation curve (i.e., substantially reduced 1/S), and its Boltzmann fitting, although not yet optimal, was considerably improved compared with that obtained in control (Fig. 1 B).
In the voltage dependence of τact (Fig. 1 C), the crossover between control and ISO curves was reproduced by simulation; however, it occurred at a slightly more negative potential than that occurring in experiments. On the other hand, the voltage dependency of τdeact was also well reproduced by the model in quantitative terms (Fig. 1 D). The model also succeeded in reproducing the complex effect of ISO on IKs reactivation rate and on its restitution process (Fig. 2). Exponential fitting of simulated τreact restitution curves yielded an asymptotic τreact of 338 ms (83% of control) and a τrest of 107 ms (169% of control). Whereas estimates of ISO-induced changes were qualitatively correct, the increase in τrest was slightly underestimated by the model (169% vs. 192%).
Overall, the model was able to qualitatively reproduce all ISO effects, with minor quantitative differences. We then proceeded to identify which transitions in the kinetic scheme (Fig. S1) were crucial in modeling ISO effects.
Model-based analysis β-adrenergic modulation of channel kinetics
As illustrated in Fig. 3, model optimization to reproduce ISO effects resulted in modification of only few among the transition rates of the Markov model, namely α, θ, and η. For each channel monomer, the changes resulted in facilitation of the transition between the first and the second closed state (α increased for V > −20 mV, β minimally affected) and of the final opening transition (θ increased, η decreased). The second voltage-dependent transition (rates γ and δ) and the transition between the two open states (rates ψ and ω), were not modified in reproducing ISO effects.
ISO effects on IKs were first analyzed in steady-state conditions by observing the distribution of state occupancy at different voltage levels (Fig. 4). At resting potential (−80 mV, Fig. 4 A), channels almost exclusively resided in Zone 2, and, up to −40 mV (not shown), ISO minimally affected the occupancy distribution. Upon small depolarization beyond threshold (e.g., 0 mV, Fig. 4 B), ISO increased open-state occupancy at the expense of Zone 2 occupancy, with Zone 1 remaining almost unchanged. At mid-activation potential (20 mV, Fig. 4 C), ISO induced a strong shift from all closed states toward the open ones. For depolarization to 50 mV (Fig. 4 D) in control conditions, the occupancy of closed states (mainly Zone 1) was still substantial (0.6). This situation was dramatically changed by ISO, which caused almost complete channel opening.
Figure 4.
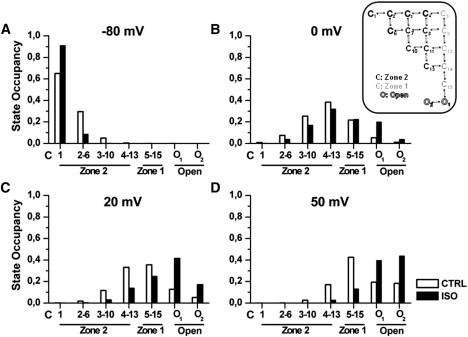
Steady-state distribution of model states occupancy at selected potentials. (A) −80 mV = diastolic. (B) 0 mV. (C) +20 mV ≅ 50% activation. (D) +50 mV ≅ 95% activation in control (open bars) and in ISO (solid bars). States (see schematic on the right) are represented on the abscissa from those farther (Zone 2) to those closer (Zone 1) to channel opening (open). State occupancy is defined as (n of channels in a state)/(total n of channels).
The effect of ISO on the dynamic evolution of state occupancies is analyzed in Figs. 5–8. To this end, simulations were run for conditions maximizing differences between control and ISO (activation Vtest = 30 mV; deactivation Vtest = −20 mV: reactivation S1–S2 interval = 100 and 500 ms).
Figure 5.
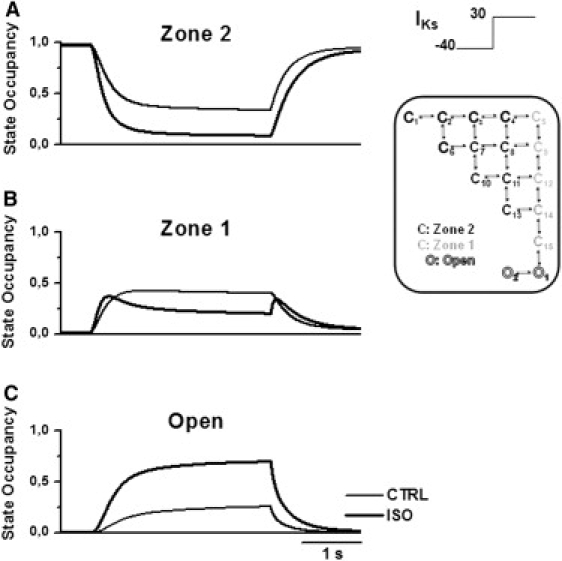
Model analysis of IKs activation course during a V-step protocol (inset) in control (thin lines) and in ISO (thick lines). (A) Zone 2 occupancy. (B) Zone 1 occupancy. (C) Open-state occupancy.
Figure 6.
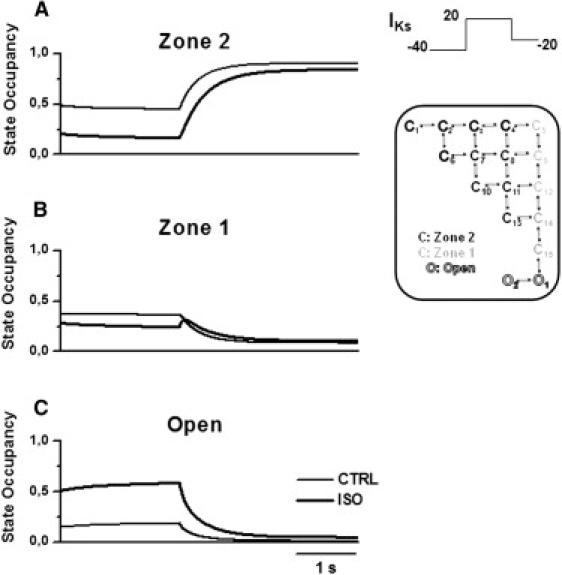
Model analysis of IKs deactivation course during a V-step protocol (inset) in control (thin lines) and in ISO (thick lines). Panels as in Fig. 5.
Figure 7.
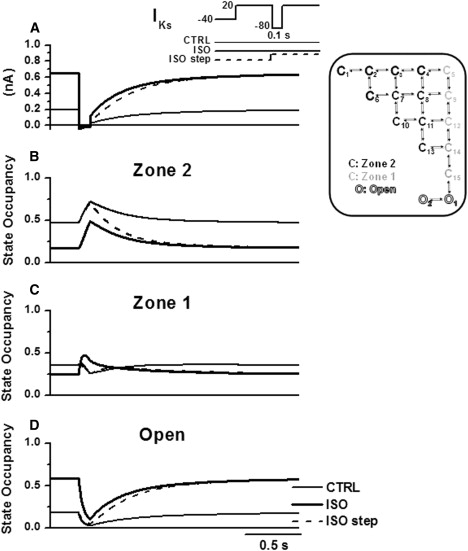
Model analysis of IKs reactivation at a short S1–S2 interval (100 ms) in control (thin line) and in ISO (thick line). Voltage protocols in inset. The dashed line shows the effect of ISO applied after S1 (“ISO step” in inset). (A) Current (IKs). (B) Zone 2 occupancy. (C) Zone 1 occupancy. (D) Open-state occupancy.
Figure 8.
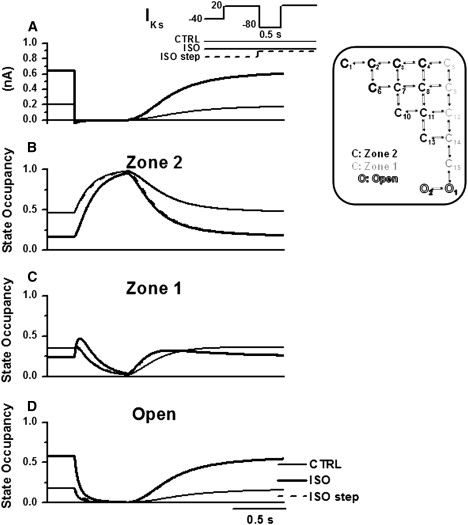
Model analysis of IKs reactivation at a long S1–S2 interval (500 ms). Protocol and legends as in Fig. 7.
During activation (Fig. 5), ISO increased the amount and the velocity of channels exiting Zone 2, thus promoting transient accumulation of channels in Zone 1 (Fig. 5 B). Furthermore, ISO facilitated the opening transition (Fig. 5 C). The two effects cooperated in accelerating IKs onset during activation and led to the opening of the majority of channels. Indeed, after 3 s at 30 mV, 70% of channels opened with ISO compared with 26% in control (Fig. 5 C).
ISO-induced slowing of IKs deactivation was analyzed by simulating repolarization to −20 mV from steady-state activation at 20 mV (Fig. 6). In control conditions, repolarization caused channels to move rapidly from open states, through Zone 1, to Zone 2 (Fig. 6). In the presence of ISO, the flow of channels from open states with increased occupancy met the bottleneck generated by the slow Zone 1–Zone 2 transition. This factor led to a transient accumulation of channels in Zone 1 (Fig. 6 B), which was a hindrance to the transition of channels from the open to a nonconductive state. Thus, albeit directly slowed by ISO (smaller η; see Fig. 3), the closing transition may not represent the only rate-limiting factor for deactivation in this scheme.
IKs pause-dependence (representative of rate-dependence) and its modulation by ISO were analyzed by comparing effects on reactivation at short (100 ms, Fig. 7) and long (500 ms, Fig. 8) S1–S2 intervals. During the S1–S2 interval, channels migrate from the open states to Zone 1 and Zone 2, sequentially. As suggested by Silva and Rudy (10), with shorter S1–S2 intervals reactivation during S2 was faster because of incomplete return to Zone 2 (cf. Fig. 7 B with Fig. 8 B); this decreased the proportion of channels requiring two transitions before opening. ISO enhanced the rate-dependence of IKs instantaneous component and of reactivation rate, respectively, by different mechanisms. The former effect was very small and occurred because of slight deactivation slowing at −80 mV, which prolonged persistence in the open state at short S1–S2 intervals (Figs. 7 D and 8 D). In myocytes ISO mainly affected reactivation rate in two ways: it decreased the steady-state value of τreact and slowed the time course by which the steady-state was achieved (increased τrest). Steady-state reactivation is in fact equivalent to activation; thus, ISO effects on steady-state τreact and on τact (at 20 mV) were unsurprisingly similar and were explained by the same mechanism (see above). A more complex mechanism accounted for the rate-dependent effect of ISO on τreact. Fig. 7 C shows that, in the presence of ISO (thick line), Zone 1 occupancy during the S1–S2 interval transiently increased above the value achieved during S1. This increased the proportion of channels available for direct opening during S2. In turn, the ISO-induced increase in Zone 1 occupancy during the S1–S2 interval was the consequence of the large increase in open-state occupancy during S1 (Fig. 7 D, thick line). This interpretation was tested in the model by introducing ISO-induced gating changes only at the beginning of the S1–S2 interval. Under this condition (Figs. 7 and 8, dashed line), probability of open-state occupancy was not increased during S1, no Zone 1 channel accumulation occurred during the S1–S2 interval (in Fig. 7 C, dashed line initially overlaps with control line), and reactivation during S2 was slower than that achieved when ISO was applied throughout the entire protocol (Fig. 7 A, cf. dashed and thick lines). The dashed-line reactivation was still faster than the control one (Fig. 7 A, thin line) because of pause-independent (i.e., steady-state) ISO effect on τreact. The difference in reactivation rate between the thick and dashed lines in Fig. 7 A represents the pause-dependent component of ISO effect, which accounts for the slowing in the restitution process. Indeed, Fig. 8 C shows that, at long S1–S2 intervals, ISO-induced channel accumulation in Zone 1 dissipates before reaching S2, thus leading the thick and dashed lines to overlap during reactivation (Fig. 8 A).
Comparison with reactivation kinetics in Hodgkin-Huxley-type models
A comparison of IKs reactivation between the presented and HH-type models is shown in Fig. S3. The model by Terrenoire et al. (13) included three independent but identical gates. Some pause-dependence of reactivation rates could be generated by such formulation, but it did not reproduce experimental observations, because the time range of restitution was too narrow and insensitive to ISO. This is because pause-dependence of reactivation rate required diastolic deactivation to be incomplete at the time of S2; therefore, modulation of residual activation was constrained by the small effect of ISO on τdeact at −80 mV (Fig. 1 D). This explains why, although Terrenoire's formulation may in principle accommodate restituition of reactivation rates, it cannot reproduce experimental observations (Fig. S4).
Imredy's formulation (12) failed to reproduce reactivation pause-dependence (Fig. S4). In this model, gating was simulated by the product of two gating components with independent and strongly different kinetics. Reactivation pause-dependence could not be reproduced at all because of the specific formulation of the gating components. Even if pause-dependence of reactivation rate could be reproduced in this model, it would still rely on incomplete diastolic deactivation.
In summary, depending on the specific formulation, Hodgkin-Huxley (H-H)-type models may incorporate pause-dependence of reactivation rate in principle; nevertheless, they cannot reproduce experimental data in terms of magnitude and response to ISO. This is mainly because, in H-H models, pause-dependence of reactivation rate depends uniquely on incomplete diastolic deactivation (i.e., gating variables > 0 at the onset of S2), which strictly constrains the model output. This is not the case for Markov models, in which redistribution between sequential closed states can contribute to explain the phenomenon. The results obtained with Terrenoire's and Imredy's models are illustrated and discussed in further detail in the Supporting Material (section 2.2).
Action potential simulations
In guinea-pig myocytes, ISO causes counterclockwise rotation of the relationship between APD and stimulation cycle length (CL) (8), with convergence of control and ISO relationships at a CL of 0.15 s. To test the performance of modeled IKs in simulating such an effect, we incorporated the presented IKs formulation in an action potential model (10,15). Under control conditions, the model generated an APD/CL relationship comparable to that observed in guinea pig myocytes, and incorporation of ISO-induced changes reproduced its counterclockwise rotation (Fig. S5). The model-generated control and ISO relationship converged at a CL of 0.7 s, which was significantly longer than the CL observed experimentally. ISO modulation of APD reflected the balance between the opposite effects of ICaL and INCX enhancement on one side and IKs enhancement on the other. The CL at which opposite contributions balance each other is highly sensitive to their relative magnitudes and rate-dependence. Therefore, modulation of ICaL and SERCA other than arbitrary scaling may be required to achieve quantitatively accurate simulation of ISO effects.
β-adrenergic stimulation was then reproduced in the presence of a 50% reduction in IKs maximal conductance (Fig. S5). In this case, counterclockwise rotation was accompanied by an upward shift of the whole APD/CL relationship and, at CL ≥ 1.5 s, repolarization failed. The effect of such partial IKs reduction was large compared with that of repolarization abnormalities in human long QT syndromes with almost complete loss of IKs function (16). Such a difference may reflect the larger role of IKs in guinea-pig repolarization, for which the action potential model was developed.
Discussion
The presented experimental results extensively describe IKs gating properties in guinea-pig myocytes and their modulation by ISO. In model simulations all baseline IKs features could be reproduced by a single set of kinetic parameters and ISO-induced effects were reproduced, within the same model structure, by changes in the parameters governing selected transitions. Analysis of the model adjustments necessary to reproduce ISO effects leads to several “inferential” conclusions on the modulation of IKs gating by β-AR stimulation.
IKs properties in myocytes
PKA-dependent modulation of IKs gating properties were previously described in heterologously expressed human channels and native guinea-pig myocytes (13,17). The purpose of our experiments was to fully characterize gating of native IKs and its β-adrenergic modulation under strictly uniform conditions, as necessary in developing and testing a comprehensive model with quantitative accuracy.
A feature of IKs consistently observed in this and in many other studies (3,18,19) is failure of its steady-state activation to saturate within the range of potentials that can be tested experimentally in myocytes (<50–60 mV), and up to 120 mV in heterologous KvLQT1/IsK (20). In the absence of clear-cut saturation, Imax estimation by Boltzmann fitting is arbitrary; regardless, adrenergic modulation of IKs activation is routinely analyzed in terms of changes in parameters estimated from Boltzmann fitting. When such an approach was applied to the data, ISO effect on steady-state activation consisted of a large increase in Imax and a smaller negative shift of V0.5, which is in line with previous findings. Extension of steady-state activation analysis to a wider range of potentials by model simulations suggests that this approach might be misleading (see section on model-based analysis of adrenergic modulation, below). Thus, ISO-induced changes in Boltzmann parameters should not be interpreted mechanistically.
ISO increased activation rate and slightly slowed deactivation rate. ISO-induced changes in IKs dependency on interpulse interval included an increase of reactivation rates and a slowing of their restitution. Consistent with the nonsignificant effect of ISO on IKs deactivation rate at −80 mV (Δτdeact = +12 ms at −80 mV), pause-dependence of IKs instantaneous component was almost unaffected. Faster reactivation may partly reflect ISO-induced acceleration of activation rate; however, at short S1–S2 intervals, reactivation (in S2) was accelerated more than activation (in S1), and the restitution course was also affected.
This complex pattern of changes provides highly stringent conditions for testing any kinetic scheme; thus, the performance of the relatively simple model applied in this work was almost surprising. In light of this, the gating mechanisms suggested by model simulations, albeit theoretical, deserve to be considered in detail.
Mathematical model of IKs
To encompass the wide spectrum of IKs properties tested in the presented study, we adopted a Markov-type model structure, previously demonstrated by Silva and Rudy (10) to adequately reproduce IKs complex features under baseline conditions. Several features of our control data were not correctly reproduced using the parameters published by Silva and Rudy (10), which resulted in excessive maximal conductance, slow deactivation rates (especially for Vm > −50 mV), and unsatisfactory fitting of the pause-dependence of reactivation rates (restitution). This may result from quantitative differences between the presented results and those of Lu et al. (21), used as a reference for parameter optimization by Silva and Rudy (10).
The single set of parameters identified by the optimization procedure was adequate to reproduce all IKs features observed under baseline conditions. The voltage dependence of steady-state activation predicted by the model could not be fitted by a Boltzmann function, even if no constraint was put on its parameters. This observation can be interpreted in terms of channel kinetics. Indeed, because a Boltzmann function describes a single transition between closed and open states, it may not be adequate to model multiple sequential transitions over the whole range of activation voltages. In terms of IKs dynamic behavior, the presented results lead to the relevant conclusion that interpretation of pause-dependence of reactivation rates can be effectively explained by redistribution of channels to states nearer to the open one within a single chain of Markov states (i.e., no requirement of transition between different gating modes). A more detailed discussion of IKs gating features relevant to its modeling is also provided in the Supporting Material (section 3.1).
Modeling of β-adrenergic IKs modulation has been previously addressed by H-H-type formulations, in which IKs kinetics were represented by the product of multiple (2 (12,22) or 3 (13) identical (13,22) or nonidentical (12)) gating variables, as required to reproduce the initial lag in current activation. However, it was unclear to what extent these models could reproduce the complex pause-dependence of IKs reactivation rate, a feature observed for both heterologously expressed human channels (11) and native ones (9) and modulated by β-adrenergic receptors (8). This issue was addressed by implementing previous H-H-type models and applying them to the presented experimental data. This analysis showed that, although H-H models can in principle reproduce pause dependence of reactivation rate, failure to consider sequential (not independent) transitions between closed states strictly constrains their output, thus making it unsuitable to match experimental observations. The presence of sequential transitions for the activation of each independent KCNQ1 subunit, such as those implemented in the presented model, are suggested by experimental evidence (23). The presented results support the concept that sequential gating may be necessary to account for IKs kinetic behavior and its modulation.
Model-based analysis of IKsβ-adrenergic modulation
According to Boltzmann analysis, the most prominent effect of ISO consists in a large increase in Imax (Fig. 1 A). In previous models (13,22), such an increase was reproduced by an increment in the term GKs of Eq. 1, which implies an increase in gKs, in channel density (σ), or both.
To our best knowledge, modulation of gKs by protein phosphorylation has been described exclusively in nonvoltage-gated channels (gap-junctions, AMPA-R, RyR) (24–26), whereas the possibility of ISO-induced changes in gKs has not been experimentally tested because of difficulties in recording IKs single-channel currents. On the other hand, modulation of σ might occur with a time course roughly compatible with the response of IKs amplitude to ISO (27), but it would not account for changes in the voltage dependence of current kinetics (for detailed discussion see the Supporting Material, section 3.2). These considerations motivate the interest in testing the unitary interpretation that all ISO effects on IKs may be mediated by changes in channel Po.
Model fitting to data points under control conditions identified a set of gating parameters that estimated an open probability of 0.4 at 50 mV, the most positive potential experimentally tested; maximal conductance was achieved only at potentials exceeding the physiological range. According to this interpretation, the apparent ISO-induced increase in Imax was instead a simple increased Po within the range of potentials tested, and may reflect enhanced sensitivity of the activation gating to membrane depolarization. In this context, IKs “reserve” available to recruitment through receptor stimulation would amount to 60% of the total channel population and correspond to the fraction of channels still residing in Zones 2 and 1 during depolarization at 50 mV (Fig. 4). The magnitude of available reserve identified by our results is far larger than that predicted by the original Silva and Rudy model (10). Indeed, simulations carried out with their parameters (not shown) resulted in more than 90% of channels being open upon depolarization at 50 mV under baseline conditions. This implies that a biologically implausible increase in GKs would still be required in the original model formulation to account for the large effect of ISO on maximal steady-state current. Nevertheless, such a limitation was overcome in the presented study by acting exclusively on transition rates, thus proving that the Silva and Rudy kinetic scheme (10) can accommodate a wider range of observations. Interestingly, the Boltzmann function fitted the predicted activation curve much better in ISO than in control (Fig. 1 B). This may result from an apparent lumping of sequential closed-state transitions, resulting from the steeper voltage dependence of their rates (α-parameter, Fig. 3 A).
The effects of ISO on the complex time-dependent behavior of IKs were also well reproduced by the model. The opening transition rate was directly modulated by ISO; however, a relevant feature underlying ISO effects on current time course after membrane potential changes was transient “accumulation” of channels in states near to the open one (Zone 1). By analogy with the concentration of reactants in a chemical reaction, such an accumulation contributes to determine the flow of channels between states. Transient changes in occupancy are, in turn, the consequence of modulation of transition rates. However, the latter may be far more complex than is direct modulation of channel opening; indeed, a change in occupancy may reflect the net balance between effects on multiple transitions, including those between nonconductive states. In terms of channel structure, this implies that stabilization at diastolic potential of a conformation corresponding to an intermediate closed state might paradoxically increase the kinetics of current onset during activation.
Study limitations
The guinea pig was chosen as the animal model for this analysis because it has a robust IKs expression even under baseline conditions; moreover, the original model formulation was developed for this species. However, important differences in IKs expression level and kinetics exist between the guinea pig and larger mammals (dog and man) (3,28,29); therefore, these observations may not directly extrapolate to those species.
Parameter optimization was performed on several mutually independent IKs properties; this should minimize the number of suitable parameters combinations. Still, the procedure of nonlinear optimization does not guarantee uniqueness of the identified parameters in generating a set of current properties. Thus, interpretation of ISO effects, as is always the case for modeling studies, is subject to uncertainty. Moreover, in terms of mechanistic interpretation, modeling only proves that a given degree of complexity can reproduce the observed behavior, but it does not rule out more complex mechanisms.
Because we focused this study on β-adrenergic modulation of IKs gating, results on action potential simulations should only be considered as preliminary. Indeed, a more accurate modeling of β-AR modulation of cellular targets other than IKs would be necessary to predict in quantitative terms the impact of IKs modulation on whole-cell electrophysiological function.
Conclusions
The presented results show that the full complexity of IKs kinetics and of its β-AR modulation can be accounted for by the relatively simple kinetic scheme proposed by Silva and Rudy (10). Because the study was performed on native IKs, the modeled behavior is the one resulting from all channel α- and β-subunits considered as a functional unit. Model analysis of ISO effects provides a novel putative interpretation of agonist-induced changes in maximal channel conductance and highlights the importance of redistribution of state occupancy in determining IKs time dependence.
Acknowledgments
We are grateful to Dr. N. Szentandrassy for performing part of the experiments, to Dr. R. Ambrosini for assistance in statistical analysis, to F. Canella for her help with the simulations, and to Dr. E. Grandi for her critical review of the manuscript.
This work was partially funded by an institutional grant to A.Z. (Fondo di Ateneo per la Ricerca, Università Milano-Bicocca 2007) and by Hospal SpA grant to S.S.
Supporting Material
References
- 1.Sanguinetti M.C., Jurkiewicz N.K., Scott A., Siegl P.K. Isoproterenol antagonizes prolongation of refractory period by the class III antiarrhythmic agent E-4031 in guinea pig myocytes. Mechanism of action. Circ. Res. 1991;68:77–84. doi: 10.1161/01.res.68.1.77. [DOI] [PubMed] [Google Scholar]
- 2.Marx S.O., Kurokawa J., Reiken S., Motoike H., D'Armiento J. Requirement of a macromolecular signaling complex for β adrenergic receptor modulation of the KCNQ1-KCNE1 potassium channel. Science. 2002;295:496–499. doi: 10.1126/science.1066843. [DOI] [PubMed] [Google Scholar]
- 3.Volders P.G.A., Stengl M., van Opstal J.M., Gerlach U., Spatjens R.L.H.M. Probing the contribution of IKs to canine ventricular repolarization: key role for β-adrenergic receptor stimulation. Circulation. 2003;107:2753–2760. doi: 10.1161/01.CIR.0000068344.54010.B3. [DOI] [PubMed] [Google Scholar]
- 4.Chen H., Kim L.A., Rajan S., Xu S., Goldstein S.A.N. Charybdotoxin binding in the IKs pore demonstrates two MinK subunits in each channel complex. Neuron. 2003;40:15–23. doi: 10.1016/s0896-6273(03)00570-1. [DOI] [PubMed] [Google Scholar]
- 5.Morin T.J., Kobertz W.R. Counting membrane-embedded KCNE ± subunits in functioning K+ channel complexes. Proc. Natl. Acad. Sci. USA. 2008;105:1478–1482. doi: 10.1073/pnas.0710366105. [DOI] [PMC free article] [PubMed] [Google Scholar]
- 6.Wang Q., Curran M.E., Splawski I., Burn T.C., Millholland J.M. Positional cloning of a novel potassium channel gene: KVLQT1 mutations cause cardiac arrhythmias. Nat. Genet. 1996;12:17–23. doi: 10.1038/ng0196-17. [DOI] [PubMed] [Google Scholar]
- 7.Schwartz P.J., Priori S.G., Spazzolini C., Moss A.J., Vincent G.M. Genotype-phenotype correlation in the long-QT syndrome: gene-specific triggers for life-threatening arrhythmias. Circulation. 2001;103:89–95. doi: 10.1161/01.cir.103.1.89. [DOI] [PubMed] [Google Scholar]
- 8.Rocchetti M., Freli V., Perego V., Altomare C., Mostacciuolo G. Rate dependency of β-adrenergic modulation of repolarizing currents in the guinea-pig ventricle. J. Physiol. 2006;574:183–193. doi: 10.1113/jphysiol.2006.105015. [DOI] [PMC free article] [PubMed] [Google Scholar]
- 9.Rocchetti M., Besana A., Gurrola G.B., Possani L.D., Zaza A. Rate dependency of delayed rectifier currents during the guinea-pig ventricular action potential. J. Physiol. 2001;534:721–732. doi: 10.1111/j.1469-7793.2001.00721.x. [DOI] [PMC free article] [PubMed] [Google Scholar]
- 10.Silva J., Rudy Y. Subunit interaction determines IKs participation in cardiac repolarization and repolarization reserve. Circulation. 2005;112:1384–1391. doi: 10.1161/CIRCULATIONAHA.105.543306. [DOI] [PMC free article] [PubMed] [Google Scholar]
- 11.Tzounopoulos T., Maylie J., Adelman J.P. Gating of I(sK) channels expressed in Xenopus oocytes. Biophys. J. 1998;74:2299–2305. doi: 10.1016/S0006-3495(98)77939-1. [DOI] [PMC free article] [PubMed] [Google Scholar]
- 12.Imredy J.P., Penniman J.R., Dech S.J., Irving W.D., Salata J.J. Modeling of the adrenergic response of the human IKs current (hKCNQ1/hKCNE1) stably expressed in HEK-293 cells. Am. J. Physiol. Heart Circ. Physiol. 2008;295:H1867–H1881. doi: 10.1152/ajpheart.433.2008. [DOI] [PubMed] [Google Scholar]
- 13.Terrenoire C., Clancy C.E., Cormier J.W., Sampson K.J., Kass R.S. Autonomic control of cardiac action potentials: role of potassium channel kinetics in response to sympathetic stimulation. Circ. Res. 2005;96:e25–e34. doi: 10.1161/01.RES.0000160555.58046.9a. [DOI] [PubMed] [Google Scholar]
- 14.Brette F., Leroy J., Le Guennec J.Y., Salle L. Ca2+ currents in cardiac myocytes: old story, new insights. Prog. Biophys. Mol. Biol. 2006;91:1–82. doi: 10.1016/j.pbiomolbio.2005.01.001. [DOI] [PubMed] [Google Scholar]
- 15.Faber G.M., Rudy Y. Action potential and contractility changes in [Na(+)](i) overloaded cardiac myocytes: a simulation study. Biophys. J. 2000;78:2392–2404. doi: 10.1016/S0006-3495(00)76783-X. [DOI] [PMC free article] [PubMed] [Google Scholar]
- 16.Aizawa Y., Ueda K., Scornik F., Cordeiro J.M., Wu Y. A novel mutation in KCNQ1 associated with a potent dominant negative effect as the basis for the LQT1 form of the long QT syndrome. J. Cardiovasc. Electrophysiol. 2007;18:972–977. doi: 10.1111/j.1540-8167.2007.00889.x. [DOI] [PMC free article] [PubMed] [Google Scholar]
- 17.Walsh K.B., Kass R.S. Distinct voltage-dependent regulation of a heart-delayed IK by protein kinases A and C. Am. J. Physiol. Cell Physiol. 1991;261:C1081–C1090. doi: 10.1152/ajpcell.1991.261.6.C1081. [DOI] [PubMed] [Google Scholar]
- 18.Bosch R.F., Gaspo R., Busch A.E., Lang H.J., Li G.R. Effects of the chromanol 293B, a selective blocker of the slow component of the delayed rectifier K+ current, on repolarization in human and guinea pig ventricular myocytes. Cardiovasc. Res. 1998;38:441–450. doi: 10.1016/s0008-6363(98)00021-2. [DOI] [PubMed] [Google Scholar]
- 19.Dilly K.W., Kurokawa J., Terrenoire C., Reiken S., Lederer W.J. Overexpression of β2-adrenergic receptors cAMP-dependent protein kinase phosphorylates and modulates slow delayed rectifier potassium channels expressed in murine heart: evidence for receptor/channel co-localization. J. Biol. Chem. 2004;279:40778–40787. doi: 10.1074/jbc.M406010200. [DOI] [PubMed] [Google Scholar]
- 20.Chouabe C., Drici M.D., Romey G., Barhanin J., Lazdunski M. HERG and KvLQT1/IsK, the cardiac K+ channels involved in long QT syndromes, are targets for calcium channel blockers. Mol. Pharmacol. 1998;54:695–703. [PubMed] [Google Scholar]
- 21.Lu Z., Kamiya K., Opthof T., Yasui K., Kodama I. Density and kinetics of IKr and IKs in guinea pig and rabbit ventricular myocytes explain different efficacy of IKs blockade at high heart rate in guinea pig and rabbit: implications for arrhythmogenesis in humans. Circulation. 2001;104:951–956. doi: 10.1161/hc3401.093151. [DOI] [PubMed] [Google Scholar]
- 22.Saucerman J.J., Healy S.N., Belik M.E., Puglisi J.L., McCulloch A.D. Proarrhythmic consequences of a KCNQ1 AKAP-binding domain mutation: computational models of whole cells and heterogeneous tissue. Circ. Res. 2004;95:1216–1224. doi: 10.1161/01.RES.0000150055.06226.4e. [DOI] [PubMed] [Google Scholar]
- 23.Silverman W.R., Roux B.T., Papazian D.M. Structural basis of two-stage voltage-dependent activation in K+ hchannels. Proceedings of the National Academy of Sciences of the United States of America. 2003;100:2935–2940. doi: 10.1073/pnas.0636603100. [DOI] [PMC free article] [PubMed] [Google Scholar]
- 24.Moreno A.P., Saez J.C., Fishman G.I., Spray D.C. Human connexin43 gap junction channels. Regulation of unitary conductances by phosphorylation. Circ. Res. 1994;74:1050–1057. doi: 10.1161/01.res.74.6.1050. [DOI] [PubMed] [Google Scholar]
- 25.Derkach V., Barria A., Soderling T.R. Ca2+/calmodulin-kinase II enhances channel conductance of alpha-amino-3-hydroxy-5-methyl-4-isoxazolepropionate type glutamate receptors. Proc. Natl. Acad. Sci. USA. 1999;96:3269–3274. doi: 10.1073/pnas.96.6.3269. [DOI] [PMC free article] [PubMed] [Google Scholar]
- 26.Carter S., Colyer J., Sitsapesan R. Maximum phosphorylation of the cardiac ryanodine receptor at serine-2809 by protein kinase A produces unique modifications to channel gating and conductance not observed at lower levels of phosphorylation. Circ. Res. 2006;98:1506–1513. doi: 10.1161/01.RES.0000227506.43292.df. [DOI] [PubMed] [Google Scholar]
- 27.Seebohm G., Strutz-Seebohm N., Birkin R., Dell G., Bucci C. Regulation of endocytic recycling of KCNQ1/KCNE1 potassium channels. Circ. Res. 2007;100:686–692. doi: 10.1161/01.RES.0000260250.83824.8f. [DOI] [PubMed] [Google Scholar]
- 28.Varro A., Balati B., Iost N., Takacs J., Virag L. The role of the delayed rectifier component IKs in dog ventricular muscle and Purkinje fibre repolarization. J. Physiol. 2000;523:67–81. doi: 10.1111/j.1469-7793.2000.00067.x. [DOI] [PMC free article] [PubMed] [Google Scholar]
- 29.Iost N., Virag L., Opincariu M., Szecsi J., Varro A. Delayed rectifier potassium current in undiseased human ventricular myocytes. Cardiovasc. Res. 1998;40:508–515. doi: 10.1016/s0008-6363(98)00204-1. [DOI] [PubMed] [Google Scholar]
Associated Data
This section collects any data citations, data availability statements, or supplementary materials included in this article.