

Abstract
Transient conformational changes of DNA-protein complexes play an important role in the DNA metabolism but are generally difficult to resolve. Single molecule force spectroscopy has the unique capability to follow such reactions but Brownian fluctuations in the end-to-end distance of a DNA tether can obscure these events. Here we measured the force-induced unwrapping of DNA from a single nucleosome and show that hidden Markov analysis, adopted for the nonlinear force-extension of DNA, can readily resolve unwrapping events that are significantly smaller than the Brownian fluctuations. The resulting probability distributions of the tether length are used to accurately resolve small changes in contour length and persistence length. The latter is shown to be directly related to the DNA bending angle of the complex. The wormlike chain-adapted hidden Markov analysis can be used for any transient DNA-protein complex and provides a robust method for the investigation of these transient events.
Introduction
Protein-DNA complexes are transient by nature and to understand the reaction mechanisms that control DNA metabolism it is important to relate the kinetics of complex formation to the conformational changes that are associated with DNA binding. In many cases, the binding of a protein induces a bend in the trajectory of the DNA, as can be observed by various techniques such as gel electrophoresis, atomic force microscopy, electron microscopy, nuclear magnetic resonance, and x-ray crystallography. However, all these techniques require stable complexes or depend on fixation, and cannot be used to resolve the structure nor the dynamics of short-lived complexes. Single molecule techniques are well equipped for this task, but the Brownian fluctuations associated with these experiments and which are intrinsic to the flexibility of the complexes sometimes dominate over structural changes. Here we use the well-known mechanical properties of DNA to resolve dynamic binding events that change the contour length and the trajectory of the DNA-protein complex to obtain both the kinetics of protein binding and the bending angle of such transient complexes.
In eukaryotes, nucleosomes are by far the most abundant DNA-protein complexes and many processes involving DNA are regulated by their presence. The nucleosome represents the fundamental organizational unit of chromatin. Its structure is known with atomic detail: 147 basepairs of DNA are wrapped in 1.65 turns around a histone octamer (1). The nucleosome core particle is, however, not a static structure. Spontaneous nucleosome conformational changes have been reported where a stretch of DNA transiently unwraps from the histone surface (2), which allows enzymes access to the DNA that is usually occluded in the nucleosome. Various techniques have been used to study these dynamics, including fluorescence resonant energy transfer (FRET) (2,3) and force spectroscopy (4,5). The latter was successfully applied to quantify force-induced structural changes of the nucleosome and to determine the corresponding rates of DNA unwrapping from the histone octamer as a function of the force (4).
During force-spectroscopy experiments, the extension of a DNA molecule containing a single nucleosome (Fig. 1 a) is measured. In absence of force, the lifetime of the unwrapped conformation is much shorter than the lifetime of the wrapped conformation (4) and transient unwrapping events may be too fast, compared to the bandwidth of the tweezers, to be observed. By applying a constant force, the equilibrium shifts and the lifetime of the unwrapped conformation increases while the lifetime of the wrapped conformation decreases (6). Force-induced DNA unwrapping can be separated in two steps. At an external force of ∼3 pN, the first 0.65 turns of DNA unwrap from the histone core (Fig. 1, a and b) (4). At this force, the lifetimes of the wrapped and the unwrapped conformations are similar, allowing direct quantification of these lifetimes (4). The lifetimes at zero force can be extrapolated from the force-versus-lifetime characteristic (6). At a stretching force of 6 pN, the final turn of DNA unwraps (Fig. 1, b and c) (4,5). Thus, during force-induced unwrapping, two transitions between the three distinct conformations (i.e., fully wrapped; 0.65 turns unwrapped; and fully unwrapped) can be identified.
Figure 1.
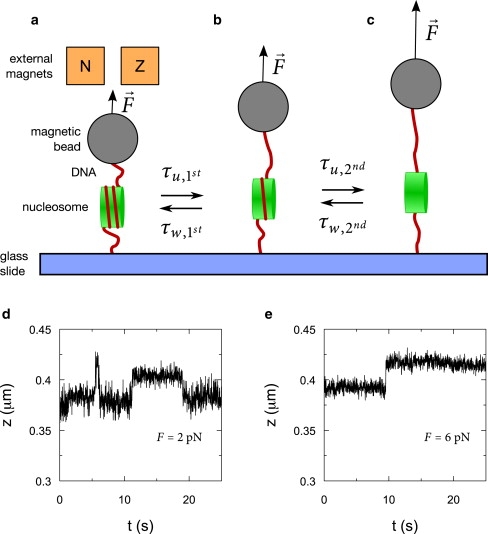
Schematic representation of a magnetic tweezers experiment on a DNA-nucleosome complex. (a) A DNA molecule containing a single nucleosome is attached between a magnetic bead and a glass coverslip. The force is controlled by changing the distance between the bead and two external magnets above the sample. DNA unwrapping from the nucleosome under force occurs in two distinct steps (a to b, then b to c). Two typical examples of experimental DNA unwrapping traces at 2 pN (d) and at 6 pN (e), where unwrapping is accompanied by an increase in end-to-end distance of the DNA-nucleosome complex.
The existence of these distinct conformations allows us to describe the wrapping and unwrapping of DNA from the nucleosome as a Markov process by separating the reaction path into three conformations with accompanying transition rates between them. A schematic representation for nucleosome unwrapping, as a Markov process, is depicted in Fig. 1. During each transition DNA wraps or unwraps, leading to steplike increases or decreases in tether length, as observed in the extension of the molecule (Fig. 1, d and e). In such force-spectroscopy experiments, the challenge is to resolve small changes in end-to-end distance, in this case of ∼25 nm, under conditions where thermal fluctuations of the extension of the DNA tether may exceed these changes. Quantification of the changes in the contour length of the DNA molecule therefore requires a Hidden Markov (HM) model, which explicitly takes stochastic fluctuations of the observable into account (7,8). HM analysis of noisy traces has successfully been applied to various experimental data such as FRET trajectories (9) and DNA looping kinetics (10), assuming the noise to be normally distributed. It is, however, essential to use correct probability distributions of the different states and in the case of force spectroscopy on DNA, the probability distribution differs significantly from a normal distribution. In this article, we calculate the probability distribution of the DNA end-to-end length under an external force and use this distribution in the HM analysis. This approach strongly improves the accuracy of detecting steps in constant-force time traces of the DNA extension, resulting in a more accurate determination of the kinetics. Furthermore, we will show that the HM model also gives new insight into the mechanical and structural properties of the nucleosome.
Methods
Magnetic tweezers
DNA-tethered superparamagnetic beads were imaged in a flow cell on a home-built inverted microscope with a charge-coupled device camera (model No. TM-6710CL, Pulnix America, Sunnyvale, CA) at 60 frames per second. The magnet position was controlled by a stepper motor-based translation stage (model No. M-126, Physik Instrumente, Karlsruhe/Palmbach, Germany) with an accuracy of 200 nm. The position of the beads was measured by real-time image processing using LabView software (National Instruments, Washington, DC) with an accuracy of 4 nm (11).
Due to the transient nature of the observed conformations, the height of the bead does not remain constant during an experiment; therefore, the force cannot be calculated accurately from equipartition (12). Instead, the force was calculated from the position of the external magnets and a previous calibration measurement as described elsewhere (11).
Preparation of the DNA construct
A PCR was performed on a modified pGem3Z plasmid with a 601-nucleosome positioning site introduced at 94 basepairs. The reverse primer (5′-AAACC ACCCG GGTGG GCTCA CTCAT TAGGC ACCCC-3′) was modified with a single digoxigenin at the 5′ end. The forward primer (5′-CCCCA TGTTG TGCAA AAAAG CGG-3′) was modified with a biotin on the 5′ end.
Mononucleosome preparation
Five micrograms of the PCR product described above was mixed with nucleosomes purified from chicken blood in a 1:10 molar ratio and diluted to a total volume of 40 μL in TE buffer (10 mM Tris-HCl at pH 8.0, and 1 mM EDTA) and NaCl (2 M). Next, a salt dialysis was performed as described elsewhere (13). The final product was dissolved in TE. The reconstitution was analyzed by native polyacrylamide gel electrophoresis and atomic force microscopy (Supporting Material Fig. S1). Only bare DNA and mononucleosomes on the 601 position were observed.
Flow cell preparation
A clean glass coverslip was spincoated with a thin layer of a 1% polystyrene toluene solution. The coverslip was subsequently mounted on a polydimethylsiloxane flow cell containing a 10 × 4 × 0.4 mm flow channel. The flow cell interior was flushed with 10 mM HEPES (pH 7.6). Next, 0.1 mg/mL anti-digoxigenin (Roche, Welwyn Garden City, Hertsfordshire, UK) was introduced into the flow cell and incubated for 60 min at room temperature, followed by 10 min of incubation with blocking buffer: 10 mM HEPES (pH 7.6), 0.2% (w/v) BSA, and 0.1% (v/v) Tween-20. Subsequently 8 μL of measurement buffer (MB) 10 mM HEPES (pH 7.6), 0.02% (w/v) BSA, 2 mM magnesium acetate, 10 mM NaN3, and 0.1% (v/v) Tween-20 was incubated with 1 μL of 2.8 μm superparamagnetic biotinylated Dynabeads (Invitrogen, Carlsbad, CA) and 1 μL of 10 ng/μL mononucleosomes for 15 min at room temperature, to allow binding between the bead-DNA and the surface. The mixture was diluted in 400 μL MB and incubated in the flow cell for 10 min. Finally, the cell was flushed with MB.
Results
The probability distribution of the end-to-end distance of a DNA-bead system
A number of algorithms have been published to find the most likely distribution of Markov states (7,14,15). We used the forward-backward algorithm (7). The forward-backward algorithm uses the probability distribution of the various states to calculate the probability for data point n to be in each state. Data point n is then attributed to the state with the highest probability. For the first iteration an estimate of the transition probabilities and probability distributions is needed, which is typically based on simple thresholding. A new probability distribution for each state is then fitted to a histogram of the data belonging to the corresponding state. From the dwell times of the different states, new lifetimes are calculated. In subsequent iterations, each data point is reassigned to a new state. Successive iterations are performed until the lifetimes and probability densities converge to a stable solution.
In many applications, a normal distribution is used to describe the probability distribution of a state (9,10). Due to the nonlinear force-distance relation of DNA (Eq. 4), the end-to-end distance of a DNA molecule under constant force deviates significantly from a normal distribution. The probability distribution, P(z), of the end-to-end distance, z, under force can be calculated from the work required to stretch the molecule, E(z), relative to the thermal energy kBT:
| (1) |
E(z) is obtained by integration of the force required to extend the DNA molecule, given by
| (2) |
In a typical tweezers-based force-spectroscopy experiment, the total force acting on the bead is
| (3) |
with Fext the external force applied to the bead, either from magnetic or optical trapping. The quantity FEV(z) is the exclude-volume force and equals kBT/z (16). The quantity FWLC is the force required to stretch the DNA molecule as given by the worm-like-chain (WLC) model (17) with a persistence length p and a contour length L:
| (4) |
The work needed to stretch the DNA molecule follows from Eqs. 2–4, yielding
| (5) |
Using Eqs. 1 and 5, the normalized probability distribution, P(z), becomes
| (6) |
In cases where the number of states is not known a priori, it is possible to extend the analysis with a second iteration fitting an increasing number of states as described by McKinney et al. (9). In this study of DNA unwrapping from nucleosome cores, however, we limited our analysis to three states corresponding to three probability distributions.
Brownian dynamics simulations
Thermal fluctuations of the extension of the DNA tether can be significant and may even exceed the changes in extension associated with DNA unwrapping. To test the accuracy of the above HM model, we performed Brownian dynamics simulations of time traces of DNA molecules at constant force, exhibiting fluctuations between two different states representing wrapping and unwrapping of DNA from the nucleosome. The step size, Δs, at given force, F, is defined as the difference between the end-to-end distance of the two states
| (7) |
with pn and Ln the persistence and contour length of the DNA containing a single nucleosome, in state n, which not only has a different contour length but my also have a different persistence length. The quantity zWLC is the inverse of Eq. 4. Two example time traces with a different ratio between the step size and the thermal fluctuations are depicted in Fig. 2 a. The green line shows the input fluctuations between the two states. The black line shows the simulated Brownian motion of a bead attached to a DNA molecule following the variations in the green trace. We fitted the simulated time trace by HM using the WLC probability distribution (red line) and a normal distribution (blue line). The analysis was performed at 1 pN and at 0.7 pN. In the latter case, thermal fluctuations are significantly larger than the step size. The fit of the time trace that corresponds to 0.7 pN demonstrates that even small changes in end-to-end distance, which cannot be detected by simple thresholding, are readily resolved by HM analysis using a WLC distribution, but are largely overlooked when using a normal distribution.
Figure 2.
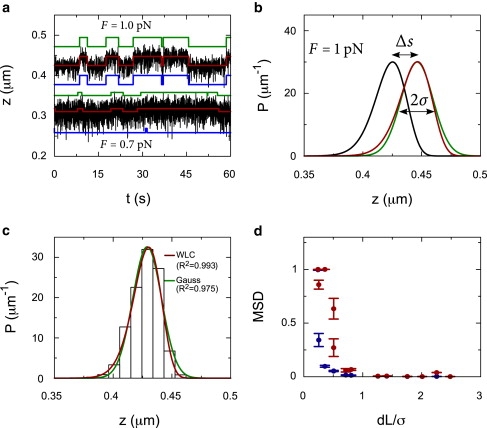
Hidden Markov fits to Brownian dynamics simulations of a DNA molecule in which transitions occur between two contour lengths. (a) Traces of simulated data (black lines), the HM fit with the WLC model (red lines), and a Gaussian model (blue lines), and the actual steps (green lines). The top trace is simulated at 1 pN for a DNA molecule, with a contour length of 500 nm, a persistence length of 52 nm, and a step of 25 nm. The bottom trace is simulated at 0.7 pN for a similar molecule, but with a step of 10 nm. (b) The WLC probability distributions for a DNA molecule at 1 pN, with a contour length of 500 nm (black line) and a contour length of 525 nm (red line). The step-size, Δs, represents the difference in end-to-end distance between the distributions. Although the width of the WLC distribution is very similar to the width of a normal distribution σ (green line), the tails of the distributions differ significantly. (c) A simulated time trace, with a constant contour length, is binned and shown as a histogram. This histogram is fit with the WLC probability distribution at 1 pN and compared to a normal distribution. The WLC distribution describes the data much better as expressed in the R2. (d) The MSD of the fits using a WLC probability distribution (blue circles) is compared to the MSD using a normal distribution (red circles) for different ratios between the step-size and the thermal fluctuations. The error bars represent the spread in the MSD for 10 different traces.
As a figure of merit for the relative size of the end-to-end distance changes, we use the ratio between the step size and the width of the thermal fluctuation distribution. The standard deviation of the thermal fluctuations in the DNA extension σ (Fig. 2 b) follows
| (8) |
where kWLC is the stiffness of the DNA molecule at a given stretching force. Using Eq. 4, this expression can be rewritten as
| (9) |
The mean-squared difference (MSD) of the WLC probability distribution (Eq. 6) can now be compared to the MSD of a Gaussian approximation of the probability distribution PG(z), defined as
| (10) |
An example of a histogram of a single simulated state is shown in Fig. 2 c, where both a Gaussian probability distribution and a WLC probability distribution are fitted. The R2 of the WLC distribution is smaller than the Gaussian distribution, indicating that the WLC describes the simulated data better. To quantify the robustness of our method, we calculate the normalized MSD between the input time trace of the tether length and the fitted time trace of the tether length. Fig. 2 d shows that HM analysis using the WLC probability distribution, calculated from Eq 6, yields a much better fit than using a normal distribution when Δs/σ becomes s < 1. The normalized MSD is <0.1 even for a Δs/σ of 0.25, in which case it is clear that the HM analysis using a normal distribution is unable to detect any steps. Overall, the WLC distribution detects the steps more accurately, and thus, yields a better fit.
Since the probability distribution of the end-to-end distance depends on the persistence length and contour length of the tether, the HM analysis not only allows detection of steps, but also can directly extract values for the persistence length and contour length from experimental, constant force, time traces. Fig. 3 shows the relative error in the fitted persistence length, contour length, and lifetime of the different states. The relative error in the fitted persistence length is, on average, >5% (Fig. 3 a). Surprisingly, the accuracy of the detected persistence length does not depend on the ratio between the step size and the thermal fluctuations. The relative errors in the fitted contour length and lifetimes (Fig. 3, b and c) do depend on the step-noise ratio, but are <0.2 for step size >0.5 times the thermal fluctuations. Thus, the HM analysis can be used not only to extract the lifetimes of the different states, but also to obtain accurate measures of the mechanical properties of transient structures that have only small differences in extension relative to the thermal fluctuations.
Figure 3.
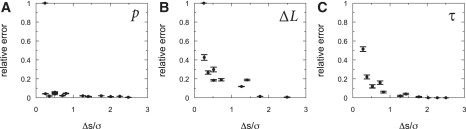
The relative errors between the HM fit and the input of the persistence length (a), step-size (b), and lifetime (c), using a WLC distribution, with respect to the ratio between step-size and thermal fluctuations. The error bars represent the spread in the relative error for 10 different traces.
Analysis of mononucleosome unwrapping under force
Having established the potential to measure small excursions in the end-to-end distance of DNA molecules, we analyzed the unwrapping of the first turn of DNA from single nucleosomes as observed by constant force measurements, using the HM analysis. An example time trace of the end-to-end distance of single nucleosomes, in a 500-nm DNA tether measured using magnetic tweezers, is shown in Fig. 4 a. In this time trace, measured at a constant stretching force of 2.5 pN, we observed two distinct levels that we attribute to the fully wrapped and first-turn unwrapped conformation.
Figure 4.
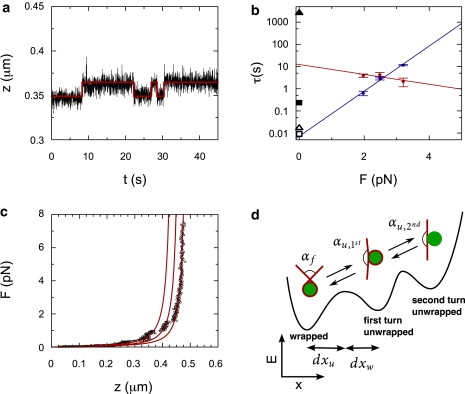
(a) Hidden Markov fit (red) to experimental data of nucleosome unwrapping at a force of 2.5 pN. (b) The obtained lifetimes of the unwrapped conformation (blue) and the wrapped conformation (red) of the first turn at different forces. The exponential fits are extrapolated to zero force. The black points are wrapped and unwrapped lifetimes measured using FRET (2) (closed and open square) and using optical tweezers (4) (closed and open triangle). (c) Force-extension plot of a mononucleosome on a 500-nm DNA fragment showing unwrapping events (red dots). The solid black lines are WLC with a contour length and persistence length taken from the HM analysis for the three different conformations. (d) Schematic overview of the exit angle of a fully wrapped, αf, first turn unwrapped, αu, 1st, and second turn unwrapped, αu, 2nd, nucleosome. The energy landscape (black line) shows the distances in reaction coordinates between the energy barrier and the wrapped and unwrapped conformation. The opening angles are as determined from the HM-WLC analysis.
Within the time of our experiments, we did not observe irreversible unfolding of DNA from the nucleosome core that could be due to dissociation of histone dimers, as reported in Claudet et al. (18). Although the details of the experimental conditions are difficult to compare, at least two factors favor nucleosome stability in our experiments. Firstly, the 601-nucleosome positioning element that we used here has a significantly (3 kBT) higher stability than the natural 5S RNA and genomic chicken DNA templates (19) that were used in their study. Secondly, we carefully limited the force on our mononucleosomes to maximally 6 pN, whereas Claudet et al. (18) report forces up to several tens of pNs. After each experiment of typically 60 s, the force was directly reduced to the sub-pN level. Because all length increases of the mononucleosome tether were reversible, we can exclude nucleosome dissociation to be associated with the length increases that we report here.
The average length of DNA that unwraps from the nucleosome (dL), derived from the difference in contour length between the two conformations, was 21.3 ± 0.5 nm (N = 12) in good agreement with previous data (4). The lifetimes of the wrapped (τw) and unwrapped (τu) conformation have been reported to depend exponentially on the applied force (6)
| (11) |
where τ0, w and τ0, u are the lifetimes at zero force, and dxw (and dxu) is the distance of the reaction coordinate between the initial state and the transition state (Fig. 4 a). These distances determine the effect of the force on the lifetimes and are limited by the total unwrapping length, dxu + dxw ≤ dL. The lifetimes of the unwrapped conformation and the wrapped conformation, obtained from our HM analysis, were fitted with Eq. 11 (Fig. 4 b), resulting in a lifetime of the unwrapped conformation at zero force of 0.007 ± 0.001 s and a lifetime of the wrapped conformation at zero force of 12 ± 5 s. The corresponding distance in reaction coordinates to the transition state was 10 ± 1.4 nm and 2 ± 1.3 nm, respectively.
Now that we have calculated the lifetimes of the unwrapped conformations and the wrapped conformation of the nucleosome, how do they compare to previous studies? Mihardja et al. (4) performed similar force-spectroscopy experiments using optical tweezers, and also extrapolated the lifetimes of the of the unwrapped conformations and the wrapped conformation of the nucleosome at zero force from measurements at different forces. Li et al. (2) measured the zero-force lifetimes of nucleosome breathing directly using bulk FRET, which were later confirmed by single pair FRET (3). The results of these studies are also plotted in Fig. 4 b and show that the lifetime for the unwrapped conformation we find (0.007 ± 0.001 s) is in good agreement with the lifetimes obtained using FRET (0.01 s) and optical tweezers (0.0172 s). The lifetime of the wrapped conformation, however, varies significantly between the three studies. Li et al. reports a lifetime of the wrapped conformation of 0.25 s. The lifetime we find however, is much higher. In the FRET experiments, any small amount of DNA unwrapping is detected as an unwrapping event. In contrast, in force spectroscopy, only unwrapping of a full turn is detected as an unwrapping event. The small excursions that are readily observed in FRET are likely to occur more frequently than full turn unwrapping, which would explain the longer lifetime we observe for the fully wrapped conformation. A major complication in comparing these results, however, is the difference in posttranslational modifications that may be present and that are functional in epigenetic regulation of transcription. Li et al. (2) and Koopmans et al. (3) used recombinant histones that lack such modifications, whereas in our study and in that of Mihardja et al. (4), histones were used that were obtained from chicken erythrocytes that have been prone to such modifications. It is likely that the modifications effect the lifetimes of both the fully wrapped and the unwrapped state. As in chicken erythrocytes, chromatin is programmed to be in a transcriptionally silent state, the equilibrium may be shifted toward the wrapped state, which would be consistent with this conformation's longer lifetime. Another important parameter in nucleosome folding is the presence of Mg2+. The difference in concentration of Mg2+ between the experiments of Mihardja et al. (10 mM) and our experiments (2 mM) may explain this difference in the observed wrapped lifetime, since it is known that Mg2+ ions stabilize the nucleosome fiber structure (20). However, we are not aware of systematic studies on mononucleosome stability as a function of [Mg2+]. Because the concentration of Mg2+ in vivo is expected to be 2 mM (21), we argue that our experiments may more closely match these conditions.
The high force transition, corresponding to unwrapping of the second turn of DNA, was irreversible. Like Mihardja et al. (4), we only observed a single unwrapping event per force trace, indicating a free energy barrier for refolding that is >>kBT. Only from the rate dependence of the rupture force, or from experiments at high salt conditions, was it concluded that this transition does not follow a simple two-state model. We also could not resolve this in our constant force measurements, which feature a single step transition, see Fig. 1 e. As shown in the next paragraph, the distributions of the end-to-end distance in the both states accurately follow the expected distribution, and thus, do not give an indication for intermediate states; this validates a three-state HM analysis. Summarizing, the above illustrates that our HM analysis readily confirms the lifetime of the unwrapped conformation, but finds a lifetime of the wrapped conformation, which is in-between previously, reported values.
Structural implications
Is it possible to use our HM analysis to extract structural properties of the DNA-nucleosome complex during the different conformations? In particular, it would be informative to extract the bending angle of the transient complex. Protein-induced bending has been reported to decrease the apparent persistence length of a DNA molecule significantly. Yan and Marko (22) showed that the force-extension behavior for a 90° bend in a DNA molecule can be described by a WLC with a reduced persistence length. Experimental results confirm such a relation between DNA-bend angles and the apparent persistence length. For instance, force-extension experiments on HU and IHF proteins, which are known to induce a stable bend in the trajectory of a DNA molecule, yield a WLC with a decreased apparent persistence length (23,24). Using Euler mechanics, Kulić et al. (25) showed that the angle α, of a kink or fixed angle loop in the trajectory of a DNA molecule, reduces the apparent persistence length papp,
| (12) |
A renormalization of the persistence length can also be expected for a DNA molecule that contains a nucleosome since wrapping of 1.65 turns of DNA around the nucleosome induces a loop in the DNA trajectory (Fig. 4 d), as exemplified by the crystal structure (1). When DNA unwraps from the nucleosome, not only the contour length changes but also the opening angle of the DNA, and hence the apparent persistence length.
In force spectroscopy, the persistence length of a molecule is generally extracted from its force-extension behavior by fitting Eq. 4 (17). When pulling on a mononucleosome, the two transient conformations result in abrupt changes clearly distinguishable by the stepwise increase in tether length. An example trace of a force-extension curve of a 500-nm-long DNA molecule containing a single nucleosome is shown in Fig. 4 c. Two distinct steps represent the transitions between the wrapped and the unwrapped conformation. The limited force range in which each conformation is stable severely impedes accurate fitting, resulting in a contour length of 430 ± 20 nm, 510 ± 120 nm, and 500 ± 20 nm, respectively. The corresponding persistence length of the three different conformations was 34 ± 8 nm, 17 ± 20 nm, and 20 ± 11 nm. The inaccurate fitting, due to the limited force range in which the conformation is stable, is prominent for the 0.65-turns unwrapped conformation, where very limited data is available and the WLC fit cannot distinguish between this conformation and the conformation of a fully unwrapped nucleosome. Furthermore, the values for both the contour length and the persistence length deviate from the values that can be expected based on the length of the DNA and the structure of the (partially unwrapped) nucleosome. Therefore, force-extension curves are of limited use for fitting structural parameters from transient complexes.
Using the HM analysis on constant force time traces, the changes in persistence length can directly be extracted from the probability distribution of each conformation. The persistence length before unwrapping was 45 ± 5 nm (N = 12), whereas, after unwrapping of 0.65 turns of DNA, the persistence length became 50 ± 6 nm (N = 12). The same conformation was probed independently in time traces that featured the second transition to the fully unwrapped conformation. In this case, the persistence length before unwrapping of the final turn was 51 ± 0.9 nm (N = 5), in excellent agreement with the previous measurement and changed after unwrapping of the final turn to 52 ± 0.7 nm (N = 5). Note that the accuracy is far better than the results obtained by fitting the force-extension data.
Using Eq. 12 to calculate the exit angle for each conformation results in 81 ± 40° for the wrapped conformation, 130 ± 70° and 144 ± 16° after unwrapping of 0.65 turns, and 180 ± 10° for the fully unwrapped conformation. The relatively large uncertainties in the obtained opening angle are caused by the steep dependence of the opening angle on the apparent persistence length. Based on the crystal structure (1) of the nucleosome, the exit angle of the fully wrapped (1.65 turns of DNA) conformation is |180° − 0.65 × 360°| = 54°. After unwrapping of 21 nm of DNA from the histone core (the length of DNA that we obtained directly from the HM analysis), 0.95 turns remain, corresponding to an exit angle of |180° − 0.95 × 360°| = 162°. When the second turn is also unwrapped, the trajectory of the DNA is likely not affected by the nucleosome, resulting in an exit angle of 180°. These values agree well with the values of the exit angle obtained from the HM analysis. Thus, the probability distributions that can be obtained by HM analysis can be used to measure the exit angle of the DNA from constant force time traces of nucleosome (un)wrapping.
Conclusion
By integrating the mechanical properties of DNA into probability distributions of a HM model, we developed an accurate method for quantification of DNA force spectroscopy data. The described HM model, which uses the force-extension relation described by a WLC, fits the data with a high accuracy even when thermal fluctuations exceed the step size of a conformational change. Using a normal probability distribution, HM analysis fails to resolve steps smaller than the thermal fluctuations. Detailed information about the first- and second-turn nucleosome unwrapping, e.g., lifetimes, step sizes, persistence lengths, and DNA trajectory bending angles, were extracted from constant force time traces. For the first time, we were able to determine the bending angles of nucleosomal DNA in solution and resolved conformations that were fully wrapped, partially unwrapped, and fully unwrapped. The HM analysis allowed extrapolation to zero-force lifetimes from constant force time traces. To probe the bending angles of a DNA trajectory of transient conformations, such as DNA unwrapping from a nucleosome, using electron or atomic force microscopy or crystal data is not straightforward, if possible at all, because the nucleosomes need to be trapped in the unwrapped conformation. As no force is applied in these type of experiments, most nucleosomes are trapped in the wrapped conformation.
The method is not restricted to analysis of DNA dynamics in nucleosomes, in which the histone octamer remains bound to the DNA. In addition, association and dissociation of DNA binding proteins, like, for example, repressor proteins (10), protein DNA chimeras (26), or the unfolding of RNA pseudoknots (27), are associated with changes in contour length and bending angle. Accurate assessment of the kinetics of such reactions will need to take the nonlinear extension of DNA into account and the current adapted HM analysis will be equally profitable in these studies.
Acknowledgments
We thank T. van der Heijden, S. Semrau, F. Chien, M. de Jager, and A. Routh for providing materials and for the helpful discussions.
This work was financially supported by the Nederlandse Organisatie voor Wetenschappelijk Onderzoek (NWO).
Supporting Material
References
- 1.Luger K., Mäder A.W., Richmond R.K., Sargent D.F., Richmond T.J. Crystal structure of the nucleosome core particle at 2.8 Å resolution. Nature. 1997;389:251–260. doi: 10.1038/38444. [DOI] [PubMed] [Google Scholar]
- 2.Li G., Levitus M., Bustamante C., Widom J. Rapid spontaneous accessibility of nucleosomal DNA. Nat. Struct. Mol. Biol. 2004;12:46–53. doi: 10.1038/nsmb869. [DOI] [PubMed] [Google Scholar]
- 3.Koopmans W.J.A., Schmidt T., van Noort J. Nucleosome immobilization strategies for single-pair FRET microscopy. ChemPhysChem. 2008;9:2002–2009. doi: 10.1002/cphc.200800370. [DOI] [PubMed] [Google Scholar]
- 4.Mihardja S., Spakowitz A., Zhang Y., Bustamante C. Effect of force on mononucleosomal dynamics. Proc. Natl. Acad. Sci. USA. 2006;103:15871–15876. doi: 10.1073/pnas.0607526103. [DOI] [PMC free article] [PubMed] [Google Scholar]
- 5.Brower-Toland B.D., Smith C.L., Yeh R.C., Lis J.T., Peterson C.L. Mechanical disruption of individual nucleosomes reveals a reversible multistage release of DNA. Proc. Natl. Acad. Sci. USA. 2002;99:1960–1965. doi: 10.1073/pnas.022638399. [DOI] [PMC free article] [PubMed] [Google Scholar]
- 6.Evans E.A., Ritchie K. Dynamic strength of molecular adhesion bonds. Biophys. J. 1997;72:1541–1555. doi: 10.1016/S0006-3495(97)78802-7. [DOI] [PMC free article] [PubMed] [Google Scholar]
- 7.Rabiner L. A tutorial on hidden Markov-models and selected applications in speech recognition. Proc. IEEE. 1989;77:257–286. [Google Scholar]
- 8.Eddy S.R. What is a hidden Markov model? Nat. Biotechnol. 2004;22:1315–1316. doi: 10.1038/nbt1004-1315. [DOI] [PubMed] [Google Scholar]
- 9.McKinney S.A., Joo C., Ha T. Analysis of single-molecule FRET trajectories using hidden Markov modeling. Biophys. J. 2006;91:1941–1951. doi: 10.1529/biophysj.106.082487. [DOI] [PMC free article] [PubMed] [Google Scholar]
- 10.Beausang J.F., Zurla C., Manzo C., Dunlap D., Finzi L. DNA looping kinetics analyzed using diffusive hidden Markov model. Biophys. J. 2007;92:L64–L66. doi: 10.1529/biophysj.107.104828. [DOI] [PMC free article] [PubMed] [Google Scholar]
- 11.Kruithof M., Chien F., de Jager M., van Noort J. Sub-picoNewton dynamic force spectroscopy using magnetic tweezers. Biophys. J. 2007;94:2343–2348. doi: 10.1529/biophysj.107.121673. [DOI] [PMC free article] [PubMed] [Google Scholar]
- 12.Gosse C., Croquette V. Magnetic tweezers: micromanipulation and force measurement at the molecular level. Biophys. J. 2002;82:3314–3329. doi: 10.1016/S0006-3495(02)75672-5. [DOI] [PMC free article] [PubMed] [Google Scholar]
- 13.Logie C., Peterson C.L. Catalytic activity of the yeast SWI/SNF complex on reconstituted nucleosome arrays. EMBO J. 1997;16:6772–6782. doi: 10.1093/emboj/16.22.6772. [DOI] [PMC free article] [PubMed] [Google Scholar]
- 14.Viterbi A. Error bounds for convolutional codes and an asymptotically optimum decoding algorithm. IEEE T. Inform. Theory. 1967;13:260–269. [Google Scholar]
- 15.Baum L., Petrie T., Soules G., Weiss N. A maximization technique occurring in statistical analysis of probabilistic functions of Markov chains. Ann. Math. Stat. 1970;41:164–171. [Google Scholar]
- 16.Segall D., Nelson P.C., Phillips R. Volume-exclusion effects in tethered-particle experiments: bead size matters. Phys. Rev. Lett. 2006;96:088306. doi: 10.1103/PhysRevLett.96.088306. [DOI] [PMC free article] [PubMed] [Google Scholar]
- 17.Marko J.F., Siggia E. Stretching DNA. Macromolecules. 1995;28:8759–8770. [Google Scholar]
- 18.Claudet C., Angelov D., Bouvet P., Dimitrov S., Bednar J. Histone octamer instability under single molecule experiment conditions. J. Biol. Chem. 2005;280:19958–19965. doi: 10.1074/jbc.M500121200. [DOI] [PubMed] [Google Scholar]
- 19.Thåström A., Lowary P.T., Widom J. Measurement of histone-DNA interaction free energy in nucleosomes. Methods. 2004;33:33–44. doi: 10.1016/j.ymeth.2003.10.018. [DOI] [PubMed] [Google Scholar]
- 20.Widom J. Physicochemical studies of the folding of the 100 A nucleosome filament into the 300 Å filament. Cation dependence. J. Mol. Biol. 1986;190:411–424. doi: 10.1016/0022-2836(86)90012-4. [DOI] [PubMed] [Google Scholar]
- 21.Valberg L., Holt J., Paulson E., Szivek J. Spectrochemical analysis of sodium, potassium, calcium, magnesium, copper, and zinc in normal human erythrocytes. J. Clin. Invest. 1965;44:379–389. doi: 10.1172/JCI105151. [DOI] [PMC free article] [PubMed] [Google Scholar]
- 22.Yan J., Marko J.F. Effects of DNA-distorting proteins on DNA elastic response. Phys. Rev. E Stat. Nonlin. Soft Matter Phys. 2003;68:011905. doi: 10.1103/PhysRevE.68.011905. [DOI] [PubMed] [Google Scholar]
- 23.van Noort J., Verbrugge S., Goosen N., Dekker C., Dame R.T. Dual architectural roles of HU: formation of flexible hinges and rigid filaments. Proc. Natl. Acad. Sci. USA. 2004;101:6969–6974. doi: 10.1073/pnas.0308230101. [DOI] [PMC free article] [PubMed] [Google Scholar]
- 24.Ali B.M., Amit R., Braslavsky I., Oppenheim A.B., Gileadi O. Compaction of single DNA molecules induced by binding of integration host factor (IHF) Proc. Natl. Acad. Sci. USA. 2001;98:10658–10663. doi: 10.1073/pnas.181029198. [DOI] [PMC free article] [PubMed] [Google Scholar]
- 25.Kulić I.M., Mohrbach H., Lobaskin V., Thaokar R., Schiessel H. Apparent persistence length renormalization of bent DNA. Phys. Rev. E Stat. Nonlin. Soft Matter Phys. 2005;72:041905. doi: 10.1103/PhysRevE.72.041905. [DOI] [PubMed] [Google Scholar]
- 26.Cecconi C., Shank E.A., Dahlquist F.W., Marqusee S., Bustamante C. Protein-DNA chimeras for single molecule mechanical folding studies with the optical tweezers. Eur. Biophys. J. 2008;37:729–738. doi: 10.1007/s00249-007-0247-y. [DOI] [PMC free article] [PubMed] [Google Scholar]
- 27.Wen J.-D., Manosas M., Li P.T.X., Smith S.B., Bustamante C. Force unfolding kinetics of RNA using optical tweezers. I. Effects of experimental variables on measured results. Biophys. J. 2007;92:2996–3009. doi: 10.1529/biophysj.106.094052. [DOI] [PMC free article] [PubMed] [Google Scholar]
Associated Data
This section collects any data citations, data availability statements, or supplementary materials included in this article.