Abstract
We report on the development and characterization of automated metal-free multiple-column nanoLC instrumentation for sensitive and high-throughput analysis of phosphopeptides with mass spectrometry analysis. The system implements a multiple-column capillary LC fluidic design developed for high-throughput analysis of peptides (Anal. Chem. 2001, 73, 3011–3021), incorporating modifications to achieve broad and sensitive analysis of phosphopeptides. The integrated nanoLC columns (50 µm i.d. × 30 cm containing 5 µm C18 particles) and the on-line solid phase extraction columns (150 µm i.d. × 4 cm containing 5 µm C18 particles) were connected to automatic switching valves with non-metal chromatographic accessories, and other modifications to avoid the exposure of the analyte to any metal surfaces during handling, separation, and electrospray ionization. The nanoLC developed provided a separation peak capacity of ∼250 for phosphopeptides (and ∼400 for normal peptides). A detection limit of 0.4 fmol was obtained when a linear ion trap tandem mass spectrometer (Finnegan LTQ) was coupled to a 50-µm i.d. column of the nanoLC. The separation power and sensitivity provided by the nanoLC-LTQ enabled identification of ∼4600 phosphopeptide candidates from ∼60 µg COS-7 cell tryptic digest followed by IMAC enrichment and ∼520 tyrosine phosphopeptides from ∼2 mg of human T cells digests followed by phosphotyrosine peptide immunoprecipitation.
Keywords: Metal free nano-LC, On line SPE column, Phosphopeptide, Automation, Mass spectrometer
INTRODUCTION
Phosphoproteomics is an important branch of proteomics as phosphorylation of proteins on serine, threonine, and tyrosine residues play major roles e.g. in processes that regulate cellular processes[1–4]. Characterizing protein phorphorylation, however, challenges analytical techniques due to the relatively low occurrence of phosphorylation on a large number of potential sites for a large number of proteins [5, 6] and the range in relative abundances of different phosphoproteins (for example, the relative abundances of pSer:pThr:pTyr has been estimated as 1800:200:1 for vertebrate cells [2]). In mass spectrometry (MS)-based approaches, sufficient analytical sensitivity is required for detection as phosphopeptides represent <1% of the total peptides from a proteome [7], and selective enrichment of phosphopeptides (e.g., chemical derivatization, antibodies, affinity, and ion exchange chromatography [8–15]) is typically applied prior to the LC-MS analysis.
The conditions of LC phosphopeptide separations greatly affect the MS detection sensitivity and dynamic range; however, few advances in LC of phosphopeptides have been made [16–20]. The LC of phosphopeptide is currently limited by low separation efficiency due to the use of short LC columns and less than ideal column arrangements. The separation efficiency that can be quantified by peak capacity depends on the column dimensions [21], and on the extra column dead volume [22]. Manual operation [19] to switch the loaded sample from the SPE column to the analytical column for phosphoproteome analysis may reduce the dead volume; however, this approach is not acceptable for high-throughput analyses. While the use of a vent column can help the sample loading, the resulting achievable separation quality is reduced [20]. Automated high-efficiency capillary LC [21–24] has been demonstrated for separation of peptides and transferring this technique to phosphoproteomics requires use of non-metal LC accessories, as effluent contact with metal materials affects the detection sensitivity of phosphopeptides [25].
Herein, we report on the development of a high performance automated metal-free nanoLC-MS/MS platform that is evaluated for the LC separation efficiency, the LC detection sensitivity, and the analytical coverage of phosphopeptides.
EXPERIMENTAL SECTION
All chemicals and solvents used for this work were HPLC grade (Aldrich; Milwaukee, WI) except KASIL, which was chemical reagent grade (PQ Corporation; Valley Forge, PA). Water was purified using a Barnstead Nanopure Infinity system (Dubuque, IA).
Implementation of a Metal-Free Automatic NanoLC System
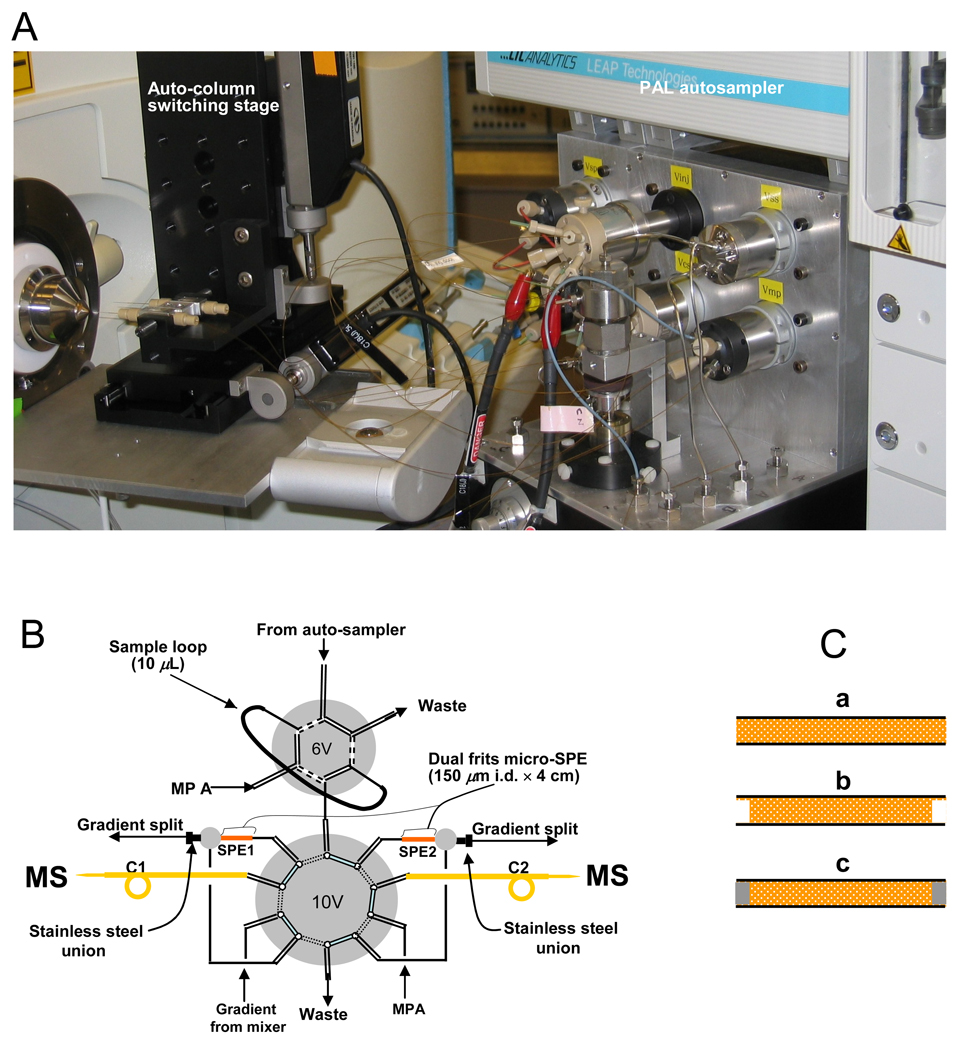
The multi-capillary metal-free LC system (Figure 1) was constructed based on modifications to a previously reported system [21]. Samples ranging from 5–50 µL were loaded onto the sample loop through a 6-ports peek valve (labeled as 6V; Valco Ins. Houston, TX. Prod No.: C2-1356) by a PAL auto-sampler (LEAP Technologies, Carrboro, NC) and transferred to the micro SPE using mobile phase A (0.1 M HOAc in 100% water) and B (0.1 M HOAc in 70:30 ACN: water). The concentrated sample was transferred from the SPE column to the 50-µm i.d. LC column through a 10-port peek valve (labeled as 10V, Valco Ins., Prod No.: C2H-1350), using a “back-flush” arrangement [22]. When the column labeled as SPE1 in Figure 1 was in use, SPE2 was being re-equilibrated by mobile phase A to prepare the column for loading, concentrating, desalting and separating the next sample. Two ISCO syringe pumps (Model100DM, Lincoln, NE) were used to deliver mobile phases. Sample retrieval, valve positioning, column switching, etc. were completed using a custom-designed software program LC-MS Control and the resultant reproducibility among the multiple (parallel) columns was reported [26].
Figure 1.
Schematic diagram of the automated metal-free multiple-column nano-LC system. (A): A photo of the automated metal–free multiple-column nanoLC system in coupling with tandem mass spectrometry through electrospray ionization. (B): The basic fluidic design of the nanoLC system; all valves used at this system were peek valves except refill and mobile phase selected valve; 4-cm long dual frits in-line SPE columns used for the sample trapping with “back Flash” arrangement. C: Steps in the manufacture of the dual frits microSPE columns: (a): cut the packed capillary into 4 cm for the microSPE column; (b): empty 1 mm from both sides of the microSPE column; (c): Generate frits at the microSPE column both inlet and outlet (details are given in the Experimental Section).
Fabrication of MicroSPE and NanoLC Columns
The 150-µm i.d. SPE columns containing 5 µm C18 particles (YMC, Wilmington, NC) and 50-µm i.d. nanoLC columns containing 5 µm C18 particles (Phenomenex, Terrence, CA) were packed using the established procedures [23]. Briefly, the 50 and 150 µm i.d. fused-silica capillary tubes (Polymicro Technologies, Phoenix, AZ) were packed at 5000 psi using acetonitrile/H2O (90:10, v/v) as the slurry solvent (slurry density ∼0.8 mg/mL). After conditioning in an ultrasonic bath for ∼5 min under packing pressures and depressured overnight, the packed tubes were cut to 40 cm for the LC columns (50-µm i.d) and 4 cm for the SPE columns (150-µm i.d) at normal pressure. The packed LC columns were dried by purging with nitrogen and then wetted with water, after which the integrated emitter tip was constructed by pulling a 8–10 µm i.d. emitter tip using a P-2000 laser puller (Sutter Instruments, Novato, CA) with the following parameters: Heat=350,320,300 and 305; Filament=0; Velocity=35, 20, 20 and 25; Delay=128 and pull= 4. Lastly, the column was cut to 30 cm for use.
The LC and SPE columns were sealed with sol-gel (Figure 1C). 1 mm of the packings was removed from the LC columns inlet and the SPE inlets and outlets. The empty sections of the LC and SPE columns were filled with a solution of 5:1 KASIL No. 1/formamide (KASIL = 2.5:1 SiO2/K2O). Briefly, 25 µL of formamide was added to 125 µL KASIL, mixed by vibration, and then spun down on a Micro-centrifuge (Denver Instrument Co; Denver, CO) for 1 min. The supernatant, i.e., sol-gel solution, was placed into a separate tube, and the packed capillary columns were inserted directly into the solution for 5 min to fill the emptied sections by capillary action. The columns were subsequently dried in an oven at 100°C for 10 min.
ESI-MS/MS Experiments
The metal-free LC was coupled to both conventional ion trap (LCQ) and linear ion trap (LTQ) mass spectrometers (ThermoElectron; San Jose, CA) to characterize the system performance. A Valco internal reducer (Prod No.: IZR1.5) was used to apply ESI voltage (1.70 kV) on the peek tee just behind the SPE column on the waste line side (see Figure 1). The LC eluent was scanned over a mass-to-charge (m/z) range of 400–2000, followed by MS/MS scans of the five most abundant peaks from the MS scan, using a collision energy setting of 35%.
Preparation of Phosphoproteomic Samples
COS-7 and human mammary epithelial cells (HMEC; American Type and Culture Collection, Manassas, VI) were cultured in high glucose DMEM (GIBCO-BRL, Life Technologies, Carlsbad, CA), and supplemented with 10% fetal calf serum (Hyclone, UT; 184 A1, ATCC # CRL-8798) and DFCI-1 medium [27] respectively. To ensure even distribution on the culture dish, cells were split 1:2 two days prior to harvest and then transferred to medium that lacked all supplements. BSA was added to 0.1% the following day to coat the cell culture plate. Following this procedure, the cells reached approximately 70% confluence. Growth factors were directly added into the minimal medium using small volumes of reagents. The medium was gently mixed and the plates returned to 37 °C for 7.5 min. Cells were then rinsed twice in ice cold PBS and harvested by scraping with PBS that contained 1 µM sodium orthovanadate. The low passage cells were grown to 70–80% confluence and harvested by treating with 0.25% trypsin. After dissolving the cells in lysis buffer (7M urea, 2 M thiourea, 40 mM Tris pH 8.4, Protease inhibitor cocktail, 2mM Vanadate and 50 nM calyculin), the solution was centrifuged at 25,000 × rpm at 4 °C for 1 h to pellet cell debris. The protein samples were subsequently reduced with 10 mM DTT at 37 °C for 30 min. Protein cysteinyl residues were alkylated with 40 mM iodoacetamide for 90 min at room temperature. The protein concentrations were measured using a Commassie blue assay (Pierce, Rockford, IL). The samples were diluted 10 times with NH4HCO3 (100 mM, pH8.3) and then digested using sequencing grade trypsin (Promega, Madison, WI) with a 1:50 (w/w) trypsin-to-protein ratio at 37°C overnight. The resulting peptides were desalted using an SPE C18 column (Supelco, Bellefonte, PA) and dried under vacuum. Peptide concentrations were determined using BCA assay (Pierce). Residual trypsin activity was quenched by boiling the samples for 10 min and immediately placing the samples on ice. HMEC and Jurkat cells were treated with Vanadate (1 mM).
The resultant peptides were converted to corresponding methyl esters according to a reported procedure [9], Dried peptides were reconstituted in 2 M methanolic HCl and allowed to stand at room temperature for 2 h, after which 160 µL acetyl chloride esterification reagent was added to the solution. After esterification, the solvent was removed by lyophilization and the procedure was repeated. A custom packed IMAC Macrotrap cartridge (3 mm i.d. × 8 mm length) (Michrom BioResources, Inc.; Auburn, CA) with POROS® MC (Metal Chelate) 20 µm Self Pack® Media (Applied Biosystems) was used for phosphopeptide enrichment. Columns were activated with 300 µL of 0.1 M FeCl3 (Alrich, Milwaukee, WI), and excess metal ions were removed with 300 µL of 0.1% HOAc. Dried peptide methylesters from each sample were dissolved in methanol, acetonitrile, and 0.1% acetic acid (1:1:1. v/v/v) before loading onto the IMAC column. Nonspecific binding peptides were removed by washing the column with 300 µL NaCl (100 mM), 1% acetic acid, 25% methanol. Phosphopeptides were eluted with 150 µL Na2HPO4 (50 mM, pH 9.0) and immediately acidified with acetic acid.
Peptide samples were dissolved in 200 µL of IP buffer (100 mM Tris, 100 mM NaCl, and 1% Nonidet P-40, pH 7.4) and 200 µL of water, and the pH was adjusted to 7.4. The mixed sample was incubated with 4 µg of anti-phosphotyrosine antibody nonconvolently bound to protein G agarose (Cell Signaling Technology, Danvers, MA) overnight at 4°C. The antibody beads were spun down for 1 min at 1500 × g, and the supernatant was separated and stored. The antibody-bound beads were washed twice with 200 µL of IP buffer for 10 min and twice with rinse buffer (100 mM Tris, 100 mM NaCl, pH 7.4) for 5 min at room temperature. The phosphotyrosine-containing peptides were eluted from the antibody-bound beads with 50 µL of 0.15% TFA for 1 h at room temperature.
The following phoshpopeptide standards (AnaSpec, Inc. San Jose, CA) were used to test system sensitivity: FQ-pS-EEQQQTEDELQDK (pep 1), DLDVPIPGRFDRRV-pS-VAAE (pep 2), and SFVLNPTNIGM-pS-KSSQGHVTK (pep 3), all of which were dissolved in 0.1M HOAc and 1% H3PO4, mixed together, and then diluted to different concentrations for analysis.
Data Analysis
MS/MS spectra were searched against the Human International Protein Index database (49,161 protein entries, Version 3.05, April, 2005; available online at www.ebi.ac.uk/IPI) using the SEQUEST algorithm. Methylation of aspartic acid, glutamic acid, peptide C-terminus, and carboxamidomethylation of cysteine were selected as static modifications, and phosphorylation of serine, threonine, and tyrosine as dynamic modifications for the global phosphoproteome dataset. Carboxyamidomethylation of cysteine was selected as static modifications and phosphorylation of tyrosine as dynamic modifications for the phosphotyrosine dataset. A parent mass tolerance of ±2 Da was used for SEQUEST analysis. An algorithm developed in-house was used to extract spectra quality metrics such as SEQUEST Xcorr, DelCn, DelM, etc., along with additional values, such as the relative intensity of the neutral loss peak and the number of peptide backbone fragments that also had a neutral loss.28
RESULTS AND DISCUSSION
Robustness and Safety for Operation of Metal-Free NanoLC
The high robustness of the nanoLC developed in this study was realized through use of an appropriate micro-SPE stage. The metal-free frits need to replace the metal screens that have used to hold particles for column connection in the conventional LC [21]. Initially, a 0.5-µm column inlet filter (P/N 160497, LC Packings, Dionex Company, Sunnyvale, CA) was tested as a replacement for the metal screens; however, it was easily broken at the operating pressures used in this study (i.e., up to 3000 psi). A capillary sample trap C18 column Ti frit (C-1300 and C-1250-1, Upchurch, Oak Harbor, WA) was also tested, but generated a large dead volume that deteriorated the nanoLC performance. These challenges were overcome by using a sol-gel to manufacture dual SPE frits that allowed for robust, efficient, and automatic operation of the metal-free nanoLC.
An issue that arose from operating with a metal-free LC was finding a suitable location to apply the ESI voltage. As a result, conductive ferrules (Upchurch Scientific), a Valco stainless steel union, and internal reducers (Valco) were tested as contacts for applying ESI voltage. While the conductive ferrules proved unsuitable as their application lead to unstable electrospray, possibly due to the smaller connective surface. The metal union and internal reducers were suitable for safe use with voltages in the range of 1.3–2.5 kV.
Separation Peak Capacities Provided by the Metal-Free NanoLC
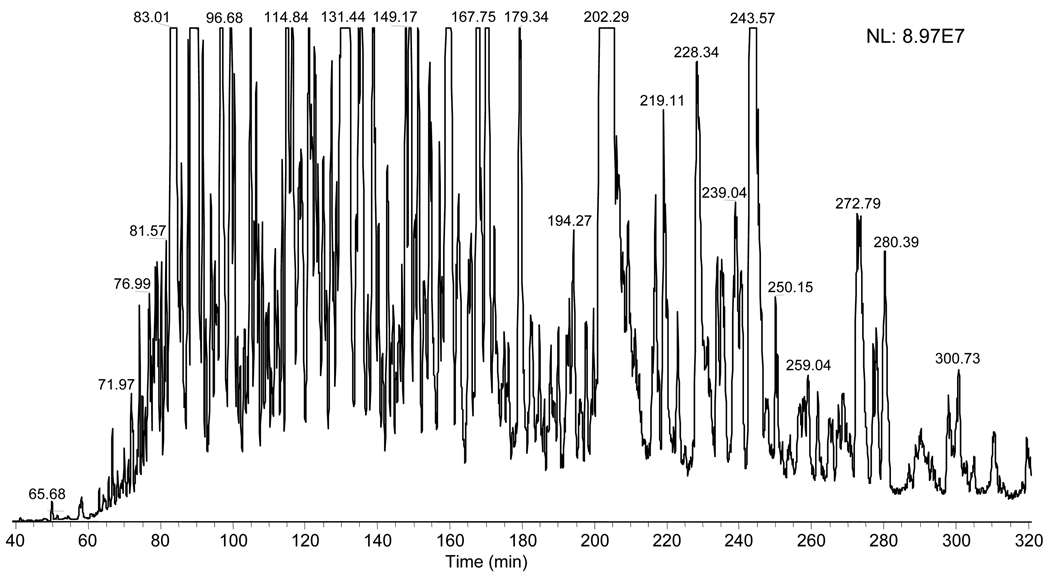
Figure 2 shows a base peak chromatogram achieved by using the developed metal-free nanoLC for separation of HEMC phosphopeptides. A separation peak capacity of 243 was estimated for phosphopeptides distributed along the effective LC separation time. From information available, this is the highest peak capacity reported for the single dimension LC separation of phosphopeptides. The nanoLC system was again evaluated using unmodified peptides (e.g., from a S. oneidensis tryptic digest); a peak capacity of 425 was obtained (data not shown), which is very close to the theoretical peak capacity [29] (i.e., 440) for 5-µm particle packed 30 cm columns used in this study. This revealed that the dead volume generated from use of the non-metal LC accessories and the column connections is minimized and the LC separation peak capacity is smaller for phosphopeptides than for normal peptides on the specific columns. The observation of smaller peak capacity for phosphopeptides may result from their less retention in the reversed-phase mode LC, which affected the achievement of LC peak capacity [29].
Figure 2.
Base peak chromatogram of phosphopeptides obtained with the automated metal-free nanoLC/ESI-MS/MS. The peak capacity was estimated as ∼240 using single ion current peaks extracted along the effective separation window of 50–320 min; A LTQ mass spectrometer was used for detection; other experimental conditions are detailed in the Experimental Section. Tested sample: HEMC phosphopeptides (enriched with IMAC).
Detection Limit and Quantitation Behavior of the Automated Metal-Free NanoLC for Analysis of Phosphopeptides
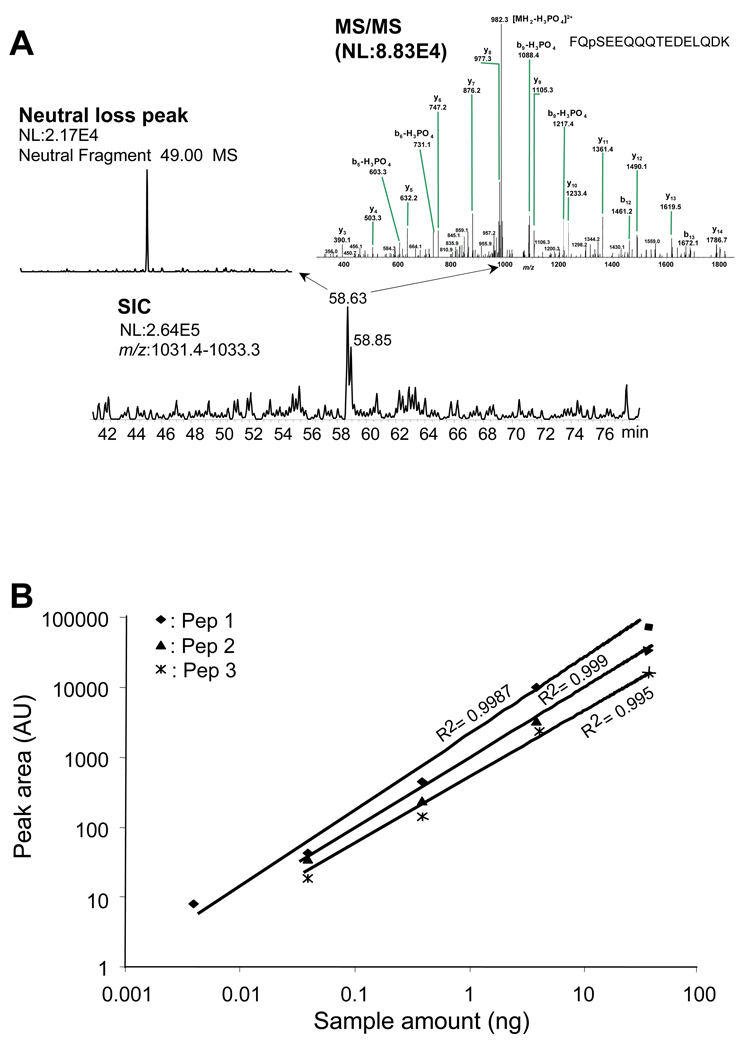
Figure 3A shows the detection limit of the metal-free nanoLC-ESI-MS/MS. For FQpSEEQQQTEDELQDK tested, a sample size of 0.4 fmol was sufficient to allow the phosphopeptide detected (see the MS/MS spectrum inserted in Figure 3A), which is ∼100 fold lower than that reported by using a conventional metal union connection capillary LC with addition of phosphoric acid (0.1%) in the mobile phase [30]. Figure 3B shows the signal linear response of LCQ MS to the phosphopeptide content on the metal-free nanoLC-ESI-LCQ MS platform. A linear response over 3–4 orders of magnitude was observed. The R2 values are 0.999, 0.999, and 0.995 for pep 1, pep 2, and pep 3, respectively, for phosphopeptide content in the range of 0.004 ng (for pep 1) and 0.04 ng (for pep 2 and pep 3) to 40 ng. This provides a basis for quantitative analysis of a relatively large range of different content phosphopeptides using the nanoLC developed in this study. From our knowledge, few literatures reported such a large linear response range for LC-ESI-MS of phosphopeptides. We also tested the detection limit for normal peptides, and found that the most abundant peptide could be identified from 1 ng S. oneidensis lysate tryptic digest and >4000 peptides and >1000 proteins from 50 ng S. oneidensis lysate tryptic digest (data not shown).
Figure 3.
Detection limit and quantitation performance achieved with the automated metal-free nanoLC/ESI-ion trap MS/MS for phosphorylated peptides. (A) Detection limit of the metal-free nanoLC/ESI-MS/MS; tested sample: 0.4 fmol of FQpSEEQQQTEDELQDK. (B) Linearity curves obtained for Pep 1 (FQ-pS-EEQQQTEDELQDK), pep 2 (DLDVPIPGRFDRRV-pS-VAAE), and pep 3 (SFVLNPTNIGM-pS-KSSQGHVTK) by the metal-free nanoLC/ESI-MS. The experimental conditions are the as for Figure 2 except for use of a LCQ MS for detection.
Evaluation of the Metal-Free NanoLC for Analysis of Complex Phosphoproteomes
It is notably difficult for database search engines to identify phosphopeptides from MS/MS spectra due to at least three fragmentation pathway possibilities, including the phosphate group remains intact, loss of HPO3 (−80), and loss of phosphate (−98). The search results from the use of low mass accuracy data (e.g., from ion trap mass spectrometers) are currently suffering from high false positive rates. However, the extensive neutral loss due to the exposure of phosphopeptides to collision-induced dissociation can be used as the indication for detection of phosphopeptides. As the objective of this study was to evaluate the performance of the nanoLC developed in this study and not the biology, we used the number of MS/MS spectra with neutral loss to demonstrate the efficiency of the system for detecting complex mixtures of phosphopeptides.
The metal-free nanoLC was first used to analyze IMAC-enriched phosphopeptides from COS-7 cells. Figure 4 shows the nanoLC-ESI-MS/MS of phosphopeptides enriched from a 60-µg tryptic digest of COS-7 cells. The pSer- and pThr-containing peptides were found as the major format of the phosphopeptides enriched by IMAC from manual inspection of the spectra. In a single nanoLC-MS/MS experiment, 4604 phosphopeptide candidates were tentatively identified when the neutral loss setting was used to scan for the most likely phosphopeptide MS/MS spectra that showed the extensive neutral loss of phosphate (>80% of the most intensive fragmentation peak in a given LTQ MS/MS spectrum; minimum number of 1000 points in the spectrum ion count). We estimated the number of detectable phosphopeptides present in a proteome digest by comparing the LC-MS peak intensity between the enriched phosphopeptides and the global proteome digest. From the difference of the peak intensities (data not shown), we deduced that that the content of phosphopeptides in the COS-7 cells was ∼0.01% of the total digest. This result is in agreement with our BCA assay that showed that the content of total phosphopeptides enriched by a macro IMAC trap from 500 µg COS-7 cells was 0.01∼0.1% of the total proteome sample.
Figure 4.
Metal-free nanoLC/ESI-MS/MS of a mixture of complex phosphopeptides from a product enriched from ∼60 µg tryptic digest of the COS-7 cells by IMAC. In this single analysis, 4603 phosphopeptide candidates were detected; neutral loss tool was used to scan for the most likely phosphopeptide MS/MS spectra (as the spectra inserted in the figure) and >80% of the most intensive fragmentation peaks in the spectrum showed the extensive neutral loss of phosphate. Experimental conditions are the same as for Figure 2 and the sample preparation is given in the Experimental Section.
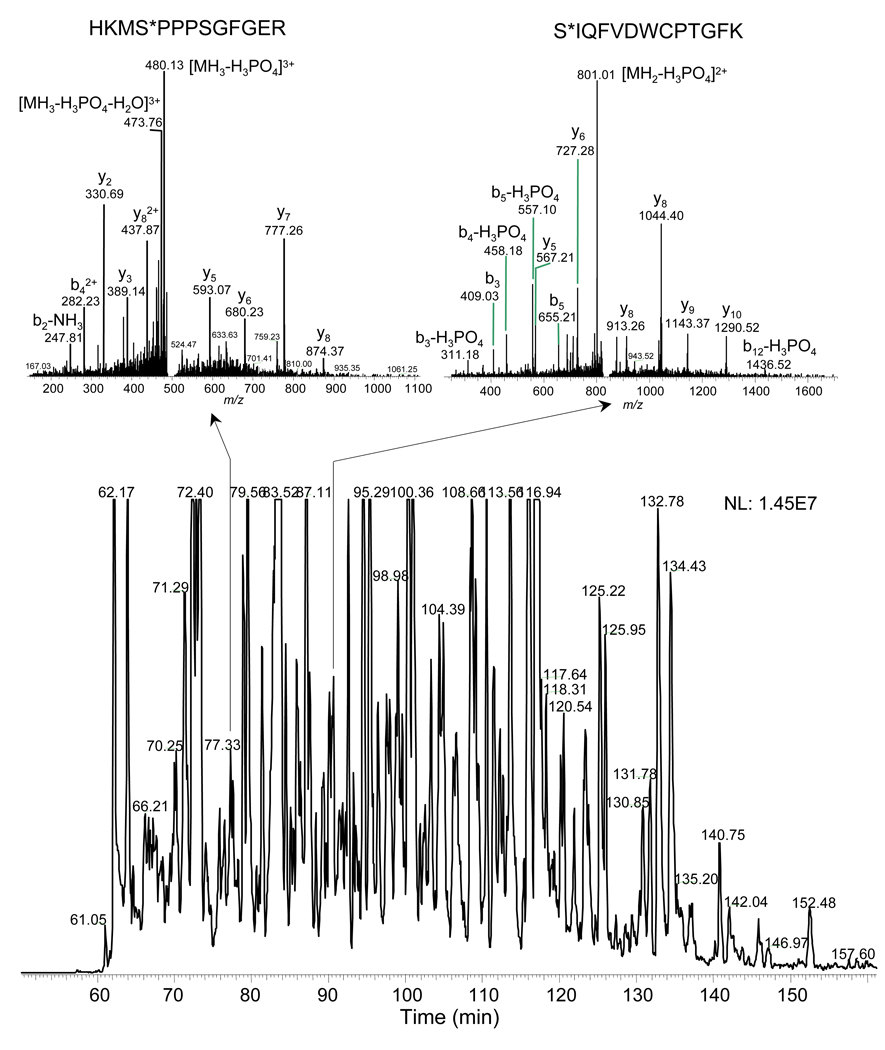
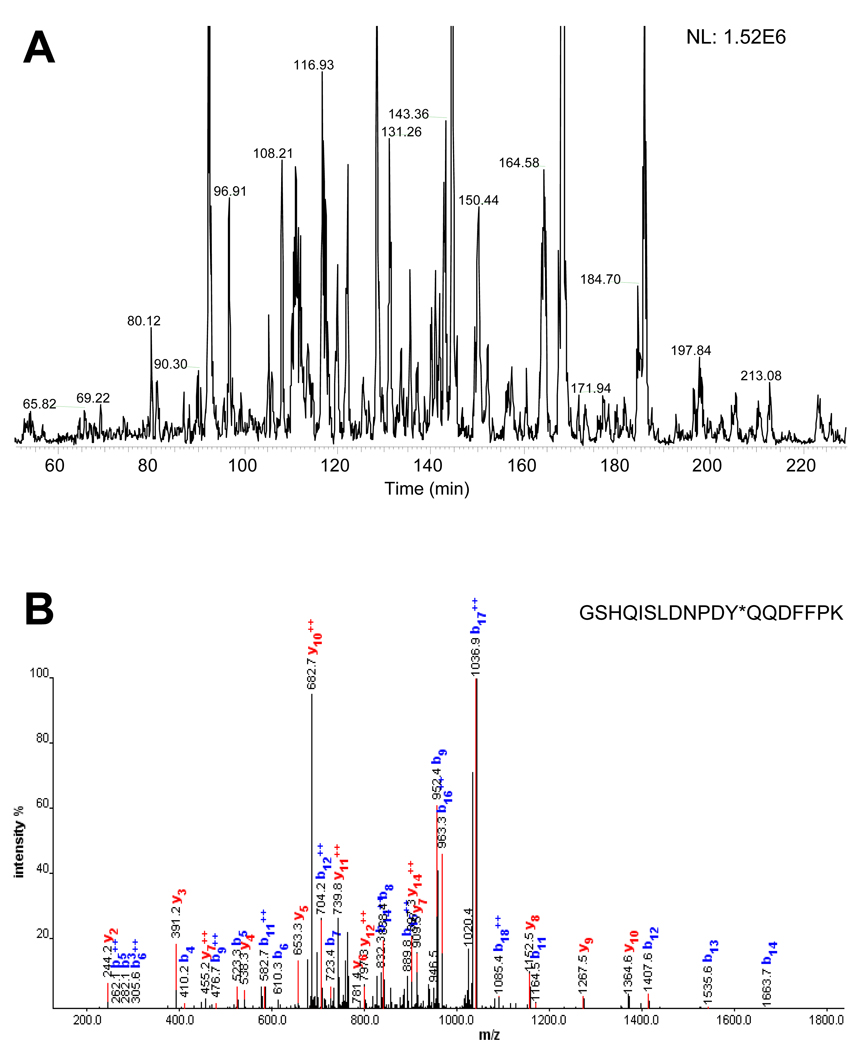
Next, we evaluated the performance of the metal-free nanoLC for analyzing a tyrosine phosphoproteome. Tyrosine phosphorylation is far less abundant than either serine or threonine phosphorylation (e.g., the relative abundances of pSer:pThr:pTyr has been estimated as 1800:200:1 for vertebrate cells2), and only a few hundred copies of a given pTyr protein may be present per cell.31 In spite of its low abundance, pTyr tends to be biologically more important than pSer and pThr, e.g., it is more tightly regulated within a cell[2]. As such, we used immunoprecipitation to concentrate tyrosine phosphorylated peptides in Jurkat cells treated with 1 µM tyrosine phosphatase inhibitor. Application of the same LC-MS system to analyze the Jurkat cell digest (Figure 5) resulted in identification of 525 of tyrosine phosphorylated peptides from a single LC-MS/MS analysis (Supplementary table 1). By coupling this system with LTQ-Orbitrap MS platform, a total of 550 different sites of tyrosine phosphorylation were identified in HMEC cells. These results highlight the overall sensitivity of LC-MS/MS plays a particularly crucial role for a successful analysis of the pTyr peptides.
Figure 5.
Metal-free nanoLC/ESI-MS/MS of a mixture of tyrosine phosphopeptides enriched from 3-mg HMEC digest. (A) Base peak chromatogram of the nanoLC-MS and (B) evidence of tyrosine phosphopeptide detected (the MS/MS spectrum was validated by manual inspection). Experimental conditions are the same as for Figure 2 and the sample preparation is given in the Experimental Section.
CONCLUSIONS
We have developed and evaluated the performance of a high performance metal-free automated multiple-column nanoLC for analysis of phosphoproteomics. The robustness of the nanoLC system allowed automatic collection of phosphoproteomic mass spectral data for 24 hours/day using a single LC system for high-throughput analysis of phosphoproteomes. This automated metal-free nanoLC system provided a chromatographic separation peak capacity of ∼250, a detection limit of 0.4 femtomole, and a linear dynamic range of 103 to 104 for analysis of phosphopeptides when coupled with ion trap mass spectrometers. The detection sensitivity was ∼100 fold higher than that obtained by adding phosphoric acid to the mobile phase of a conventional metal union connection capillary LC [30]. Such separation and detection power enabled detecting low abundant pSer- and pThr-peptides extracted from <100 µg whole cell proteome digests and even less abundant pTyr-peptides extracted from several mg proteomic samples. The operational pressure is presently limited by the sol-gel frit used for the SPE column, and we are currently evaluating alternatives to allow operation of the system at pressures up to 5000 psi to further improve the separation power, and as a result also the detection sensitivity, for phosphoproteomic analyses using smaller particles and longer packed capillary columns.
Supplementary Material
Identified phosphorylated peptides from the reported metal-free nanoLC-MS/MS system. The conditions are detailed in the text.
Column A: phosphorylated peptide; Column B: Xcor value; Column C: DeltaCn; Column D: protein ID.
ACKNOWLEDGMENTS
The authors thank Katrina Waters for helping with data analyses. Portions of this research were funded by the NIH National Center for Research Resources (RR018522) and the Laboratory Directed Research Development program at Pacific Northwest National Laboratory (PNNL). Work was performed in the Environmental Molecular Sciences Laboratory, a U.S. Department of Energy (DOE) national scientific user facility located at Pacific Northwest National Laboratory (PNNL) in Richland, Washington. PNNL is a multi-program national laboratory operated for the DOE by Battelle under Contract DE-AC05-76RL01830.
References
- 1.Hunter T. Cell. 2000;100:113. doi: 10.1016/s0092-8674(00)81688-8. [DOI] [PubMed] [Google Scholar]
- 2.Hunter T. Philos. Trans. R. Soc. Lond. B Biol. Sci. 1998;353:583. doi: 10.1098/rstb.1998.0228. [DOI] [PMC free article] [PubMed] [Google Scholar]
- 3.Cohen P. Nat. Rev. Drug Discov. 2002;1:309. doi: 10.1038/nrd773. [DOI] [PubMed] [Google Scholar]
- 4.Irish JM, Kotecha N, Nolan GP. Nat. Rev. Cancer. 2006;6:146. doi: 10.1038/nrc1804. [DOI] [PubMed] [Google Scholar]
- 5.Kalume DE, Molina H, Pandey A. Curr. Opin. Chem. Biol. 2003;7:64. doi: 10.1016/s1367-5931(02)00009-1. [DOI] [PubMed] [Google Scholar]
- 6.Olsen JV, Blagoev B, Gnad F, Macek B, Kumar C, Mortensen P, Mann M. Cell. 2006;127:635. doi: 10.1016/j.cell.2006.09.026. [DOI] [PubMed] [Google Scholar]
- 7.Conrads TP, Veenstra TD. Nat. Biotechnol. 2005;23:36. doi: 10.1038/nbt0105-36. [DOI] [PubMed] [Google Scholar]
- 8.Brill LM, Salomon AR, Ficarro SB, Mukherji M, Stettle-Gill M, Peters EC. Anal. Chem. 2004;76:2763. doi: 10.1021/ac035352d. [DOI] [PubMed] [Google Scholar]
- 9.Ficarro S, Chertihin O, Westbrook VA, White F, Jayes F, Kalab P, Marto JA, Shabanowitz J, Herr JC, Hunt DF, Visconti PE. J. Biol. Chem. 2003;278(9):11579. doi: 10.1074/jbc.M202325200. [DOI] [PubMed] [Google Scholar]
- 10.Pinkse MW, Uitto PM, Hilhorst MJ, Ooms B, Heck AJ. Anal. Chem. 2004;76:3935. doi: 10.1021/ac0498617. [DOI] [PubMed] [Google Scholar]
- 11.Rush J, Moritz A, Lee KA, Guo A, Goss VL, Spek EJ, Zhang H, Zha XM, Polakiewicz RD, Comb MJ. Nat. Biotechnol. 2005;23:94. doi: 10.1038/nbt1046. [DOI] [PubMed] [Google Scholar]
- 12.Zhou H, Watts JD, Aebersold R. Nat. Biotechnol. 2001;19:375. doi: 10.1038/86777. [DOI] [PubMed] [Google Scholar]
- 13.Tao WA, Wollscheid B, O'Brien R, Eng JK, Li XJ, Bodenmiller B, Watts JD, Hood L, Aebersold R. Nat. Methods. 2005;2:591. doi: 10.1038/nmeth776. [DOI] [PubMed] [Google Scholar]
- 14.Goshe MB, Veenstra TD, Panisko EA, Conrads TP, Angell NH, Smith RD. Anal. Chem. 2002;74:607. doi: 10.1021/ac015528g. [DOI] [PubMed] [Google Scholar]
- 15.Beausoleil SA, Jedrychowski M, Schwartz D, Elias JE, Villén J, Li J, Cohn MA, Cantley LC, Gygi SP. Proc. Natl. Acad. Sci. USA. 2004;101:12130. doi: 10.1073/pnas.0404720101. [DOI] [PMC free article] [PubMed] [Google Scholar]
- 16.Ficarro SB, Salomon AR, Brill LM, Mason DE, Stettler-Gill M, Brock A, Peters EC. Rapid Commun Mass Spectrom. 2005;19:57. doi: 10.1002/rcm.1746. [DOI] [PubMed] [Google Scholar]
- 17.Schlosser A, Vanselow JT, Kramer A. Anal. Chem. 2005;77:5243. doi: 10.1021/ac050232m. [DOI] [PubMed] [Google Scholar]
- 18.Wang J, Zhang Y, Jiang H, Cai Y, Qian X. Proteomics. 2006;6:404. doi: 10.1002/pmic.200500223. [DOI] [PubMed] [Google Scholar]
- 19.Martin SE, Shabanowitz J, Hunt DF, Marto JA. Anal. Chem. 2000;72:4266. doi: 10.1021/ac000497v. [DOI] [PubMed] [Google Scholar]
- 20.Licklider LJ, Thoreen CC, Peng J, Gygi SP. Anal. Chem. 2002;74:3076. doi: 10.1021/ac025529o. [DOI] [PubMed] [Google Scholar]
- 21.Shen Y, Tolić N, Zhao R, Paša-Tolić L, Li L, Berger SJ, Harkewicz R, Anderson GA, Belov ME, Smith RD. Anal. Chem. 2001;73:3011. doi: 10.1021/ac001393n. [DOI] [PubMed] [Google Scholar]
- 22.Shen Y, Moore RJ, Zhao R, Blonder J, Auberry DL, Masselon C, Paša-Tolić L, Hixson KK, Auberry KJ, Smith RD. Anal. Chem. 2003;75:3596. doi: 10.1021/ac0300690. [DOI] [PubMed] [Google Scholar]
- 23.Shen Y, Zhao R, Berger SJ, Anderson GA, Rodriguez N, Smith RD. Anal. Chem. 2002;74:4235. doi: 10.1021/ac0202280. [DOI] [PubMed] [Google Scholar]
- 24.Shen Y, Tolić N, Masselon C, Paša-Tolić L, Camp DG, II, Hixson KK, Zhao R, Anderson GA, Smith RD. Anal. Chem. 2004;76:144. doi: 10.1021/ac030096q. [DOI] [PubMed] [Google Scholar]
- 25.Liu S, Zhang C, Campbell JL, Zhang H, Yeung KK, Han VK, Lajoie GA. Rapid Commun. Mass Spectrom. 2005;19:2747. doi: 10.1002/rcm.2105. [DOI] [PubMed] [Google Scholar]
- 26.Livesay E, Tang K, Taylor BK, Buschbach MA, Hopkins DF, LaMarche BL, Zhao R, Shen Y, Orton DJ, Moore RJ, Kelly RT, Udseth HR, Smith RD. Anal. Chem. 2008;80:294. doi: 10.1021/ac701727r. [DOI] [PMC free article] [PubMed] [Google Scholar]
- 27.Band V, Sager R. Proc. Natl. Acad. Sci. USA. 1989;86:1249. doi: 10.1073/pnas.86.4.1249. [DOI] [PMC free article] [PubMed] [Google Scholar]
- 28.Yang F, Stenoien LD, Strittmatter EF, Wang J, Ding L, Lipton MS, Monroe ME, Nicora CD, Gristenko MA, Tang K, Fang R, Adkins JN, Camp DG, II, Chen DJ, Smith RD. J. Proteome Res. 2006;5:1252. doi: 10.1021/pr060028v. [DOI] [PubMed] [Google Scholar]
- 29.Shen Y, Zhang R, Moore RJ, Kim J, Metz TO, Hixson KK, Zhao R, Livesay EA, Udseth HR, Smith RD. Anal. Chem. 2005;77:3090. doi: 10.1021/ac0483062. [DOI] [PubMed] [Google Scholar]
- 30.Kim J, Camp DG, II, Smith RD. J. Mass Spectrom. 2004;39:208. doi: 10.1002/jms.593. [DOI] [PubMed] [Google Scholar]
- 31.Cooper JA, Sefton BM, Hunter T. Methods Enzymol. 1983;99:387. doi: 10.1016/0076-6879(83)99075-4. [DOI] [PubMed] [Google Scholar]
Associated Data
This section collects any data citations, data availability statements, or supplementary materials included in this article.
Supplementary Materials
Identified phosphorylated peptides from the reported metal-free nanoLC-MS/MS system. The conditions are detailed in the text.
Column A: phosphorylated peptide; Column B: Xcor value; Column C: DeltaCn; Column D: protein ID.


