

Abstract
Force-based ligand detection is a promising method to characterize molecular complexes label-free at physiological conditions. Because conventional implementations of this technique, e.g., based on atomic force microscopy or optical traps, are low-throughput and require extremely sensitive and sophisticated equipment, this approach has to date found only limited application. We present a low-cost, chip-based assay, which combines high-throughput force-based detection of dsDNA·ligand interactions with the ease of fluorescence detection. Within the comparative unbinding force assay, many duplicates of a target DNA duplex are probed against a defined reference DNA duplex each. The fractions of broken target and reference DNA duplexes are determined via fluorescence. With this assay, we investigated the DNA binding behavior of artificial pyrrole-imidazole polyamides. These small compounds can be programmed to target specific dsDNA sequences and distinguish between D- and L-DNA. We found that titration with polyamides specific for a binding motif, which is present in the target DNA duplex and not in the reference DNA duplex, reliably resulted in a shift toward larger fractions of broken reference bonds. From the concentration dependence nanomolar to picomolar dissociation constants of dsDNA·ligand complexes were determined, agreeing well with prior quantitative DNAase footprinting experiments. This finding corroborates that the forced unbinding of dsDNA in presence of a ligand is a nonequilibrium process that produces a snapshot of the equilibrium distribution between dsDNA and dsDNA·ligand complexes.
Introduction
Small DNA-binding molecules are in the spotlight of many fields of research. Whether it is genomics, systems biology, or molecular medicine, the knowledge if and how strong a molecule interacts with a specific DNA sequence is of utmost interest. The formation of such complexes is typically linked to changes in the double-helical structure and may even result in the displacement or blocking of other molecules. This enables important functions in e.g., transcription, recombination, and DNA repair (1,2).
Given the importance of understanding the basis of molecular recognition, assays are needed that allow for fast, sensitive, and quantitative detection of dsDNA·ligand complexes. Traditionally, DNase footprinting experiments are employed to identify the binding sites of a ligand on dsDNA and also quantify the respective affinities. Although certainly powerful, DNase footprinting is a complex procedure and requires several days of preparation (3). Very rapid and also label-free quantification of even minuscule amounts of ligand becomes possible with microcantilever arrays (4). They suffer, however, from the costs associated with the fabrication and chemical modification of large numbers of cantilevers.
It is often of importance to identify the full DNA recognition profile of a certain DNA binder to understand what kind of role the binder plays within a living organism. Chip-based methods accommodate the need for massively parallel analysis of dsDNA·ligand interactions: chromatin immunoprecipitation-on-chip (ChIP-on-chip) is a widespread technique allowing for a genome-wide identification of protein-binding sites (5,6). ChIP-on-chip relies on nonspecific cross-linking of DNA with a DNA-binding molecule in vivo. Cross-linking efficiencies vary from molecule to molecule, and some interactions may even be missed (7). In particular, the detection of small molecules interacting with DNA is nontrivial. Today, a growing number of in vitro chip-based assays are available allowing for the analysis of dsDNA·ligand interactions under controlled experimental conditions. In an experiment by Warren et al. (8,9), all permutations of an eight basepair dsDNA sequence were displayed on a single chip. Ligand binding was detected directly by fluorescence and the cognate sites were ranked in the order of increasing affinity. However, fluorescence trades fast and sensitive readout for a labeled ligand, and the label may alter the sequence specificity profile of the ligand in an unbiased manner. A widespread label-free detection method is surface plasmon resonance imaging. Due to the small change in refractive index, the detection of small molecules with surface plasmon resonance imaging is complicated and requires larger features compared to fluorescence-based techniques (10,11). Depending on the application, the background signal caused by unwanted adsorption imposes a substantially challenge to all chip-based methods. The fabrication of inert surfaces is even considered as the main bottleneck for further development of the latter (12).
Here, we present a microarray compatible dsDNA·ligand complex detection format, which is based on the comparative unbinding force assay (CUFA). CUFA has already been applied to detect single nucleotide polymorphisms (13), to study differences of antibody/antigen interactions (14), to eliminate cross-reactions on protein microarrays (15), and to investigate the chiral selectivity of small peptides (16). For dsDNA·ligand interaction detection, CUFA relies on the alteration of the unbinding forces of a target dsDNA as a result of ligand binding (17–19). This effect was demonstrated in single molecule experiments employing atomic force microscopy (AFM) (20) (21,22), optical tweezers (23), and magnetic tweezers (24) (Fig. 1, a–c).
Figure 1.
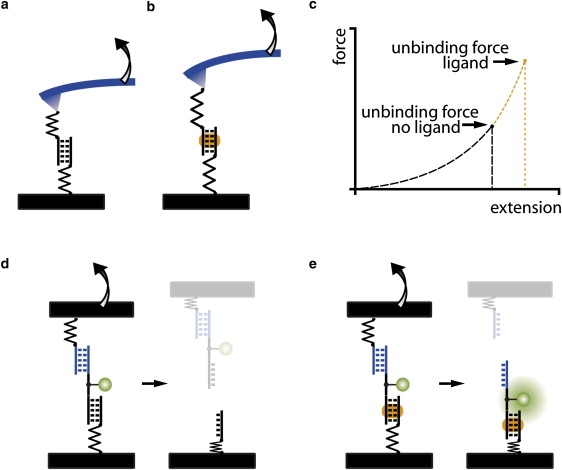
(a) Conventional, AFM-based single molecule force spectroscopy, in which the force required to unbind a molecular bond, such as a target DNA duplex, is measured with a cantilever spring. (b) A ligand bound to the target DNA duplex alters the force required for unbinding. (c) Single molecule force spectroscopy data are typically presented as force-extension traces. From two absolute force measurements, the consequences of ligand binding can be investigated. (d) The CUFA replaces the cantilever spring by a known reference bond. Upon loading the chain of target DNA duplex and reference DNA duplex, the weaker of the two bonds has a higher probability of unbinding than the stronger one. (e) In case a ligand forms a complex with the target DNA duplex and stabilizes it, significantly more fluorophores end up on the side of the target DNA duplex after separation of the two surfaces.
Instead of a microscopic, spring-like object, e.g., a cantilever or a trapped bead, CUFA employs a precisely defined molecular bond as force sensor. Thereby, the target DNA duplex is directly compared against a reference DNA duplex and merely fluorescence is required to readout the experiment (Fig. 1, d and e). In comparison with conventional force-based measurements, many of the experimental uncertainties are removed. With no calibration offsets or instrument drift the comparative unbinding force experiments are more accurate and independent of the experimental apparatus. Naturally, such experiments are primed to be carried out in parallel by using a chip format with many duplicates (in the order of 104/μm2) of the same experiment contributing to the excellent sensitivity of the measurement. The resulting assay is fluorescence based; however, it does not require a labeled ligand. Only the DNA linker between the target and reference DNA duplex is conjugated to a fluorophore at a noninteracting basepair. Rather than detecting the mere presence of the ligand, the change of unbinding forces of the target DNA duplex due to ligand binding is detected. By this means the assay is insensitive to nonspecific adsorption and deals with one of the major bottlenecks of current biochips.
As a model system, we investigated sequence programmable pyrrole-imidazole hairpin polyamides (25). These molecules recognize the minor groove of DNA with affinities and specificities comparable to naturally occurring DNA-binding proteins (26,27). The sequence specificity arises from interactions of pairs of the aromatic amino acids N-methylpyrrole (Py), N-methylimidazole (Im), and N-methylhydroxypyrrole (Hp) with the edges of the Watson-Crick DNA basepairs. A pairing of Im opposite to Py targets a G·C basepair, and Py/Im recognizes a C·G basepair, whereas a Py/Py pair comprises a preference for both A·T and T·A (28). The discrimination of T·A from A·T using Hp/Py pairs completes the four basepair letter code (29). Eight-ring hairpin polyamides provide a good compromise between synthetic ease and molecular recognition properties. In this binding motif, a γ-aminobutyric acid residue connects the carboxylic terminus of one strand to the amino terminus of the other (30). The turn residue also serves as a DNA recognition element for A·T and T·A basepairs. Further, a β-alanine residue and a dimethylaminopropylamide tail at the C-terminus each confer a specificity for A·T and T·A basepairs (31). This general addressability of the DNA minor groove is supported by x-ray and NMR structure studies (32,33) and has been utilized in several applications, including, for example, DNA nanostructures (34,35), recruitment of DNA-binding proteins (36,37), and the inhibition of gene expression within living cells (38–40).
Here we report the application of CUFA to accurately determine the thermal dissociation constant KD of three different dsDNA·polyamide interactions (Fig. 2 a). In particular, we investigated the influence of a chiral turn as well as a single mismatch to the overall affinity of an eight-ring hairpin polyamide to the same target DNA sequence (Fig. 2 b).
Figure 2.

(a) Chemical structures of matched hairpin polyamides P1, (R)-2, and (S)-2 as well as single basepair mismatched compounds (R)-P3 and (S)-P3. The ball and stick model represents imidazole and pyrrole as solid and open circles, respectively. The β-alanine residue is shown as a diamond, and the dimethylaminopropylamide tail is shown as a half circle with a plus. The chiral diaminobutyric acid turn residue is represented as a turn, to which a semicircle with a plus is linked. R and S chirality is indicated by a solid and dashed connection of the semicircle to the turn, respectively. (b) Ball and stick representation for the three different hairpin motifs bound to the same target DNA sequence. P1 binds sequence specific to the target DNA sequence. (R)-2 is modified with a chiral diaminobutyric acid turn, which increases the overall binding affinity. (R)-3 is also modified with a chiral diaminobutyric acid turn, however contains a single basepair mismatch that reduces the overall binding affinity.
Materials and Methods
DNA constructs
DNA oligomers 1: NH2-(hexaethyleneglycol)5-5′-TTT TTT TTT TCA GTC GCT GAC CAA CCT CGT-3′, 2: 3′-GTC AGC GAC TGG TTG GAG CAC TTT T(Cy3)-5′-5′- TTT TTC TGC TCC AAC CAG TCG CTG AC -3′, 3: Biotin-5′-TTT TTT TTT TGT CAGCGACTGGTTGGAGCA, 4: 3′-GTC AGC GAC TGG TTG GAG CAC TTT T(Cy3)-5′-5′-TTT TTC ACG AGG TTG GTC AGC GAC TG-3′, and 5: Biotin-5′-TTT TTT TTT TCA GTC GCT GAC CAA CCT CGT-3′ were purchased HPLC grade from IBA GmbH (Goettingen, Germany). Italic letters in oligomers 4 and 5 represent L-DNA bases. In upside-down experiments the NH2-(hexaethyleneglycol)5 (HEGL) and biotin modifications were exchanged.
Molecular setup preparation (DNA slide)
Each individual molecular chain consisting of a reference and a target DNA duplex is referred to as a “molecular setup”. Oligomer 1 is amine-modified at the 5′ end and allows covalent attachment to an aldehyde-functionalized glass slide (Schott GmbH, Jena, Germany). Two microliter drops of 5× phosphate buffered saline (PBS; Roche GmbH, Grenzach, Germany) containing 25 μM oligomer 1 were spotted on an aldehyde glass slide in a 4 × 4 pattern and were incubated in a saturated NaCl ddH2O atmosphere overnight. After washing the slide with ddH2O containing 0.2% sodium dodecyl sulfate (VWR Scientific GmbH, Darmstadt, Germany) and thoroughly rinsing the slide in ddH2O, the resulting Schiff bases were reduced with 1% aqueous NaBH4 (VWR Scientific GmbH, Darmstadt, Germany) for 20 min. After thoroughly rinsing the slide in ddH2O, the slides were blocked in 1× PBS containing 4% bovine serum albumin (Sigma-Aldrich GmbH, Munich, Germany) for 30 min. A custom-made 16-well silicone isolator (Grace-Biolabs, OR) was placed on the top of the immobilized DNA oligomer 1 spots. Three microliters of 1× PBS containing 1 μM oligomer 2 and 2 μM oligomer 3 were added to each well and incubated for 1 h, completing the 1·2·3 molecular setups. Then, the slide was washed with 1× PBS containing 0.05% sodium dodecyl sulfate and thoroughly rinsed with 1× PBS. The silicon isolator remained on the slide throughout the experiment, and care was taken that after hybridization the slide always remained immersed in 1× PBS. The 1·4·5 and upside-down molecular setups were prepared accordingly.
PDMS stamp
The polydimethylsiloxane (PDMS) stamp was fabricated by casting 10:1 (base/crosslinker) (Sylgard, Dow Corning, MI) into a custom-made micro- and millistructured silicon wafer (HSG-IMIT, Villingen-Schwenningen, Germany) (41). After curing was complete, the PDMS was taken out of the mold and cut into a 4 × 4 pillar arrangement. Each pillar is 1 mm diameter, is 1 mm high, and carries a microstructure on the flat surface: 100 × 100 μm2 pads are separated by 41 μm wide and 5 μm deep trenches allowing for liquid drainage during the contact and separation process. Free polymers were extracted in toluene for at least 1 day (42). The PDMS was activated overnight in 12.5% hydrochloric acid and subsequently derivatized with (3-glycidoxypropyl)-trimethoxysilane (ABCR, Karlsruhe, Germany) to generate epoxide groups. NH2-PEG-Biotin (3400 g/mol; Rapp Polymere, Tübingen, Germany) was melted at 80°C, and ∼1 μL was spotted on each pillar followed by overnight incubation in argon atmosphere at 80°C. The excess polymers were thoroughly removed with ddH2O. Shortly before the experiment, the PDMS was incubated with 1 μg/ml streptavidin (Thermo Fisher Scientific, Bonn, Germany) in 1× PBS and 0.4% bovine serum albumin for 30 min, washed with 1× PBS containing 0.05% Tween 20 (VWR Scientific GmbH, Darmstadt, Germany), with 1× PBS and gently dried with N2 gas.
Ligand incubation
Sixteen-well silicone isolators allowed the addition of up to 16 different concentrations of the dsDNA ligands within a single experiment. Because of technical convenience, we restricted ourselves to the addition of eight different concentrations. Fifty millileters volume of polyamides in 1× PBS was circulated through each well for at least 2 h using a self-made fluidic system driven by a 16-channel peristaltic pump (Ismatec GmbH, Wertheim-Mondfeld, Germany).
Coupling and separation
The streptavidin functionalized PDMS stamp was approached to the DNA slide using high-precision stepper motors (OWIS GmbH, Staufen, Germany) and a piezo actuator (Piezo Systems Jena, Jena, Germany), monitored by reflection interference contrast microscopy (43). The biotinylated molecular complexes and the multivalent streptavidin coated PDMS stamp were allowed to couple via a biotin·streptavidin·biotin complex for 10 min, followed by retraction of the PDMS stamp at a velocity of 5 μm/s. Biotin·streptavidin is an extremely strong molecular interaction and is of significantly greater stability than short dsDNA at the applied separation velocity (44,45). In separate controls, we determined that no noteworthy amount of fluorescently labeled streptavidin was transferred from the PDMS to the DNA array during an experiment.
Analysis
Fluorescence images of the DNA slide were recorded in solution using a confocal scanner with 4 μm resolution (Tecan Austria GmbH, Austria) before and after the contact. The fluorescence per unit area was assumed to be proportional to the fluorescently labeled species per unit area (see Fig. S1 in the Supporting Material). The normalized fluorescence intensity (NF) is defined as the number of broken reference bonds normalized to the total number of individual molecular setups that have been under load. For the 1·2·3 molecular setups, it was determined as follows: initially, all molecular setups are present in the state S0 and were detected via the Cy3 labeled oligomer 2 (Fig. 3 a). After separation, the molecular setups on the glass slide exist in three different states, S0 (1·2·3), S1 (1·2), and S2 (1), as shown in Fig. 3 b. An unbinding force was applied only to the molecular setups in state S1 and S2. Molecular setups in state S0 did not couple to the PDMS streptavidin surface and therefore retained the biotinylated oligomer 3. Because S1 and S0 cannot be distinguished, the latter was labeled with the spectrally distinct fluorescent marker streptavidin Alexa Fluor 647 (AF; Fig. 3 c). The labeling was performed subsequent to the Cy3 readout to avoid quenching or fluorescence resonance energy transfer effects. The Cy3 and AF fluorescence images allow the quantification of the relative amounts of S0, S1, and S2 (Fig. 3, d and e). The Cy3 and AF fluorescence images recorded after contact contain square-like features corresponding to the contacted area. From each square-like feature the Cy3Rem and AFRem were determined individually. Cy3Initial and AFInitial were determined from the noncontacted regions adjacent to each square-like feature.
| (1) |
| (2) |
| (3) |
| (4A) |
| (4B) |
Figure 3.
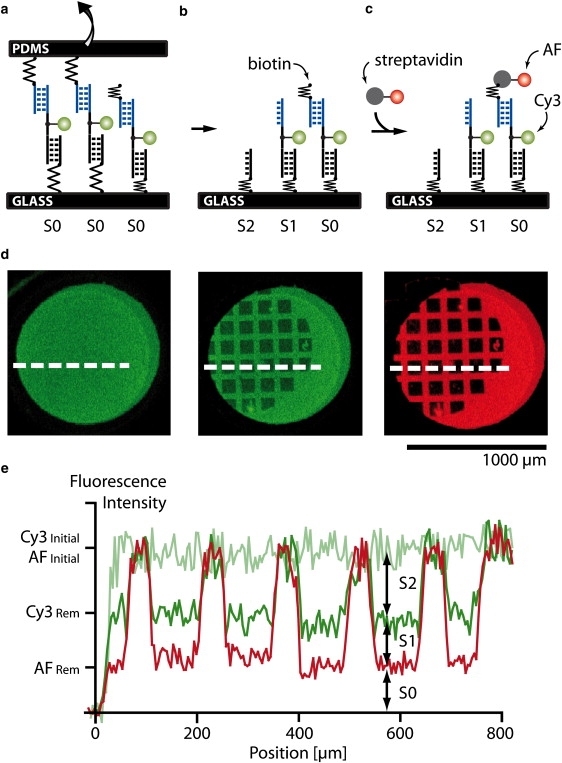
Comparative unbinding force experiment on the molecular level. (a) Before separation of the two surfaces, all molecular setups are in the state S0. (b) After separation, either target (state S2) or reference (state S1) bond is broken or no coupling (state S0) occurred. (c) Because states S0 and S1 cannot be distinguished by fluorescence, the free biotin of state S0 is labeled with streptavidin Alexa Fluor 647 (AF). (d) Fluorescence images of the glass slide before and after separation as well as after incubation with AF. The dark square-like features correspond to the area contacted with a microstructured PDMS stamp. (e) Corresponding line plots. From the fluorescence intensities the relative amounts of the states S0, S1, and S2 can be determined.
S0, S1, and S2 are normalized such that the relation S0 + S1 + S2 = 1 is always true. As defined above, the NF is given by the number of broken 2·3 bonds (S1) normalized to the number of bonds that have been under load (S1 + S2):
| (5) |
The NF directly reflects the relative mechanical stability, a physical quantity inherent to a pair of molecular complexes, and is not influenced by the amount of molecules under load. The NF should not be confused with the Cy3Ratio. For a fixed mechanical stability, the latter depends on the number of coupled molecular complexes, whereas the NF does not. The NFs presented in this work are the averages of the NFs determined from all square-like features of an experiment. The 1·4·5 and upside-down molecular setups were analyzed accordingly.
Polyamide synthesis
Polyamide conjugates were synthesized on solid-phase using published Boc-based protocols and purified by reverse-phase HPLC (≥95% purity) (46). Ultraviolet-visible spectra were recorded in water on a Hewlett-Packard Model 8452 A diode array spectrophotometer. All polyamide concentrations were determined using an extinction coefficient of 69,200 M−1cm−1 at λmax near 310 nm. Matrix-assisted, LASER desorption/ionization time-of-flight mass spectrometry (MALDI-TOF MS) was performed using an Applied Biosystems Voyager DR Pro spectrometer. Polyamide P1: MALDI-TOF [M+H]+ calcd for C57H71N22O10+ = 1223.6, observed = 1223.4, (R)-P2: MALDI-TOF [M+H]+ calcd for C57H72N23O10+ = 1238.6, observed = 1238.6, (S)-P2: MALDI-TOF [M+H]+ calcd for C57H72N23O10+ = 1238.6, observed = 1238.5, (R)-P3: MALDI-TOF [M+H]+ calcd for C58H73N22O10+ = 1237.6, observed = 1237.3, (S)-P3: MALDI-TOF [M+H]+ calcd for C58H73N22O10+ = 1237.6, observed = 1237.5.
Melting temperature analysis
Melting temperatures were monitored on a Beckman ultraviolet-visible spectrometer at 260 nm within 25–90°C by applying a heating rate of 0.5°C/min. Measurements were performed in a degassed buffer containing 2 μM DNA duplex/polyamide (1:1), 10 mM NaCl, and 100 mM NaH2PO4 at pH 7.0. Tm-values are defined as the maximum of the first derivative of the melting curve.
Results and Discussion
Force-based ligand detection relies on the alteration of unbinding forces due to dsDNA·ligand complex formation. In the course of conventional single molecule experiments, one strand of a DNA duplex is immobilized to solid support via a polyethyleneglycole (PEG) linker. In the same way, the complementary strand is immobilized to a microscopic force detector such as an AFM cantilever. Upon contacting the AFM cantilever with the solid support, the two complementary DNA strands hybridize. During separation of the support and the detector surface, the PEG linkers act like entropic springs (47,48), and an increasing force builds up until the DNA duplex unbinds (Fig. 1, a and b). The force extension curve is recorded and the unbinding force determined. Because unbinding is a thermally activated process (49) and the force detector is limited by thermal noise (50), several hundred experiments are typically performed to determine the unbinding forces with sufficient accuracy. As demonstrated by Krautbauer et al. (17) as well as Koch et al. (18), complex formation of a DNA duplex with a small molecule or a protein is accompanied by a shift of the unbinding forces (Fig. 1 c). In our comparative unbinding force experiments, a known molecular bond carrying a fluorescent label replaces the microscopic force detector (Fig. 1, d and e).
Fig. 4 a illustrates the molecular setup schematically. Target DNA duplex 1·2 is immobilized to glass support via a (hexaethyleneglycol)5 linker of oligomer 1. Reference DNA duplex 2·3 is bridged to 1·2 via a 10 basepair single stranded polythymine linker carrying a Cy3 fluorescence label. Oligomer 3 carries a biotin modification at the end of another polythymine linker. Before the force experiment, a fluidic system allows for incubation of the molecular setups with different ligand concentrations (Fig. 4 b). In Fig. 4 c, a soft PDMS stamp is brought in contact with the 1·2·3 complexes on the glass slide analogously to a microcontact-printing experiment (51,52). 1·2·3 couples to the PDMS stamp via biotin·streptavidin complex formation. Upon retraction of the PDMS stamp at 5 μm/s force is built up gradually acting along the molecular chain consisting of the linkers as well as the 1·2 and 2·3 duplexes until either 1·2 or 2·3 breaks (Fig. 4 d).
Figure 4.
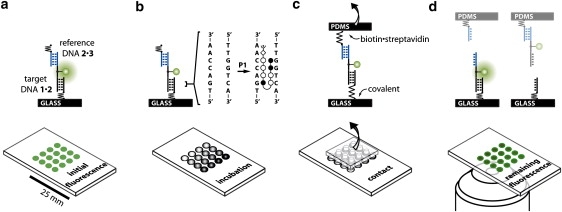
Schematics of CUFA experiments. (a) The molecular setup consists of two DNA duplexes, i.e., the 1·2 target and the 2·3 reference DNA duplex, linked in series. (b) A simple fluidic system allows incubation of 16 identical DNA spots with eight different polyamide P1 concentrations. (c) The molecular setups are linked between glass support and PDMS. Separation of the surfaces applies a load to the chain of duplexes until the weaker fails. (d) The fluorescently labeled linking DNA oligomer 2 is more likely to remain on the side of the more stable DNA·ligand complex.
Approximately 104 duplicates of the same experiment are performed per μm2. The absolute force needed to pull the two surfaces apart is neither recorded nor analyzed. Instead, the unbinding force of each target DNA duplex is compared individually against a separate reference duplex. For each molecular chain, the two possible experimental outcomes are distinguished by determining the location of the fluorescently labeled oligomer 2. In case the fluorophore remained on the glass slide, the 2·3 DNA duplex is broken, and in case the fluorophore was transferred to the PDMS stamp, the 1·2 DNA duplex is broken.
The target and the reference DNA duplex are comprised of the same basepair composition, and the outcome “1·2 is broken” should be close to equally likely to the outcome “2·3 is broken” (53). Experimentally, we determined a NF (see Materials and Methods) of 38.4% with an error of 1.6%, which we estimated from repeated measurements (Fig. 5 a). We attribute this deviation from the expected NF of 50% to the symmetry break due to the different surfaces to which the oligomers are attached. DNA duplexes are sensitive to solution conditions such as pH and ionic strength (54), which may differ depending on the proximity of the DNA duplex to the PDMS or the glass surface. This minor imbalance does not affect the quantitative detection of dsDNA·ligand complexes.
Figure 5.
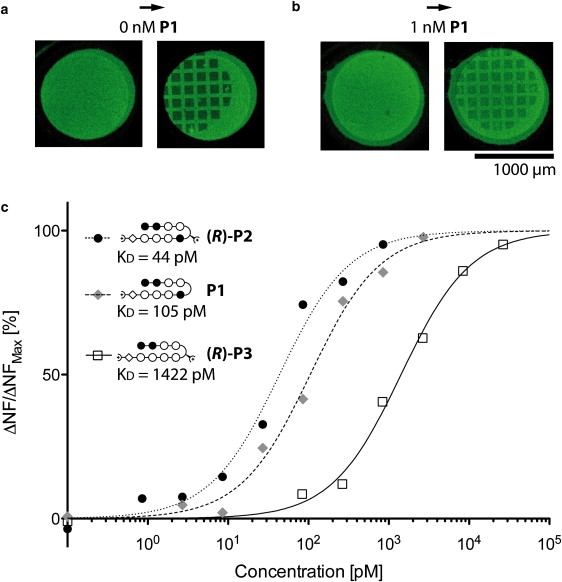
(a) Cy3 fluorescence image of 1·2·3 molecular setups on a glass slide before and after contact with a PDMS stamp in absence of P1. (b) Cy3 fluorescence image of 1·2·3 molecular setups on a glass slide before and after contact with a PDMS stamp in presence of 1 nM P1. The fluorescence intensity of the contacted area is higher compared to the 0 nM case. (c) Relative change in NF due to titration with three different polyamide compounds.
Nonchiral hairpin polyamide
To investigate whether the CUFA is applicable to determine the thermal dissociation constant KD of dsDNA·ligand interactions, we incubated 1·2·3 molecular setups with different concentrations of hairpin polyamide P1. Thereby, we make use of a symmetry breaking property, such that P1 only binds to the target and not the reference DNA duplex: hairpin polyamides bind sequence specific with a preference for N→C orientation with respect to the 5′→3′ direction of the adjacent DNA strand (55,56). The preferred binding motif 5′-TGACCAA-3′ of polyamide P1 is present in the 1·2 target DNA duplex, whereas the 2·3 reference DNA duplex contains the reverse-binding motif 5′-AACCAGT-3′, to which P1 binds with significantly decreased affinity.
On a single chip, we incubated 16 identical spots of immobilized 1·2·3 molecular setups with eight different P1 concentrations ranging from 0 to 2.7 nM and performed a CUFA experiment as described above. The NF increased with increasing polyamide concentration from 38.4% (Fig. 5 a) until it saturated at 63.1% (Fig. 5 b). This is in agreement with a stabilizing effect of P1 on the 1·2 duplex. As it is common for quantitative dsDNA·polyamide interaction studies, we fitted the titration data to the Hill equation isotherm (a more detailed discussion follows at the end of this section) (9,58). The apparent thermal dissociation constant KD was determined to be 105 pM with a 95% confidence interval of [65 pM, 169 pM] agreeing well with previously published quantitative DNase footprinting and microarray data (58). The NF data including the fit are shown in Fig. 5 c.
To ensure that the molecular setup responds as expected, we investigated the upside-down molecular setup 3·2·1. Here, the position of the target and the reference DNA duplex is exchanged, and thus the response to the addition of P1 should be inverted. Indeed, the NF decreased from 31.9% to 7.7% upon increasing the P1 concentration from 0 to 10 nM. In this case, the polyamide binds preferentially to the DNA duplex adjacent to the PDMS stamp, and therefore the amount of fluorescently labeled oligomer 2 transferred to the PDMS stamp was increased in presence of P1.
Chiral hairpin polyamide
In previous work, we demonstrated that chiral hairpin polyamides distinguish between D- and L-DNA (16). Chiral selectivitiy is introduced by an amine substituent on the γ-turn amino acid of the hairpin polyamide that was also shown to lead to an increase in binding affinity (47). The chiral hairpin polyamide (R)-P2, which recognizes the same sequence as P1, was examined employing the 1·4·5 molecular setup. 1·4 is identical to the 1·2 target DNA duplex, and 4·5 is the mirrored DNA duplex to 1·4. (R)-P2 binds preferentially to the 1·4 5′-TGACCAA-3′ binding motif, whereas 4·5 presents less optimal binding sites due to its opposite chirality.
Analogous to the previous experiment, an increase in concentration of (R)-P2 from 0 to 1 nM lead to an increase of the NF from 47.1% to 80.3%, agreeing with a stabilizing effect on the D-DNA duplex 1·4. Fitting the titration data to a Hill equation isotherm revealed an apparent thermal dissociation constant KD of 44 pM with a 95% confidence interval of [23 pM, 83 pM]. The KD for the (R)-P2 hairpin polyamide has not been reported yet. However, a lowered KD compared to P1 is consistent with prior experiences with the addition of an amine substituent to the γ-turn amino acid of regular polyamide hairpins (47). The NF data including the fit are shown in Fig. 5 c.
For control, the 5·4·1 upside-down molecular setup in combination with (R)-P2 was measured at 0 nM and 10 nM yielding 32.8% and 12.9%, respectively. The regular molecular setup 1·4·5 in combination with mirror imaged polyamide (S)-P2 was also measured at 0 nM and 10 nM resulting in NF of 44.1% and 20.9%. The two controls demonstrated that the response of the assay was as expected: in the 5·4·1 upside-down molecular setup, the target and reference DNA duplex are essentially mirrored (target and reference are of identical sequence but opposite chirality). In this case, the ligand recognizes the DNA duplex adjacent to the PDMS stamp and the change in NF due to ligand binding was inverted. In case the ligand was mirrored and incubated with the 1·4·5 molecular setup, the ligand recognized the reference bond as its preferential binding motif and the change in NF was also inverted.
Mismatched hairpin polyamide
Introducing the single basepair mismatched polyamide (R)-P3 to the 1·4·5 molecular setup is expected to form a DNA-ligand complex of lower affinity (57). In detail, 1·4 provides a binding motif for (R)-P3 with a single basepair mismatch. The affinity to 4·5 is even further decreased, because the binding motif contains a single basepair mismatch and, in addition, is of opposite chirality. Incubation of the 1·4·5 molecular setup with increasing concentrations of (R)-P3 increased the NF from 47.1% at 0 nM to 71.2% at 27 nM. The apparent KD, determined from a fit of the NF to the Hill equation isotherm, was 1442 pM with a 95% confidence interval of [932 pM, 2169 pM]. The NF data including the fit are shown in Fig. 5 c.
Controls were performed with the 5·4·1 upside-down molecular setup in absence and presence of 10 nM (R)-P3, yielding NF of 32.8% and 15.4%, respectively. For the regular 1·4·5 molecular setup, the NF fluorescence also decreased from 47.1% in absence to 25.6% in presence of 10 nM mirrored compound (S)-P3. Both controls, in which either the molecular setup or the ligand was mirrored, produced an inverted change in NF as response to the addition of the ligand.
Melting temperatures
To ensure that the differences in unbinding forces were a result of target DNA duplex stabilization by hairpin polyamides, the melting temperatures of the dsDNA·polyamide complexes were determined. The results clearly showed a larger increase in melting temperature for the target duplexes in presence of the polyamides compared to the reference duplexes (Fig. 6).
Figure 6.

Melting temperatures of the target and reference DNA duplex in presence and absence of polyamides. The polyamides and DNA duplexes are mixed at a stoichiometry of 1:1 at 2 μM.
Thermal dissociation constant
The affinity of a hairpin polyamide for its dsDNA binding site is characterized by the thermal dissociation constant KD. The experimental data suggest that the Hill equation isotherm governs the response of the NF, from which the KD characteristic for the dsDNA·polyamide complex under investigation is easily determined. In the following, we derive the response of CUFA beginning with the law of mass action.
The law of mass action describes the amounts of dsDNA·ligand complexes, unbound dsDNA, and free ligands at chemical equilibrium with a dsDNA·ligand complex characteristic thermal KD defined as
| (6) |
In our experiments, the total amount of added ligand exceeded the available dsDNA binding sites by at least two orders of magnitude. As a result, the probability p of a dsDNA binding site to be occupied by a ligand is given by the Hill equation isotherm and depends on the ligand concentration and KD only (58):
| (7) |
For further analysis, it is crucial to compare the timescale of association to a single binding site to the timescale of the force probing. The apparent KD determined from the CUFA experiment may vary from the initial thermal KD, if the system is allowed to equilibrate during the application of the external force: at equilibrium and ligand concentrations around the thermal KD the association rate, given by [ligand]·kon, is of the same order of magnitude as the dissociation rate koff. The lifetime or inverse dissociation rate for a dsDNA·polyamide complex was experimentally determined to be ∼500 s (59). At 5 μm/s separation velocity and similar linker lengths, the force needed to rupture a 20 basepair DNA duplex is built up on timescales in the order of τ = 0.01 s (44). The DNA duplex unbinding occurs therefore on a much faster timescale τ than the association or dissociation of the dsDNA·ligand complex at relevant ligand concentrations:
| (8) |
Although the natural off-rate of polyamides is very low, dissociation of the ligand from the DNA duplex during force probing may be nonnegligible. Studies suggest that the B-S transition of DNA under force can be explained by a tilt of the basepairs and a significant reorganization of the helical structure of the DNA (60–62). The B-S transition has not been observed for 20 basepair duplexes yet (44). However, even small deformations of the dsDNA helical structure may lead to the dissociation of the ligand, especially because hairpin polyamides are particularly sensitive to deformations of the minor groove. This results in a decreased fraction of occupied binding sites at the time of dsDNA unbinding compared to the initial situation before force is applied. Given that the association rate is slow, rebinding of the ligand to the dsDNA is neglected and the fraction of occupied binding sites is reduced by a constant factor f.
| (9) |
where f lies within the interval [0,1]. The probability of a binding site to be occupied by a ligand is still governed by the Hill equation isotherm; however with increasing ligand concentration, the probability p′ saturates at f < 1 instead of 1. Importantly, the apparent KD is identical with the thermal KD.
The target DNA sequence was designed such that there is only one preferred polyamide-binding site. Without loss of generality, the no-ligand case is assumed to yield NF0, whereas the bound-ligand case is assumed to yield NF1. The fluorescence signals of these two states superimpose each other, and the expected total fluorescence signal as a function of the polyamide concentration is the sum of the NFs of the two states weighted by their relative occurrence:
| (10) |
The dissociation of ligands from the DNA duplex results in a decrease of the maximal change in NF, whereas the apparent KD is not affected. To conclude, in case Eq. 8 holds, the forced unbinding of dsDNA in presence of a ligand is a nonequilibrium process that produces a snapshot of the equilibrium distribution between dsDNA and dsDNA·ligand complexes from which the thermal dissociation constant KD can be determined.
Conclusion
The CUFA was successfully applied to quantify the thermal dissociation constants of three different dsDNA-polyamide complexes. For this purpose, polyamide concentrations as low as 10 pM were detected. This level of sensitivity is comparable to conventional chip methods, which work with fluorescently labeled ligands (9). Labeling, however, may alter the binding behavior compared with the unlabeled ligand and is not always applicable. Label-free high-throughput techniques, such as surface plasmon resonance, are challenged when they are confronted with small molecules like polyamides, which are easily detected employing CUFA. Our approach not only avoids labeling of the interacting molecules (a label is attached to linking DNA strand at a noninteracting basepair), but also permits the combination of different experiments as well as controls on one chip. The current DNA-feature size is hundreds of micrometers but can be reduced to several micrometers using conventional microarray spotters. Miniaturization will allow for a high degree of parallelization and significantly reduced sample volumes.
We foresee CUFA in combination with microarray technology to be used as a tool to rapidly determine and quantify the sequence-recognition profile of small molecules like transcription factors, drugs, or other DNA-binding molecules. In separate experiments, we demonstrated that short-lived molecular interactions are captured in molecular crowded environments, as will be published elsewhere (63). Thus, the sensitivity range covers molecular complexes with micromolar to picomolar thermal dissociation constants and CUFA may prove to be the ideal tool for systems biologists, who have a growing interest in techniques that obtain affinity binder data with sufficient accuracy in a high-throughput fashion (64,65). The experimental procedure is as simple as contacting and separating two surfaces and can be implemented in any laboratory equipped with a quantitative fluorescence microscope.
Acknowledgments
D. Ho and P. Severin are grateful to the Elite Network of Bavaria (IDK-NBT) for a doctoral fellowship. C. Dose is grateful to the Alexander von Humboldt foundation for a postdoctoral fellowship.
Financial support was provided by the Nanosystems Initiative Munich, the Deutsche Forschungsgemeinschaft, the Fonds der Chemischen Industrie, and the National Institutes of Health.
Supporting Material
References
- 1.Gottesfeld J.M., Neely L., Trauger J.W., Baird E.E., Dervan P.B. Regulation of gene expression by small molecules. Nature. 1997;387:202–205. doi: 10.1038/387202a0. [DOI] [PubMed] [Google Scholar]
- 2.Majmudar C.Y., Mapp A.K. Chemical approaches to transcriptional regulation. Curr. Opin. Chem. Biol. 2005;9:467–474. doi: 10.1016/j.cbpa.2005.08.012. [DOI] [PubMed] [Google Scholar]
- 3.Connaghan-Jones K., Moody A., Bain D. Quantitative DNase footprint titration: a tool for analyzing the energetics of protein–DNA interactions. Nat. Protocols. 2008;3:900–914. doi: 10.1038/nprot.2008.53. [DOI] [PubMed] [Google Scholar]
- 4.Zhang J., Lang H., Huber F., Bietsch A., Grange W. Rapid and label-free nanomechanical detection of biomarker transcripts in human RNA. Nat. Nanotechnol. 2006;1:214–220. doi: 10.1038/nnano.2006.134. [DOI] [PubMed] [Google Scholar]
- 5.Ren B. Genome-wide location and function of DNA binding proteins. Science. 2000;290:2306–2309. doi: 10.1126/science.290.5500.2306. [DOI] [PubMed] [Google Scholar]
- 6.Harbison C.T., Gordon D.B., Lee T.I., Rinaldi N.J., Macisaac K.D. Transcriptional regulatory code of a eukaryotic genome. Nature. 2004;431:99–104. doi: 10.1038/nature02800. [DOI] [PMC free article] [PubMed] [Google Scholar]
- 7.Solomon M.J., Varshavsky A. Formaldehyde-mediated DNA-protein crosslinking: a probe for in vivo chromatin structures. Proc. Natl. Acad. Sci. USA. 1985;82:6470–6474. doi: 10.1073/pnas.82.19.6470. [DOI] [PMC free article] [PubMed] [Google Scholar]
- 8.Warren C., Kratochvil N., Hauschild K., Foister S., Brezinski M. Defining the sequence-recognition profile of DNA-binding molecules. Proc. Natl. Acad. Sci. USA. 2006;103:867–872. doi: 10.1073/pnas.0509843102. [DOI] [PMC free article] [PubMed] [Google Scholar]
- 9.Puckett J., Muzikar K., Tietjen J., Warren C., Ansari A. Quantitative microarray profiling of DNA-binding molecules. J. Am. Chem. Soc. 2007;129:12310–12319. doi: 10.1021/ja0744899. [DOI] [PMC free article] [PubMed] [Google Scholar]
- 10.Boozer C., Kim G., Cong S., Guan H., Londergan T. Looking towards label-free biomolecular interaction analysis in a high-throughput format: a review of new surface plasmon resonance technologies. Curr. Opin. Biotechnol. 2006;17:400–405. doi: 10.1016/j.copbio.2006.06.012. [DOI] [PubMed] [Google Scholar]
- 11.Wang J., Zhou H.S. Aptamer-based Au nanoparticles-enhanced surface plasmon resonance detection of small molecules. Anal. Chem. 2008;80:7174–7178. doi: 10.1021/ac801281c. [DOI] [PubMed] [Google Scholar]
- 12.Gurard-Levin Z.A., Mrksich M.A. Combining self-assembled monolayers and mass spectrometry for applications in biochips. Annu. Rev. Anal. Chem. 2008;1:767–800. doi: 10.1146/annurev.anchem.1.031207.112903. [DOI] [PubMed] [Google Scholar]
- 13.Albrecht C., Blank K., Lalic-Multhaler M., Hirler S., Mai T. DNA: a programmable force sensor. Science. 2003;301:367–370. doi: 10.1126/science.1084713. [DOI] [PubMed] [Google Scholar]
- 14.Blank K., Mai T., Gilbert I., Schiffmann S., Rankl J. A force-based protein biochip. Proc. Natl. Acad. Sci. USA. 2003;100:11356–11360. doi: 10.1073/pnas.1934928100. [DOI] [PMC free article] [PubMed] [Google Scholar]
- 15.Blank K., Lankenau A., Mai T., Schiffmann S., Gilbert I. Double-chip protein arrays: force-based multiplex sandwich immunoassays with increased specificity. Anal. Bioanal. Chem. 2004;379:974–981. doi: 10.1007/s00216-004-2607-0. [DOI] [PubMed] [Google Scholar]
- 16.Dose C., Ho D., Gaub H.E., Dervan P.B., Albrecht C.H. Recognition of “mirror-image” DNA by small molecules. Angew. Chem. 2007;46:8384–8387. doi: 10.1002/anie.200703007. [DOI] [PubMed] [Google Scholar]
- 17.Krautbauer R., Fischerlander S., Allen S., Gaub H.E. Mechanical fingerprints of DNA drug complexes. Single Mol. 2002;3:97–103. [Google Scholar]
- 18.Koch S.J., Shundrovsky A., Jantzen B.C., Wang M.D. Probing protein-DNA interactions by unzipping a single DNA double helix. Biophys. J. 2002;83:1098–1105. doi: 10.1016/S0006-3495(02)75233-8. [DOI] [PMC free article] [PubMed] [Google Scholar]
- 19.Leuba S.H., Karymov M.A., Tomschik M., Ramjit R. Assembly of single chromatin fibers depends on the tension in the DNA molecule: magnetic tweezers study. Proc. Natl. Acad. Sci. USA. 2003;100:495–500. doi: 10.1073/pnas.0136890100. [DOI] [PMC free article] [PubMed] [Google Scholar]
- 20.Puchner E.M., Alexandrovich A., Kho A.L., Hensen U., Schäfer L.V., Brandmeier B., Gräter F., Grubmüller H., Gaub H.E., Gautel M. Mechanoenzymatics of titin kinase. Proc. Natl. Acad. Sci. USA. 2008;105:13385–13390. doi: 10.1073/pnas.0805034105. [DOI] [PMC free article] [PubMed] [Google Scholar]
- 21.Schlierf M., Berkemeier F., Rief M. Direct observation of active protein folding using lock-in force spectroscopy. Biophys. J. 2007;93:3989–3998. doi: 10.1529/biophysj.107.114397. [DOI] [PMC free article] [PubMed] [Google Scholar]
- 22.Wiita A., Perez-Jimenez R., Walther K., Gräter F., Berne B. Probing the chemistry of thioredoxin catalysis with force. Nature. 2007;450:124–127. doi: 10.1038/nature06231. [DOI] [PMC free article] [PubMed] [Google Scholar]
- 23.Clemen A.E.M., Vilfan M., Jaud J., Zhang J.S., Barmann M. Force-dependent stepping kinetics of myosin-V. Biophys. J. 2005;88:4402–4410. doi: 10.1529/biophysj.104.053504. [DOI] [PMC free article] [PubMed] [Google Scholar]
- 24.Gosse C., Croquette V. Magnetic tweezers: micromanipulation and force measurement at the molecular level. Biophys. J. 2002;82:3314–3329. doi: 10.1016/S0006-3495(02)75672-5. [DOI] [PMC free article] [PubMed] [Google Scholar]
- 25.Dervan P.B., Poulin-Kerstien A.T., Fechter E.J., Edelson B.S. Regulation of gene expression by synthetic DNA-binding ligands. Top. Curr. Chem. 2005;253:1–31. [Google Scholar]
- 26.Dervan P.B., Edelson B.S. Recognition of the DNA minor groove by pyrrole-imidazole polyamides. Curr. Opin. Struct. Biol. 2003;13:284–299. doi: 10.1016/s0959-440x(03)00081-2. [DOI] [PubMed] [Google Scholar]
- 27.Dervan P.B. Molecular recognition of DNA by small molecules. Bioorg. Med. Chem. 2001;9:2215–2235. doi: 10.1016/s0968-0896(01)00262-0. [DOI] [PubMed] [Google Scholar]
- 28.White S., Szewczyk J.W., Turner J.M., Baird E.E., Dervan P.B. Recognition of the four Watson-Crick base pairs in the DNA minor groove by synthetic ligands. Nature. 1998;391:468–471. doi: 10.1038/35106. [DOI] [PubMed] [Google Scholar]
- 29.Kielkopf C.L., Bremer R.E., White S., Szewczyk J.W., Turner J.M. Structural effects of DNA sequence on T.A recognition by hydroxypyrrole/pyrrole pairs in the minor groove. J. Mol. Biol. 2000;295:557–567. doi: 10.1006/jmbi.1999.3364. [DOI] [PubMed] [Google Scholar]
- 30.Mrksich M., Parks M.E., Dervan P.B. Hairpin peptide motif - a new class of oligopeptides for sequence-specific recognition in the minor-groove of double-helical DNA. J. Am. Chem. Soc. 1994;116:7983–7988. [Google Scholar]
- 31.Swalley S.E., Baird E.E., Dervan P.B. Effects of γ-turn and β-tail amino acids on sequence-specific recognition of DNA by hairpin polyamides. J. Am. Chem. Soc. 1999;121:1113–1120. [Google Scholar]
- 32.Kielkopf C.L., White S., Szewczyk J.W., Turner J.M., Baird E.E. A structural basis for recognition of A center dot T and T center dot A base pairs in the minor groove of B-DNA. Science. 1998;282:111–115. doi: 10.1126/science.282.5386.111. [DOI] [PubMed] [Google Scholar]
- 33.deClairac R.P.L., Geierstanger B.H., Mrksich M., Dervan P.B., Wemmer D.E. NMR characterization of hairpin polyamide complexes with the minor groove of DNA. J. Am. Chem. Soc. 1997;119:7909–7916. [Google Scholar]
- 34.Cohen J.D., Sadowski J.P., Dervan P.B. Addressing single molecules on DNA nanostructures. Angew. Chem. 2007;46:7956–7959. doi: 10.1002/anie.200702767. [DOI] [PubMed] [Google Scholar]
- 35.Schmidt T.L., Nandi C.K., Rasched G., Parui P.P., Brutschy B. Polyamide struts for DNA architectures. Angew. Chem. 2007;46:4382–4384. doi: 10.1002/anie.200700469. [DOI] [PubMed] [Google Scholar]
- 36.Arndt H.D., Hauschild K.E., Sullivan D.P., Lake K., Dervan P.B. Toward artificial developmental regulators. J. Am. Chem. Soc. 2003;125:13322–13323. doi: 10.1021/ja0371395. [DOI] [PubMed] [Google Scholar]
- 37.Stafford R.L., Arndt H.D., Brezinski M.L., Ansari A.Z., Dervan P.B. Minimization of a protein-DNA dimerizer. J. Am. Chem. Soc. 2007;129:2660–2668. doi: 10.1021/ja067971k. [DOI] [PMC free article] [PubMed] [Google Scholar]
- 38.Olenyuk B.Z., Zhang G.J., Klco J.M., Nickols N.G., Kaelin W.G., Jr. Inhibition of vascular endothelial growth factor with a sequence-specific hypoxia response element antagonist. Proc. Natl. Acad. Sci. USA. 2004;101:16768–16773. doi: 10.1073/pnas.0407617101. [DOI] [PMC free article] [PubMed] [Google Scholar]
- 39.Nickols N.G., Dervan P.B. Suppression of androgen receptor-mediated gene expression by a sequence-specific DNA-binding polyamide. Proc. Natl. Acad. Sci. USA. 2007;104:10418–10423. doi: 10.1073/pnas.0704217104. [DOI] [PMC free article] [PubMed] [Google Scholar]
- 40.Nickols N.G., Jacobs C.S., Farkas M.E., Dervan P.B. Modulating hypoxia-inducible transcription by disrupting the HIF-1-DNA interface. ACS Chem. Biol. 2007;2:561–571. doi: 10.1021/cb700110z. [DOI] [PMC free article] [PubMed] [Google Scholar]
- 41.Albrecht C.H., Clausen-Schaumann H., Gaub H.E. Differential analysis of biomolecular rupture forces. J. Phys. Condens. Matter. 2006;18:S581–S599. [Google Scholar]
- 42.Perutz S., Kramer E.J., Baney J., Hui C.Y. Adhesion between hydrolyzed surfaces of poly(dimethylsiloxane) networks. Macromolecules. 1997;30:7964–7969. [Google Scholar]
- 43.Wiegand G., Neumaier K.R., Sackmann E. Microinterferometry: three-dimensional reconstruction of surface microtopography for thin-film and wetting studies by reflection interference contrast microscopy (RICM) Appl. Opt. 1998;37:6892–6905. doi: 10.1364/ao.37.006892. [DOI] [PubMed] [Google Scholar]
- 44.Morfill J., Kuhner F., Blank K., Lugmaier R., Sedlmair J. B-S transition in short oligonucleotides. Biophys. J. 2007;93:2400–2409. doi: 10.1529/biophysj.107.106112. [DOI] [PMC free article] [PubMed] [Google Scholar]
- 45.Merkel R., Nassoy P., Leung A., Ritchie K., Evans E. Energy landscapes of receptor-ligand bonds explored with dynamic force spectroscopy. Nature. 1999;397:50–53. doi: 10.1038/16219. [DOI] [PubMed] [Google Scholar]
- 46.Herman D.M., Baird E.E., Dervan P.B. Stereochemical control of the DNA binding affinity, sequence specificity, and orientation preference of chiral hairpin polyamides in the minor groove. J. Am. Chem. Soc. 1998;120:1382–1391. [Google Scholar]
- 47.Kienberger F., Pastushenko V.P., Kada G., Gruber H.J. Static and dynamical properties of single poly(ethylene glycol) molecules investigated by force spectroscopy. Single Mol. 2000;78:123–128. [Google Scholar]
- 48.Friedsam C., Wehle A.K., Kuhner F., Gaub H.E. Dynamic single-molecule force spectroscopy: bond rupture analysis with variable spacer length. J. Phys. Condens. Matter. 2003;15:S1709–S1723. [Google Scholar]
- 49.Evans E., Ritchie K. Dynamic strength of molecular adhesion bonds. Biophys. J. 1997;72:1541–1555. doi: 10.1016/S0006-3495(97)78802-7. [DOI] [PMC free article] [PubMed] [Google Scholar]
- 50.Viani M., Schäffer T., Chand A., Rief M., Gaub H.E., Hansma P. Small cantilevers for force spectroscopy of single molecules. J. Appl. Phys. 1999;86:2258–2262. [Google Scholar]
- 51.Xia Y., Whitesides G.M. Soft lithography. Annu. Rev. Mater. Sci. 1998;28:153–184. [Google Scholar]
- 52.Bernard A., Renault J.P., Michel B., Bosshard H.R. Microcontact printing of proteins. Adv. Mater. 2000;12:1067–1070. [Google Scholar]
- 53.Neuert G., Albrecht C.H., Gaub H.E. Predicting the rupture probabilities of molecular bonds in series. Biophys. J. 2007;93:1215–1223. doi: 10.1529/biophysj.106.100511. [DOI] [PMC free article] [PubMed] [Google Scholar]
- 54.Rouzina I., Bloomfield V.A. Force-induced melting of the DNA double helix. 2. Effect of solution conditions. Biophys. J. 2001;80:894–900. doi: 10.1016/S0006-3495(01)76068-7. [DOI] [PMC free article] [PubMed] [Google Scholar]
- 55.White S., Baird E.E., Dervan P.B. Orientation preferences of pyrrole-imidazole polyamides in the minor groove of DNA. J. Am. Chem. Soc. 1997;119:8756–8765. doi: 10.1016/s1074-5521(97)90243-x. [DOI] [PubMed] [Google Scholar]
- 56.Hawkins C.A., de Clairac R.P., Dominey R.N., Baird E.E., White S. Controlling binding orientation in hairpin polyamide DNA complexes. J. Am. Chem. Soc. 2001;122:5235–5243. [Google Scholar]
- 57.Hsu C.F., Phillips J.W., Trauger J.W., Farkas M.E., Belitsky J.M. Completion of a programmable DNA-binding small molecule library. Tetrahedron. 2007;63:6146–6151. doi: 10.1016/j.tet.2007.03.041. [DOI] [PMC free article] [PubMed] [Google Scholar]
- 58.Halperin A., Buhot A., Zhulina E. On the hybridization isotherms of DNA microarrays: the Langmuir model and its extensions. J. Phys. Condens. Matter. 2006;18:S463–S490. [Google Scholar]
- 59.Baliga R., Baird E., Herman D., Melander C., Dervan P.B. Kinetic consequences of covalent linkage of DNA binding polyamides. Biochemistry. 2001;40:3–8. doi: 10.1021/bi0022339. [DOI] [PubMed] [Google Scholar]
- 60.Rief M., Clausen-Schaumann H., Gaub H.E. Sequence dependent mechanics of single DNA molecules. Nat. Struct. Biol. 1999;6:346–349. doi: 10.1038/7582. [DOI] [PubMed] [Google Scholar]
- 61.Lebrun A., Lavery R. Modeling extreme stretching of DNA. Nucleic Acids Res. 1996;24:2260–2267. doi: 10.1093/nar/24.12.2260. [DOI] [PMC free article] [PubMed] [Google Scholar]
- 62.Smith S.B., Cui Y.J., Bustamante C. Overstretching B-DNA: the elastic response of individual double-stranded and single-stranded DNA molecules. Science. 1996;271:795–799. doi: 10.1126/science.271.5250.795. [DOI] [PubMed] [Google Scholar]
- 63.Ho D., Falter K., Severin P., Gaub H.E. DNA as a force sensor in an aptamer-based biochip for ATP. Anal. Chem. 2009 doi: 10.1021/ac802766j. n press. [DOI] [PubMed] [Google Scholar]
- 64.Titz B., Schlesner M., Uetz P. What do we learn from high-throughput protein interaction data? Expert Rev. Proteomics. 2004;1:111–121. doi: 10.1586/14789450.1.1.111. [DOI] [PubMed] [Google Scholar]
- 65.Kitano H. Systems biology: a brief overview. Science. 2002;295:1662–1664. doi: 10.1126/science.1069492. [DOI] [PubMed] [Google Scholar]
Associated Data
This section collects any data citations, data availability statements, or supplementary materials included in this article.