

Abstract
There is increasing evidence for a major and critical involvement of lipids in signal transduction and cellular trafficking, and this has motivated large-scale studies on lipid pathways. The Lipid Metabolites and Pathways Strategy consortium is actively investigating lipid metabolism in mammalian cells and has made available time-course data on various lipids in response to treatment with KDO2-lipid A (a lipopolysaccharide analog) of macrophage RAW 264.7 cells. The lipids known as eicosanoids play an important role in inflammation. We have reconstructed an integrated network of eicosanoid metabolism and signaling based on the KEGG pathway database and the literature and have developed a kinetic model. A matrix-based approach was used to estimate the rate constants from experimental data and these were further refined using generalized constrained nonlinear optimization. The resulting model fits the experimental data well for all species, and simulated enzyme activities were similar to their literature values. The quantitative model for eicosanoid metabolism that we have developed can be used to design experimental studies utilizing genetic and pharmacological perturbations to probe fluxes in lipid pathways.
Abbreviations used: AA, arachidonic acid; FA, fatty acid; LPS, lipopolysaccharide; GPCho, phosphatidylcholine; DG, 1,2-diacylglycerol; HETE, (5Z,8Z,12E,14Z)-(11R)-hydroxyicosa-5,8,12,14-tetraenoic acid; PGD2, PGE2, PGF2α, and PGJ2, prostaglandins D2 E2 F2α and J2, respectively; dPGD2, 15-deoxy-PGD2; dPGJ2, 15-deoxy-PGJ2; COX, cyclooxygenase; PGDS, prostaglandin-D synthase; PGES, prostaglandin-E synthase; ODE, ordinary differential equation; PCR, principal-component regression
Introduction
Lipids are the main structural components of cellular membranes and facilitate compartmentalization of the cell in different organelles, e.g., mitochondria, nucleus, etc., for the efficient functioning of various processes. Traditionally, lipids are only associated with cellular roles involving energy storage and used as structural building blocks for compartments. Recent developments in lipid research have identified the important role of lipids in modulating cellular trafficking and cellular signaling. There is increasing recognition that to understand cellular processes, our current knowledge of genomics and proteomics has to be complemented with knowledge of lipids and other metabolites. Lipids have been classified into six major categories (fatty acyls, glycerolipids, glycerophospholipids, sphingolipids, sterol lipids, and prenols) (1). Each category of lipids exhibits distinct roles in various cellular processes and disease in addition to cross talk. For example, fatty acyls contribute to inflammation, rheumatoid arthritis, sepsis, and asthma; sphingolipids regulate cell proliferation, apoptosis, and cell differentiation; and sterols play a central role in atherosclerosis (2). Thus, the quantification and modeling of lipid synthesis and metabolism opens new opportunities for systems-level analysis of cellular processes and design of novel therapeutic agents.
In this article, we have focused on a class of fatty acyls, namely, the eicosanoids. For a recent review of all of the eicosanoid biosynthetic and degradative pathways, see Buczynski et al. (3). Eicosanoids are derived from AA, a 20-carbon fatty acid, and are divided into four subclasses: prostaglandins, thromboxanes, leukotrienes, and other oxidized products. Prostaglandins have been found to mediate pain, fever, and other symptoms associated with inflammation, and have been studied extensively (4,5). Prostaglandin G/H synthase (EC 1.14.99.1; COX) catalyzes the synthesis of prostaglandins from AA and has been targeted for treating inflammation, musculoskeletal pain, and other conditions (6). Even simple pharmaceutical agents including aspirin and ibuprofen, COX inhibitors, are used extensively in daily life (4). Recently, a new generation of COX-2 inhibitors, including celecoxib (Celebrex) and rofecoxib (Vioxx), were used for the treatment of osteoarthritis and acute pain conditions, but most of these have exhibited severe side effects, as evidenced from the recall of Vioxx (7). Insufficient accounting for the important interactions between different proteins and metabolites in drug discovery is one plausible explanation for such side effects. This suggests an increasingly important role of quantitative and predictive modeling in drug-discovery research.
There are only a few models of AA metabolism available in the literature (8). Furthermore, due to the lack of availability of large-scale data, the quantification of intermediate metabolites and interactions are not reliable in these models. The Lipid Metabolites and Pathways Strategy (LIPID MAPS) consortium (9) has quantified the global changes in lipid metabolites (“lipidomics”) and has developed mass spectrometry-based methods to quantitatively measure the changes in lipid metabolites in RAW 264.7 macrophage cells. Time-course data in response to the treatment of macrophages with KDO2-lipid A (an LPS analog) has been collected. This data is reported herein, and additional data is freely available online (9). The goal of the work presented here is to construct a predictive kinetic model for eicosanoid metabolism and signaling using the lipid pathways derived from the KEGG pathway database and literature, and the time-course data from LIPID MAPS. This manuscript is organized as follows. In the next section, we briefly discuss the experimental data preprocessing and present the methodology used to estimate the rate parameters. In the subsequent section, we present the results of parameters estimation and validation of the model, followed by a discussion and conclusion.
Materials and Methods
Network simplification
We have developed a detailed metabolic and signaling reaction network comprising the production and consumption of AA using the information available in the literature (10–17) and the KEGG pathways database (18) (Fig. 1 a). VANTED software was used to draw these networks (19). The detailed network contained many unmeasured metabolites. One of the steps in our matrix-based fast algorithm for parameter estimation required experimental data on all metabolites except the leaf nodes/metabolites in the network. The leaf nodes (last metabolite in each branch of the network) were exempted, because the reactions leading to the unmeasured leaf metabolites were combined with the default degradation of their precursors. The network was simplified to include only the measured metabolites by using two simple rules that are commonly used in chemical reaction kinetics, metabolic engineering, and systems biology (20). First, multistep reactions with unmeasured intermediate metabolites were lumped into a single step containing measured metabolites. For example, in the reaction A → B → C, if A and C are measured, and B is unmeasured, then the reaction has been simplified to A → C. When metabolites were involved in unmeasured branches of pathway or leaf-node metabolites, those reactions/branched pathways were lumped into generic degradation reactions. Second, the enzymes, which were not regulated by other proteins or metabolites, were eliminated from the reaction, with the assumption that their activities remain constant during such processes. When an enzyme is regulated, it is preserved in the simplified pathway along with its signaling connections. Fig. 1 b represents the simplified network map containing the essential components of lipid metabolism and signaling. In this network, PGH2, an unmeasured metabolite, has been retained because of its role as an intermediate in the generation of more than one metabolite. More discussion on treatment of PGH2 in the model is presented in the section on Kinetic modeling and parameter estimation.
Figure 1.
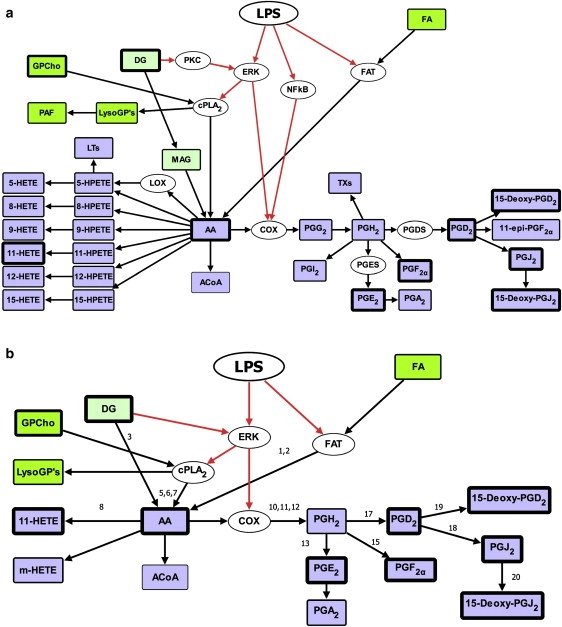
Detailed network (a) and simplified network (b) for LPS/ KDO2-lipid A stimulated eicosanoid metabolism and signaling pathway.The numbers above the arrows are reaction numbers (Table 1), and default degradation reactions are not labeled. Black lines represent lipid metabolism and gray (red in online version) indicate signaling pathways. Metabolites and enzymes are represented in rectangular boxes and ovals boxes, respectively. The measured and unmeasured metabolites are differentiated by thick and thin borders, respectively. For full names of metabolites, refer to the abbreviations list. Signaling/transporter proteins: FAT, fatty acid transporter; ERK, extracellular receptor kinase; cPLA2, cytoplasmic phospholipase A2; PKC, protein kinase C; NF-kB, nuclear factor kappa beta.
Experimental data and preprocessing
The LIPID MAPS consortium has developed a mass spectrometry-based method for measuring all the major lipids in mammalian cells after treatment with KDO2-lipid A. RAW 264.7 cells, grown in 10% serum, were used in the experiments. All metabolites were measured in pmol/μg-DNA units. To understand lipid metabolism under the normal and disease state, the experiments were performed and time-courses of lipids were measured under two conditions: (a) normal condition designated as control and (b) inflamed condition (stimulated by KDO2-lipid A). LPS activates the cyclooxygenase (COX) enzyme and inhibits the lipoxygenases (21). Thus, COX products (prostaglandins) were detected in the experiments and lipoxygenase products (leukotrienes) were undetectable. Time series comprised of eight points, at 0, 0.5, 1, 2, 4, 8, 12, and 24 h, were measured with three biological replicates consisting of three technical replicates each. The three technical replicate experiments were performed on the same day with a single batch of cells. In addition, each time course was repeated three times on different days with different batches of cells (biological replicates). For kinetic modeling purposes, outlier points were detected by a simple t-test and were excluded at each time point. The resulting data from all the replicates were averaged at each time point. Data were processed for all metabolites under treatment with KDO2-lipid A and control conditions.
Kinetic model and parameter estimation
We have developed a kinetic model of the simplified lipid network. The reaction rates were described by linear or law-of-mass-action kinetics, with the assumption that for enzymatic reactions, the substrate concentrations are much smaller as compared to the corresponding Michaelis constant, Km. For example, the following types of reaction schemes and rate expressions were used:
| Reaction | Rate expressions |
|---|---|
| A → B | k∗[A] |
| A + B → AB | k∗[A]∗[B] |
| [Enz] A → B | k∗[Enz]∗[A] |
This is similar to a scheme used in the modeling of calcium dynamics in our laboratory (22). Because of the scarcity of information on transcriptional, translational and posttranslational regulation of various enzymes, and also for simplification, enzyme regulation was modeled by formulating the rate parameter for the enzyme as a linear function of its regulatory molecules. For example, COX has two isoforms, COX-1 and COX-2. COX-1 is constitutive and COX-2 is an inducible enzyme. The activity of COX-2 is modified by DG and LPS. This effect was functionally captured through the reactions
| for inducible activity of COX-2 because of DG | ||
| for inducible activity of COX-2 because of LPS | ||
| for constitutive activity of COX-1 and COX-2 |
The effective rate constant for COX was obtained as a linear function of DG and LPS (k10∗[DG] + k11∗[LPS] + k12). The flux expressions obtained from this scheme were linear in rate parameters and nonlinear in metabolite concentrations. The matrix-based approach to estimate the rate constants is described below in terms of the reaction numbers labeled in Fig. 1 b and listed in Table 1. This approach is an extension of a previous approach used for rate-parameter estimation for metabolic reactions using steady-state data (23). Equation 1 describes the rate of change of [PGH2] and [PGD2].
| (1) |
where the rate constants, ki (i = 10, 11, 12, 13, 15, 17, 18, 19), are as defined in Table 1.
Table 1.
The estimated parameter values for eicosanoids model
| No. | Reactions | Parameter Names | Values |
|---|---|---|---|
| 1 | [LPS] FA → AA | k1 | 355.637 |
| 2 | FA→ AA | k2 | 10−15 |
| 3 | DG → AA | k3 | 10−15 |
| 4 | AA → | k4 | 10−15 |
| 5 | [DG] GPCho → AA | k5 | 10−15 |
| 6 | [LPS] GPCho → AA | k6 | 0.330 |
| 7 | GPCho → AA | k7 | 10−15 |
| 8 | AA → HETE | k8 | 0.007 |
| 9 | HETE → | k9 | 0.187 |
| 10 | [DG] AA → PGH2 | k10 | 0.024 |
| 11 | [LPS] AA → PGH2 | k11 | 0.111 |
| 12 | AA → PGH2 | k12 | 0.098 |
| 13 | PGH2 → PGE2 | k13 | 0.204 |
| 14 | PGE2 → | k14 | 10−15 |
| 15 | PGH2 → PGF2a | k15 | 0.061 |
| 16 | PGF2a → | k16 | 10−15 |
| 17 | PGH2 → PGD2 | k17 | 3.116 |
| 18 | PGD2 → PGJ2 | k18 | 0.054 |
| 19 | PGD2 → dPGD2 | k19 | 0.029 |
| 20 | dPGD2 → | k20 | 0.014 |
| 21 | PGJ2 → dPGJ2 | k21 | 0.034 |
| 22 | dPGJ2 → | k22 | 0.116 |
“[DG]” and “[LPS]” indicate the effects of signaling (molecules) in the reaction. X → represents the default degradation of metabolite X. The unit of first-order reaction is 1/h. The unit of second-order reaction is 1/h when it involves either FA or LPS as one of the metabolites, as we have used scaled profiles for these variables. The unit of second-order reaction is μg DNA/(ratio int ∗ h) when it involves DG as one of the metabolites.
If the metabolite concentrations are known and the rate parameters are unknown, then the ODEs can be rearranged in a matrix format as shown in Eq. 2.
| (2) |
The coefficients in the matrix X are linear/nonlinear functions of metabolite concentrations. All the equations used in the simulation are listed in an Appendix. Experimental data were available for all metabolites except PGH2 in the simplified network. To be able to use this matrix-based approach, a time-course profile was assumed for the PGH2 for this step. The shape for PGH2 was assumed based on the average shape of AA and PGD2, with a maximum concentration of 25 pmol/μg DNA. A low concentration was assumed based upon its unstable nature and the value reported in the literature (24). With the assumed PGH2 profile, X is completely defined. The lefthand side of the equations (matrix Y) was computed using discretization and the experimental data (Eq. 3).
| (3) |
To compute the unknown parameter vector (b), matrix X was required to contain only known entries, justifying the retention of only measured metabolites in the simplified network.
Equation 2 contains known matrices X and Y, and the only unknown in this equation is the rate-constant vector, b, which can be computed as (the least-squares solution, which is the fastest method). However, XTX can be singular in many practical applications. Another problem is that the estimated values in matrix b may contain negative values, which are not viable for biological systems. The problem of singularity can be eliminated using principal-component regression (PCR) (25), but PCR does not prevent the negative solutions. Hence, we used the constrained least-squares approach (MATLAB (The MathWorks, Natick MA) function lsqlin), which optimized the solution with objective function (Eq. 4), with additional constraints that all parameter values have to be positive.
| (4) |
The above method minimized the fit error (Eq. 4) between the experimental slope (d/dt computed using experimental data) and the predicted slope (d/dt computed using predictions) instead of between the experimental and predicted data. Hence, the resulting parameters did not fit the experimental data well. However, they serve as good initial values for the parameter estimation. The estimated values of the parameters were further refined by using generalized constrained nonlinear optimization (MATLAB function fmincon), where the objective (Eq. 5) was to minimize the weighted fit error between the experimental and predicted metabolite concentrations and their slopes (time derivative), except in the case of PGH2. The maximum concentration of PGH2 was optimized at ∼25 pmol/μg DNA to maintain its low concentration in the simulation (24). The positivity of parameters was imposed by constraining the lower limit of parameters to a small number (10−15). The algorithm of fmincon does not require a matrix form. Thus, numerical integration was used (e.g., MATLAB function ode23) to simulate the system to circumvent the discretization problems. The combined use of lsqlin and fmincon made the overall process computationally efficient. The objective function for use with fmincon was
| (5) |
where nt is the number of time points and nsp is the number of species. The first term represents the fit error between the experimental and predicted concentrations, and the second term represents the fit error between their experimental and predicted derivatives. Different weights (wi) can be assigned to these two terms to improve the fit. For this study, w1 and w2 are set to 1 and 0, respectively.
The initial concentrations of the metabolites were also optimized in a narrow range around the experimental values. When data were available for more than one condition, all the data were used to compute the fit error by simulating the model several times individually and minimizing the objective function collectively. We also observed that when arbitrary initial guesses were used, fmincon was either diverging or converging to erroneous solutions. Thus, the matrix approach (lsqlin) was very useful for providing an initial guess for the parameter-estimation.
Results
Good fit to experimental data
ODEs were generated for all metabolites in the network, and effective rate constants were estimated for the simplified eicosanoid reaction network using the approach described in Materials and Methods. The simplified model is a reliable predictive model, as evidenced by the good fit to experimental data. Table 1 lists the reactions and the corresponding estimated reaction-rate parameters included in the model. The large variation in experimental “control” data, especially for glycerolipids, glycerophospholipids, and sphingolipids (9), indicated the non-steady-state condition in control experiments. The assumption of steady state was circumvented by including (fitting) data obtained in two experimental scenarios during parameter estimation, one in which cells were treated with KDO2-lipid A and a corresponding control data set.
The wide range of metabolite concentrations also created a problem in optimization of the parameters. The maximum concentration of metabolites varied between 8 pmol/μg DNA (for HETE) and 400 pmol/μg DNA (for AA). Due to the two orders of magnitude difference in metabolite concentrations, the metabolites with higher concentrations contributed more to the objective function (fit error) (Eq. 5) than did those with lower concentration. This resulted in a relatively poor fit for the metabolites with lower concentrations. To resolve this issue, the errors between experimental values and predicted values for each metabolite were calculated and scaled/normalized by its maximum experimental value. Then, the sum of squares of the normalized fit error on all metabolites was minimized. This scaling essentially normalized the maximum experimental concentrations to 1 for all metabolites and resulted in approximately equal weight for all metabolites. It should be noted that integration was still performed in absolute concentration values for all metabolites. Further, the data were measured at irregular time intervals (longer intervals at later times). This led to relatively poor fit at later time points. To resolve this issue, the pointwise error was scaled by the square root of the length of the time interval.
Fig. 2 shows the simulation results (27). For most time points, the difference between the predicted and experimental data was within the standard error of the mean (Fig. 2). The good fit was obtained for all metabolites under both conditions (treatment and control). The only difference between the treatment and control scenarios was the presence and absence of KDO2-lipid A. To capture this scenario in the simulation, nonzero and zero KDO2-lipid A profiles were used for the treatment and control sets, respectively. Good fit to control data is also significant from both the biological function and the mathematical analysis point of view. The control scenario provided a condition similar to steady state at time 0 h and constrained the optimized solution such that the fit to treatment data captures only the effect of treatment. Thus, good fit to both the datasets suggested that the topology of the simplified network was correct and captured the important metabolic and signaling effects.
Figure 2.

Simulation of kinetic modeling of the simplified lipid network: fit of the predicted response (control and treatment with KDO2-lipid A) to the corresponding experimental data for RAW 264.7 cells. Ctrl, control set; Trt, KDO2-lipid A treatment set. The error bars shown for the experimental data represent the standard error of mean.
We assumed constant fatty acid concentration ([FA] =1) in the media. The assumption of a constant fatty acid profile is reasonable, since the total amount of eicosanoids is much smaller compared to the total amount of fatty acid in the media. Thus, the production of eicosanoids should not affect the concentration of fatty acid in the media. Its uptake was constitutive and also induced by LPS. The timescale of KDO2-lipid A signaling for the activation of eicosanoid pathways and fatty acid transport is largely unknown, as the dynamics of the activation of Toll-like receptor 4 is complex. We have manually optimized the time course of LPS to get a good fit. Upon treatment, the effective level of KDO2-lipid A (or the activity of Toll-like receptor 4) increased from 0 to 1 during the first half-hour and then decreased back to 0 in the next 1.5 h. The rate constant k1 is large compared to other rate constants (Table 1). This is because we have used scaled and dimensionless values for LPS and FA, in contrast to our use of pmol/μg DNA for other metabolites.
Validation: the leave-one-out approach
We have also validated our model by excluding from objective function minimization the data on one of the intermediate metabolites. The rate parameters were estimated, and the predictions were compared with the experimental data. The values of the parameters thus obtained were approximately similar to the values in the previous simulation/optimization (listed in Table 1), except for the AA degradation constant. In the previous simulation, the profile of PGH2 was unknown and its maximum concentration was optimized and constrained at ∼25 pmol/μg DNA, but during the validation, we used this profile of PGH2 in the optimization. There are two intermediate metabolites present in the network: PGD2 and PGJ2. The validation was performed on both of these metabolites, and satisfactory results were obtained. The results of validation by excluding PGD2 (the fitted response for other metabolites during optimization and the predicted response of PGD2 using the resulting parameter values) are shown in Fig. 3. Simulation results are not shown for validation by exclusion of PGJ2. There is a slight deterioration in the quantitative fit, but the qualitative shape of the predicted time course is in good agreement with the experimental time course.
Figure 3.

Validation of the eicosanoid network with leave-one-out intermediate metabolite: PGD2 was omitted from the objective function used in optimization. The solution obtained using this method fits the experimental data for PGD2 reasonably well. The error bars shown for the experimental data are standard-error of mean.
Parametric sensitivity and timescale analysis
Parametric sensitivity
Parametric sensitivity analysis was performed by varying each parameter (one at a time) by twofold up and down from its original (optimized) value. The sensitivity of each metabolite was studied by plotting the fold change in its maximum concentration, as compared to the maximum concentration corresponding to the original value of the parameter, versus the ratio change in the value of the perturbed parameter (Fig. 4). The numerical values of the sensitivity, i.e., the slope of the plot at the optimized value of the parameter, are listed in Table S1 of the Supporting Material. For each parameter and each metabolite, monotonic increase, decrease, or no change was observed, depending upon the respective locations of the parameter and the metabolite chosen in the network. The change in the parameters belonging to the upper part of the network produced a larger change in almost all metabolites as compared to the change in the parameters belonging to the lower part of the network. For example, the change in parameter k1 ([LPS] FA → AA) (Fig. S1) produced an increase in all metabolites (sensitivity ∼ 0.8); the change in k17 (PGH2 → PGD2) produced changes in all metabolites downstream of PGH2. Although PGH2, PGE2, and PGF2α decreased (sensitivity ∼ −0.9), PGD2, PGJ2, dPGD2, and dPGJ2 increased (sensitivity ∼ 0.1), but no significant change was observed for AA and HETE (Fig. 4 and Table S1). Sensitivities are consistent with the structure of the biochemical reaction network (Fig. 1 b). A change in k17 has a direct impact on the peak height of PGH2. Because PGE2 and PGF2α are immediately downstream of PGH2, they are affected to the same degree as PGH2 (Fig. 4). In comparison, the peak height of PGD2 is affected to a much lesser degree, because the influx to PGD2 is k17∗[PGH2]. When k17 increases, [PGH2] decreases, so the net effect on k17∗[PGH2] is much smaller. PGJ2, dPGD2 and dPGJ2 are downstream of PGD2 and are affected to the same degree as PGD2. Small to moderate sensitivities (Table S1) suggest that the biochemical system is robust with respect to parametric perturbations.
Figure 4.

Result of parametric sensitivity analysis for parameter k17 (PGH2 → PGD2). The x axis indicates the ratio of the perturbed to the original (optimized) value of the parameter, and the y axis indicates the fold change in the maximum value of state variables (metabolites).
Timescale
Timescale characterization is important in understanding the metabolite dynamics and its response time. The analysis was performed by computing eigenvalues and eigenvectors of the Jacobian matrix of ordinary differential equations at steady-state conditions. The steady-state was identified by simulating the system corresponding to the control condition (no stimulus) for a long time (t =1000 h). The Jacobian was computed through numerical differentiation of the expressions on the righthand sides of the ODEs with respect to the state variables. The eigenvalues are split into three broad ranges. For each eigenvalue, the metabolites with substantial contribution to the corresponding eigenvector were identified. Depending upon the eigenvalues and metabolites significantly contributing to the corresponding eigenvectors, these metabolites have been divided into the three categories listed in Table 2. When a metabolite contributed significantly in two or more eigenvectors spanning two different eigenvalue ranges, it was assigned to the smaller eigenvalue range, because the fast time manifold only determines its initial transients and the slow manifold governs the later response leading to steady state. Similar results could be gleaned by inspecting the time course of the metabolites, but the eigenvalue-decomposition-based characterization is more rigorous and contributes to a better understanding of the temporal evolution in a systemic context. Medium-timescale metabolites go up and return to basal levels within 24 h; however, slow-timescale metabolites show monotonic increases up to 24 h (Fig. 2). As discussed in the Results section, PGH2 is unstable and maintains its low concentration inside the cell. Thus, its fast timescale is a resultant of its low concentration, its involvement in a high rate of production from AA, and its fast conversion into PGD2.
Table 2.
Results of eigenvalue based timescale analysis of metabolites
| Fast (∼1 h) | Medium (∼10 h) | Slow (∼50 h) |
|---|---|---|
| PGH2 | AA | PGE2 |
| PGD2 | PGF2α | |
| HETE | PGJ2 | |
| dPGD2 | ||
| dPGJ2 |
Discussion
The metabolism of AA in macrophages has been the subject of long-standing investigations because of its involvement in inflammation and the immune system response. Earlier experiments focused on a specific metabolite or enzyme in the network. LIPID MAPS performed experiments to measure a large number of metabolites, proteins, and genes using high-throughput techniques under identical conditions. This data is valuable for studying interactions between different lipid metabolites, proteins, and genes. To validate the LIPID MAPS data, we have compared the LPS-induced time-course profile with those in the existing literature for various metabolites. The time courses for AA, PGD2, PGE2, PGF2α, and dPGD2 were collected from the literature (28–32) and found to be qualitatively similar to the LIPID MAPS data and model simulations.
Multiple sources of AA and lumped nature of the rate parameters for the upstream part of the network
Lipid metabolism and signaling are complex processes and the mechanisms involved are only partially known. The quantitative contribution of various potential sources of AA production is not clearly known. Theoretically, AA can be produced from glycerophospholipids such as GPCho or glycerolipids such as DG and can also get transported from/to the extracellular media, perhaps through CoASH pools. We have accounted for all three sources of the AA production. The timescales/response times of the three sources are largely unknown, and hence, we cannot distinguish among them. Further, no information is available about fluxes of conversion of AA into PGH2, acyl coenzyme A, and HETE (Fig. 1 b). Consequently, we have manually optimized the profile of LPS to get the best fit. Thus, we have less confidence in the quantitative values of parameters for AA production from the three sources than for those of parameters for conversion of AA into prostaglandins. This is why we chose COX, PGDS, and PGES activities to compare against their literature values instead of the enzymes involved in AA production. If experimental data related to acylation of AA becomes available in the future, its utilization will result in the readjustment of unknown parameters related to the production of AA and its acylation. The parameters of prostaglandin pathways will not be affected significantly. Hence, this model is reliable.
Rate parameters for the enzymes
We compared the effective rate constant for the enzymes COX, PGDS (EC 5.3.99.2), and PGES (EC 5.3.99.3) with the corresponding values reported in the literature (33–36). Since the concentrations in LIPID MAPS experimental data and literature values were reported in units of pmol/μg DNA and μmol/min/mg of enzyme-enriched protein, respectively, we used appropriate conversion factors, assuming the cell diameter to be 10 μm and other relevant information about the average cell density, percentage protein content, and total percentages of RNA and mRNA per cell. For the amount of COX protein per cell, we used COX mRNA/total RNA data from Chan et al. (37) and assumed that this ratio is the same at the protein level. The values reported in the literature were based on in vitro measurements with partially purified protein. Thus, we assumed that the literature values represented basal activity and compared these activities (flux through the enzyme) with predicted activities of these enzymes in the “control” simulation. Our computed value for COX (10−13 μmol/min/cell) is within one order of magnitude of the reported value (10−14 μmol/min/cell) (37). This discrepancy in the COX parameter value can be attributed to many factors, e.g., experimental conditions, modeling approximations, differences between the cell types used in these experiments, etc. For PGDS and PGES, we used reverse transcriptase PCR data from references (38,39) to compare with the COX amount and calculated its activities. A comparison between the simulated and experimental values for all three enzymes is shown in Table 3.
Table 3.
Comparison of computed enzyme activities with the corresponding literature values
| Enzyme | EC No. | Literature values (μmol/min/mg protein) | Literature values (μmol/min/cell) | Computed/optimized values in our model (μmol/min/cell) |
|---|---|---|---|---|
| COX | 1.14.99.1 | 3.96 | 10−14 | 10−13 |
| PGDS | 5.3.99.2 | 1.7 | 10−14 | 10−14 |
| PGES | 5.3.99.3 | 2 | 10−15 | 10−15 |
Conclusions
Systems biology approaches have contributed to our understanding of the gene, protein, and metabolic networks and are proving to be beneficial for pathway-based drug discovery. In this study, we used a supervised approach to integrate legacy information on the lipid pathways with novel experimental data to develop a simple kinetic model of the eicosanoid metabolic pathway. Signaling and metabolic pathways were reconstructed from KEGG and the existing literature. Based upon the network map reconstructed, we developed an ODE-based mathematical model. A two-step approach was used for parameter estimation. In the first step, a matrix-based approach provided an initial guess. The parameter values were further refined in the second step. This approach makes the overall process computationally efficient. It can be noted that to utilize the matrix-based fast approach, nonsaturation linear kinetics were used. To estimate the parameters more accurately, Michaelis-Menten kinetics can be used for enzymatic reactions. The resulting model fit the experimental data well for all species and demonstrated that the integrated metabolic and signaling network and the experimental data are consistent with each other. The robustness of the network structure and model parameters was also validated through leave-one-out type experiments and parametric sensitivity analysis. The fluxes through COX, PGDS, and PGES, obtained from the simulation, were consistent with their literature values.
Acknowledgments
We acknowledge Dr. Andreia Maer (GHC Technologies, La Jolla, CA) for the initial draft map of the overall lipid network and Raymond Deems (University of California, San Diego) for critically reading and giving advice on the data contained in this manuscript.
This research was supported by the National Institutes of Health collaborative grant U54 GM69338-04 LIPID MAPS (Lipid Metabolites And Pathways Strategy) (to E.A.D. and S.S.). S.S. conceived the modeling study. S.G. performed the computational analysis and wrote the manuscript. M.R.M. provided assistance on the mathematical analysis and was responsible for critical review and editing of the manuscript. Experiments were carried out by D.L.S. E.A.D. and S.S. supervised the experimental and theoretical studies, respectively. All authors have read and approved the final manuscript.
Appendix
The flux expressions for the reactions shown in Fig. 1 b are
| v1 = k1[PIP2][LPS] | v2 = k2[PIP2] | v3 = k3[DG] |
| v4 = k4[AA] | v5 = k5[GPCho][DG] | v6 = k6[GPCho][LPS] |
| v7 = k7[GPCho] | v8 = k8[AA] | v9 = k9[HETE] |
| v10 = k10[AA][DG] | v11 = k11[AA][LPS] | v12 = k12[AA] |
| v13 = k13[PGH2] | v14 = k14[PGE2] | v15 = k15[PGH2] |
| v16 = k16[PGF2α] | v17 = k17[PGH2] | v18 = k18[PGD2] |
| v19 = k19[PGD2] | v20 = k20[dPGD2] | v21 = k21[PGJ2] |
| v22 = k22[dPGJ2]. |
The differential equations describing the rate of change of metabolite concentrations are
| d[AA]/dt | = v1 + v2 + v3 − v4 + v5 + v6 + v7 − v8 − v10 − v11 − v12 |
| d[HETE]/dt | = v8 − v9 |
| d[PGH2]/dt | = v10 + v11 + v12 − v13 − v15 − v17 |
| d[PGE2]/dt | = v13 − v14 |
| d[PGF2α]/dt | = v15 − v16 |
| d[PGD2]/dt | = v17 − v18 − v19 |
| d[PGJ2]/dt | = v18 − v21 |
| d[dPGD2]/dt | = v19 − v20 |
| d[dPGJ2]/dt | = v21 − v22. |
Supporting Material
References
- 1.Fahy E., Subramaniam S., Brown H.A., Glass C.K., Merrill A.H., Jr. A comprehensive classification system for lipids. J. Lipid Res. 2005;46:839–862. doi: 10.1194/jlr.E400004-JLR200. [DOI] [PubMed] [Google Scholar]
- 2.Wymann M.P., Schneiter R. Lipid signalling in disease. Nat. Rev. Mol. Cell Biol. 2008;9:162–176. doi: 10.1038/nrm2335. [DOI] [PubMed] [Google Scholar]
- 3.Buczynski M.W., Dumlao D.S., Dennis E.A. An integrated omics analysis of eicosanoid biology. J. Lipid Res. 2009 doi: 10.1194/jlr.R900004-JLR200. Epub ahead of print. [DOI] [PMC free article] [PubMed] [Google Scholar]
- 4.Funk C.D. Prostaglandins and leukotrienes: advances in eicosanoid biology. Science. 2001;294:1871–1875. doi: 10.1126/science.294.5548.1871. [DOI] [PubMed] [Google Scholar]
- 5.Simmons D.L., Botting R.M., Hla T. Cyclooxygenase isozymes: the biology of prostaglandin synthesis and inhibition. Pharmacol. Rev. 2004;56:387–437. doi: 10.1124/pr.56.3.3. [DOI] [PubMed] [Google Scholar]
- 6.Wang D., Miller S.C., Kopecek J. Targeted drug delivery for musculoskeletal diseases. Adv. Drug Deliv. Rev. 2005;57:935–937. doi: 10.1016/j.addr.2004.12.012. [DOI] [PubMed] [Google Scholar]
- 7.Couzin J. Drug safety. Withdrawal of Vioxx casts a shadow over COX-2 inhibitors. Science. 2004;306:384–385. doi: 10.1126/science.306.5695.384. [DOI] [PubMed] [Google Scholar]
- 8.Yang K., Ma W., Liang H., Ouyang Q., Tang C. Dynamic simulations on the arachidonic acid metabolic network. PLOS Comput. Biol. 2007;3:e55. doi: 10.1371/journal.pcbi.0030055. [DOI] [PMC free article] [PubMed] [Google Scholar]
- 9.LIPID Metabolites And Pathways Strategy, (LIPID MAPS). http://www.lipidmaps.org. Accessed Mar. 16, 2009.
- 10.Gijon M.A., Leslie C.C. Regulation of arachidonic acid release and cytosolic phospholipase A2 activation. J. Leukoc. Biol. 1999;65:330–336. doi: 10.1002/jlb.65.3.330. [DOI] [PubMed] [Google Scholar]
- 11.Monick M.M., Carter A.B., Flaherty D.M., Peterson M.W., Hunninghake G.W. Protein kinase C ζ plays a central role in activation of the p42/44 mitogen-activated protein kinase by endotoxin in alveolar macrophages. J. Immunol. 2000;165:4632–4639. doi: 10.4049/jimmunol.165.8.4632. [DOI] [PubMed] [Google Scholar]
- 12.Pettus B.J., Kitatani K., Chalfant C.E., Taha T.A., Kawamori T. The coordination of prostaglandin E2 oroduction by sphingosine-1-phosphate and ceramide-1-phosphate. Mol. Pharmacol. 2005;68:330–335. doi: 10.1124/mol.104.008722. [DOI] [PubMed] [Google Scholar]
- 13.Hwang D. Modulation of the expression of cyclooxygenase-2 by fatty acids mediated through toll-like receptor 4-derived signaling pathways. FASEB J. 2001;15:2556–2564. doi: 10.1096/fj.01-0432com. [DOI] [PubMed] [Google Scholar]
- 14.Rao K.M.K. MAP kinase activation in macrophages. J. Leukoc. Biol. 2001;69:3–10. [PubMed] [Google Scholar]
- 15.Qi H.-Y., Shelhamer J.H. Toll-like receptor 4 signaling regulates cytosolic phospholipase A2 activation and lipid generation in lipopolysaccharide-stimulated macrophages. J. Biol. Chem. 2005;280:38969–38975. doi: 10.1074/jbc.M509352200. [DOI] [PubMed] [Google Scholar]
- 16.Raetz C.R.H., Garrett T.A., Reynolds C.M., Shaw W.A., Moore J.D. Kdo2-lipid A of Escherichia coli, a defined endotoxin that activates macrophages via TLR-4. J. Lipid Res. 2006;47:1097–1111. doi: 10.1194/jlr.M600027-JLR200. [DOI] [PubMed] [Google Scholar]
- 17.Eliopoulos A.G., Dumitru C.D., Wang C.C., Cho J.H., Tsichlis P.N. Induction of COX-2 by LPS in macrophages is regulated by Tpl2-dependent CREB activation signals. EMBO J. 2002;21:4831–4840. doi: 10.1093/emboj/cdf478. [DOI] [PMC free article] [PubMed] [Google Scholar]
- 18.Kyoto Encyclopedia of Genes and Genomes (KEGG). http://www.genome.ad.jp/kegg/. [Mar. 16, 2009]. [DOI] [PMC free article] [PubMed]
- 19.Junker B.H., Klukas C., Schreiber F. VANTED: A system for advanced data analysis and visualization in the context of biological networks. BMC Bioinformatics. 2006;7:109. doi: 10.1186/1471-2105-7-109. [DOI] [PMC free article] [PubMed] [Google Scholar]
- 20.Stephanopoulos G., Aristidou A., Nielsen J. Academic Press; San Diego: 1998. Metabolic Engineering: Principles and Methodologies. [Google Scholar]
- 21.Buczynski M.W., Stephens D.L., Bowers-Gentry R.C., Grkovich A., Deems R.A. TLR-4 and sustained calcium agonists synergistically produce eicosanoids independent of protein synthesis in RAW264.7 cells. J. Biol. Chem. 2007;282:22834–22847. doi: 10.1074/jbc.M701831200. [DOI] [PubMed] [Google Scholar]
- 22.Maurya M.R., Subramaniam S. A kinetic model for calcium dynamics in RAW 264.7 cells: 1. Mechanisms, parameters, and subpopulational variability. Biophys. J. 2007;93:709–728. doi: 10.1529/biophysj.106.097469. [DOI] [PMC free article] [PubMed] [Google Scholar]
- 23.Famili I., Mahadevan R., Palsson B.O. k-Cone analysis: determining all candidate values for kinetic parameters on a network scale. Biophys. J. 2005;88:1616–1625. doi: 10.1529/biophysj.104.050385. [DOI] [PMC free article] [PubMed] [Google Scholar]
- 24.Hamberg M., Svensson J., Samuelsson B. Prostaglandin endoperoxides. A new concept concerning the mode of action and release of prostaglandins. Proc. Natl. Acad. Sci. USA. 1974;71:3824–3828. doi: 10.1073/pnas.71.10.3824. [DOI] [PMC free article] [PubMed] [Google Scholar]
- 25.Pradervand S., Maurya M.R., Subramaniam S. Identification of signaling components required for the prediction of cytokine release in RAW 264.7 macrophages. Genome Biol. 2006;7:R11. doi: 10.1186/gb-2006-7-2-r11. [DOI] [PMC free article] [PubMed] [Google Scholar]
- 26.Reference deleted in proof.
- 27.Gupta, S., M. R. Maurya, A. Maer, and S. Subramaniam. 2007. Integrated modeling of lipids metabolism and signaling pathways. AIChE Annu. Mtg., Presentation No. 242g Salt Lake City, UT.
- 28.Naraba H., Murakami M., Matsumoto H., Shimbara S., Ueno A. Segregated coupling of phospholipases A2, cyclooxygenases, and terminal prostanoid synthases in different phases of prostanoid biosynthesis in rat peritoneal macrophages. J. Immunol. 1998;160:2974–2982. [PubMed] [Google Scholar]
- 29.Glaser K.B., Asmis R., Dennis E.A. Bacterial lipopolysaccharide priming of P388D1 macrophage-like cells for enhanced arachidonic acid metabolism. Platelet-activating factor receptor activation and regulation of phospholipase A2. J. Biol. Chem. 1990;265:8658–8664. [PubMed] [Google Scholar]
- 30.Vunta H., Davis F., Palempalli U.D., Bhat D., Arner R.J. The anti-inflammatory effects of selenium are mediated through 15-deoxy-δ12,14-prostaglandin J2 in macrophages. J. Biol. Chem. 2007;282:17964–17973. doi: 10.1074/jbc.M703075200. [DOI] [PubMed] [Google Scholar]
- 31.Rouzer C.A., Jacobs A.T., Nirodi C.S., Kingsley P.J., Morrow J.D. RAW264.7 cells lack prostaglandin-dependent autoregulation of tumor necrosis factor-α secretion. J. Lipid Res. 2005;46:1027–1037. doi: 10.1194/jlr.M500006-JLR200. [DOI] [PubMed] [Google Scholar]
- 32.Lysz T.W., Needleman P., Ferrendelli J.A. Measurement of prostaglandin biosynthetic capacity in discrete areas of the rabbit hippocampal formation. J. Neurosci. Res. 1983;10:317–326. doi: 10.1002/jnr.490100310. [DOI] [PubMed] [Google Scholar]
- 33.Roth G.J., Siok C.J., Ozols J. Structural characteristics of prostaglandin synthetase from sheep vesicular gland. J. Biol. Chem. 1980;255:1301–1304. [PubMed] [Google Scholar]
- 34.Schomburg I., Chang A., Ebeling C., Gremse M., Heldt C. BRENDA, the enzyme database: updates and major new developments. Nucleic Acids Res. 2004;32:D431–D433. doi: 10.1093/nar/gkh081. [DOI] [PMC free article] [PubMed] [Google Scholar]
- 35.Shimizu T., Yamamoto S., Hayaishi O. Purification and properties of prostaglandin D synthetase from rat brain. J. Biol. Chem. 1979;254:5222–5228. [PubMed] [Google Scholar]
- 36.Tanioka T., Nakatani Y., Semmyo N., Murakami M., Kudo I. Molecular identification of cytosolic prostaglandin E2 synthase that is functionally coupled with cyclooxygenase-1 in immediate prostaglandin E2 biosynthesis. J. Biol. Chem. 2000;275:32775–32782. doi: 10.1074/jbc.M003504200. [DOI] [PubMed] [Google Scholar]
- 37.Chan G., Boyle J.O., Yang E.K., Zhang F., Sacks P.G. Cyclooxygenase-2 expression is up-regulated in squamous cell carcinoma of the head and neck. Cancer Res. 1999;59:991–994. [PubMed] [Google Scholar]
- 38.Schade S., Bezugla Y., Kolada A., Kamionka S., Scheibe R. Diverse functional coupling of cyclooxygenase 1 and 2 with final prostanoid synthases in liver macrophages. Biochem. Pharmacol. 2002;64:1227–1232. doi: 10.1016/s0006-2952(02)01290-x. [DOI] [PubMed] [Google Scholar]
- 39.Sun L.K., Wahl P., Bilic G., Wuthrich R.P. CD44-mediated cyclooxygenase-2 expression and thromboxane A2 production in RAW 264.7 macrophages. Inflamm. Res. 2001;50:496–499. doi: 10.1007/PL00000224. [DOI] [PubMed] [Google Scholar]
Associated Data
This section collects any data citations, data availability statements, or supplementary materials included in this article.