

Abstract
The efficiency of many cell-surface receptors is dependent on the rate of binding soluble or surface-attached ligands. Much effort was exerted to measure association rates between soluble molecules (three-dimensional kon) and, more recently, between surface-attached molecules (two-dimensional [2D] kon). According to a generally accepted assumption, the probability of bond formation between receptors and ligands is proportional to the first power of encounter duration. Here we provide new experimental evidence and review published data demonstrating that this simple assumption is not always warranted. Using as a model system the (2D) interaction between ICAM-1-coated surfaces and flowing microspheres coated with specific anti-ICAM-1 antibodies, we show that the probability of bond formation may scale as a power of encounter duration that is significantly higher than 1. Further, we show that experimental data may be accounted for by modeling ligand-receptor interaction as a displacement along a single path of a rough energy landscape. Under a wide range of conditions, the probability that an encounter of duration t resulted in bond formation varied as erfc[(t0/t)1/2], where t0 was on the order of 10 ms. We conclude that the minimum contact time for bond formation may be a useful parameter to describe a ligand-receptor interaction, in addition to conventional association rates.
Introduction
The main function of proteins may be to bind to other biomolecules (1). In several situations such as antigen binding by antibodies (2), selectin-mediated tethering of leukocytes to vessel walls at the onset of inflammation (3,4), or integrin activation (5,6), receptor efficiency is highly dependent on association rate. Measuring this parameter is thus considered an important issue (7). Recently, several authors measured the rate of association between receptors and ligands in solution (8,9). Moreover, different techniques involving atomic-force microscopy (10), fluorescence measurements (11), flow chambers (12), or micropipettes (13,14) yielded quantitative information on association rates between surface-bound molecules. It is now well-recognized that relating association rates measured in solution (i.e., three-dimensional [3D] conditions) to the behavior of membrane-bound receptors (i.e., two-dimensional [2D] reactions) is difficult (7,15). However, all experiments rely on the assumption that it is possible to define an association-rate parameter, kon, such that the probability of bond formation between a ligand and a receptor maintained at binding distance during a sufficiently short time interval of duration t is proportional to t. Here, we assert that this assumption may not be warranted in all experimental situations. In other words, kon cannot be used to predict bond formation under all conditions. First, we present experimental data supporting the view that the probability of ligand-receptor association may be proportional to a power of contact time higher than 1. We argue that the problems related to the use of association rate go fairly unnoticed because 1), encounter times between soluble molecules are set by diffusion rules and are therefore similar in all experiments; and 2), for practical reasons, binding experiments performed between surface-attached molecules at the single-bond level cannot be performed over a wide range of contact times. Second, we show that our findings are consistent with current theories of reaction rates. Third, we show that our experimental data are accounted for by a simple kinetic model, based on a single parameter t0 representing the minimum time required for bond formation. The probability of bond formation after a contact of duration t was erfc[(t0/t)1/2], and t0 was close to 10 ms.
Materials and Methods
Particles and surfaces
Tosylated microspheres of 4.5-μm diameter and 1500-kg/m3 density (Dynabeads M450, Dynal France, Compiègne, France) were coated with rat anti-murine immunoglobulin Fc (Serotec, Cergy St-Christophe, France), and then with mouse IgG1 anti-human ICAM-1 (clone HA58, Ebiosciences, San Diego, CA) or control isotype (16). The surface density was estimated at 300 antibody molecules/μm2 according to flow cytometry and previously described calibration procedures (17).
Glass coverslips were covered with 200 μL of human Fc-ICAM-1 chimera (R&D Systems France, Lille, France), at a concentration ranging between 0.005–0.02 μg/mL, as previously described (16). The surface density of the ICAM-1 group was estimated at between 1–4 molecules/μm2. Coverslips were then incubated with 10 μg/mL bovine serum albumin in phosphate-buffered saline to reduce nonspecific interactions. The total length of ligand and receptor molecules was estimated at 76 nm, with 4 nm approximating the length of an immunoglobulin domain (18).
The average distance d between a microsphere and the chamber floor was estimated using Boltzmann's law (15), yielding d = kBT/[(4πa3/3)(ρ − ρ0)g], where kB is Boltzmann's constant, T is the absolute temperature, a is the sphere radius, ρ and ρ0 are the sphere and medium densities, and g is 9.81 ms−2. The obtained estimate was 18 nm.
Flow-chamber and motion analysis
We used published methods (19,20) in our flow-chamber and motion analysis. Microspheres were driven in a flow chamber (6 × 20 × 0.1 mm3) on an inverted microscope with a 20× objective. Images were acquired with a video camera (Sony France, Clichy, France), and then digitized and DivX-compressed with a WIN-TV digitizer (WIN-TV, Hauppauge, France). The pixel size was (0.5 μm)2. The centroid of microspheres was determined using a custom-made tracking program, and trajectories were recorded with a time and space resolution of 20 ms and ∼40 nm, respectively.
A particle was defined as arrested when it moved by less than 500 nm during a time interval of 200 ms. In total, 94 independent experiments were performed, allowing us to record ∼200 binding events, corresponding to between 25,000–140,000 positions, for each condition (i.e., shear rate and surface density of ICAM-1). The apparent duration of each arrest was corrected as previously explained (19,20), to derive an absolute arrest duration independent of the wall shear rate. The binding frequency f (per millimeter) was defined as the number of recorded binding events divided by the total trajectory length L of monitored particles. The statistical uncertainty was calculated as (f/L)1/2, following Poisson's law.
The frequency of specific binding under a given condition (i.e., wall shear rate and ligand surface density) was estimated by subtracting from the binding frequency measured with anti-ICAM-1-bearing spheres the result obtained with isotype controls. The statistical uncertainty of the difference was calculated as the square root of the sum of squared uncertainties. To ensure that sphere-to-surface distance was independent of shear rate, we checked (not shown) that the ratio between the average particle velocity and flow rate remained constant, as expected (21).
Modeling kinetics of bond formation between a ligand and a receptor molecule
Model 1
The simplest model for the kinetics of bond formation between a ligand and a receptor molecule encountering each other is:
| (1) |
Assuming that k10 is much smaller than k01, the probability P(t) that a ligand and a receptor will bind during a contact of duration t is simply given by:
| (2) |
The encounter efficiency may be defined as the value of P(t) when t is the encounter duration. The binding frequency should thus be equal to the product of P(t) and the number λ of molecular encounters per unit length of particle trajectory. Two limiting situations may be considered (5). If k01t is much higher than 1, then P(t) ≈ 1, and the binding frequency should be independent of particle velocity. Conversely, if k01t is much lower than unity, then P(t) ≈ k01t, and the binding frequency should be proportional to t. Measuring the binding frequency will then yield an estimate of the association rate. Thus, a clear-cut consequence of model 1 is that binding frequency should vary as a power of t ranging between 0 and 1.
Model 2
As shown in Fig. 1, a common way to refine model 1 consists of assuming that a ligand-receptor association occurred as a two-step reaction, as supported by previous studies (17,22,23):
| (3) |
Figure 1.

Models for kinetics of bond formation. (A) Formation of a detectable bond as a biphasic process (model 2). Detectable ligand-receptor complexes (state 2) are hypothesized to form through a unidimensional reaction path involving a transient undetectable state (1). The fraction of bound molecules (i.e., collision efficiency) may thus scale as the square of encounter duration. (B) When the reaction path involves multiple binding states, collision efficiency may scale as powers of encounter duration higher than 2, requiring the use of an increasing number of parameters. (C) A simple way to model a path involving multiple intermediate states may consist of using an “effective” diffusion coefficient with a low value on a segment of the reaction path that may be viewed as a “kinetic trap” (model 3).
Assuming that state (LR)1 is a transient complex with a lifetime intermediate between encounter time and 200 ms, thus remaining undetectable under our experimental conditions, and that the (LR)2 dissociation is negligible on this timescale, the probability of bond formation during encounter time t may be calculated as:
| (4) |
| (5) |
where P0(t), P1(t), and P2(t) are the probabilities of finding ligand and receptors, respectively, separated in state 1 or state 2, at time t after the onset of molecular encounter. An obvious limitation of this model is that Eq. 5 predicts that encounter efficiency cannot vary as a power of an encounter time higher than 2, in contrast with experimental data (see Results and Table 2 below). This conclusion is not dependent on the neglect of k10 that allowed for a marked simplification of kinetic equations without resulting in a marked change of theoretical binding plots. This limitation might be overcome by introducing a number of intermediate states (LR)3, (LR)4, … in Eq. 3 (Fig. 1 B). However, this would increase the number of adjustable parameters and still worsen the aforementioned difficulty in determining kinetic parameters.
Table 2.
Influence of shear rate on encounter efficiency
| Ligand/receptor | Shear rate range (s−1) | Relative shear increase rs | Relative binding efficiency decrease rb | Exponent ln(rb)/ln(rs) | Reference number |
|---|---|---|---|---|---|
| P-selectin neutrophil | 20–100 | 5 | 10 | 1.43 | 33 |
| C-cadherin C-cadherin | 8.4–15.7 | 1.87 | 4.38 | 2.36 | 20 |
| L-selectin antibody | 40–50 | 1.25 | 2.8 | 4.5 | 34 |
| P-selectin neutrophil | 25–200 | 8 | 42.5 | 1.8 | 35 |
| Streptavidin biotin | 7.2–21.8 | 3.0 | 28 | 3.0 | 19 |
| Monocyte | 40–120 | 3.0 | 4.9 | 1.45 | 36 |
Published results of adhesion measurement under flow were used to derive dependence of binding probability per encounter, denominated as encounter efficiency, on wall shear rate.
Model 3
We hypothesized that the introduction of a growing number of intermediate states might lead to a simple limiting scheme, based on the concept of rough potential elaborated long ago (24,25), and well-accepted now (26). According to this idea, multiple intermediate states may be accounted for by modeling a molecular interaction as a diffusion along a reaction path with a low diffusion coefficient (Fig. 1 C). Encounter efficiency could then be calculated as the proportion of diffusive complexes that reached a basin after a contact of duration t. Fick's law for the one-dimensional diffusion of a particle with a diffusion coefficient D on a half-line (x ≥ 0) yields (27):
| (6) |
where c(x,t) is the probability density at time t and point x. The probability that a particle starting at x = 0 will move by a distance higher than x after a period of time t is then obtained by mere integration, yielding erfc(x/2√(Dt), where erfc is the error function complement (27).
Numerical simulation of bond formation/dissociation
Equation 6 does not accurately describe diffusion along actual energy landscapes. It was thus important to assess the robustness of this approximation. Because diffusion equations can be solved analytically with only a few simple conditions (27), we used numerical simulations to build data corresponding to a number of different energy landscapes. We modeled bond formation during an encounter of duration t as the random motion of a particle maintained during time t near the entry of a path made of a force-free segment with a low diffusion coefficient (i.e., a kinetic trap), followed by an energy well representing the first detectable ligand-receptor complex. Bond formation thus occurred if the particle fell into the well during time t. The kinetic trap was modeled as a set of 100 sequential positions, and the particle was allowed to jump at random from a position to an adjacent one at each time step, with a low probability D that was directly related to the diffusion coefficient (15). The presence of a force F between positions (i) and (i + 1) should thus increase the probability of jumping from (i) to (i + 1) by D × [exp(F) −1], to comply with Boltzmann's law. The results of nondimensional simulation experiments could be fitted to experimental data by fitting the parameters D and x, which amounts to choosing a time and a length unit. However, as discussed above, encounter efficiency essentially depends on Dt/x2. The validity of simulations was assessed by checking that 1), the exact solution of Eq. (6). was closely fitted on a flat landscape (see Fig. 7 B); and 2), the relative probability of finding a particle at two close points near the center and the edge of an energy well (see Fig. 7 A) matched Boltzmann's law, with less than 5% error after ∼200,000 unit time steps.
Figure 7.

Many models based on “kinetic trap” assumption led to an erfc-like relationship between encounter efficiency and contact duration. (A) Typical simulation. The reaction path was modeled as a sequence of 100 positions, with energy shown on top curve. A sink was located at position 0 to account for more stable inner binding states. A particle starting from position 100 was considered as bound after N steps if it moved leftward by at least distance x. The fall into the sink was slowed by a wide barrier of 4 kB. Complex entry into or exit from the reaction path (at position 100) was modeled as a random exchange with a reservoir on the right. Bottom: Probability distribution of a particle starting from position 100 at time 0 is shown after 1000 time steps (thick line), 10,000 steps (thin line), and 100,000 steps (broken line). (B) Results of simulation. Diamonds show simulated binding probabilities for a flat energy landscape with a sink at position zero and a barrier preventing exit at position 100. Thin line represents the exact solution of diffusion into a half-line, i.e., erfc[(x2/4Dt)1/2]. The discrepancy after 100,000 steps is attributable to the passage into the sink. Squares show effect of replacing the flat energy landscape with the curve in Fig. 5A (top). Thin line shows that experimental curves can still be fitted to an erfc function with a different timescale. Circles show effect of allowing particles to exit rightward from the reaction path (with a probability of going back 100-fold lower). Simulated data are still matched with an erfc curve with different scaling parameters.
Estimate of mean duration of molecular encounters
Defining as L the total length of ligand and receptor molecules, the time allowed for bond formation between a receptor moving at distance d from a ligand molecule with velocity w is t = 2 (L2 − d2)1/2/w (Fig. 2). Because a receptor molecule M moving at distance z from a ligand-coated surface can interact with ligand molecules located in a strip of width equal to 2 (L2 − z2)1/2, the average encounter time may be approximated as:
| (7) |
Figure 2.
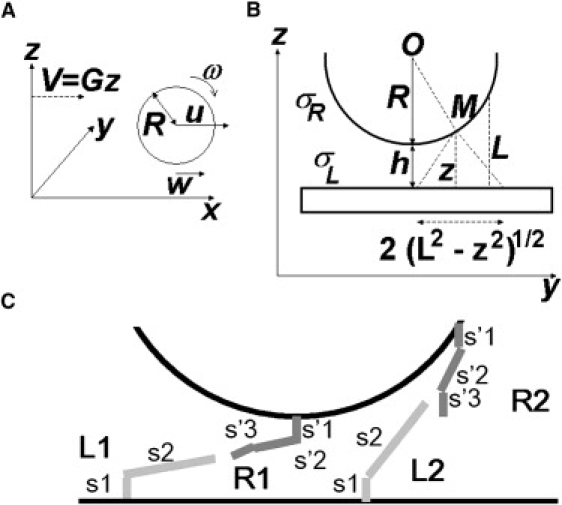
Geometrical parameters. (A) Motion of a microsphere near a planar surface in shear flow. The undisturbed flow velocity is Gz at distance z from the plane. The velocity u of the microsphere center depends on distance h between the sphere and the surface. The limiting ratio ωR/u is close to 0.57 when the sphere is close to the surface. Relative velocity w between the sphere surface and the plane is thus ∼0.43 u. (B) Bond formation may occur between points of the cell surface that are less than distance L from the plane. (C) To assess the influence of confinement and hydrodynamic forces on molecular interactions, chamber-bound molecules (anti-Fc + Fc ICAM) and microsphere receptors (anti-Ig + Ig anti-ICAM) were tentatively modeled as rigid rods connected with a flexible hinge corresponding to the immunoglobulin hinge regions. Approximating the length of an immunoglobulin domain as 4 nm, the lengths of segments s1, s2, s′1, s′2, and s′3 were respectively taken as 8 nm, 36 nm, 8 nm, 16 nm, and 8 nm.
The average interaction time was estimated by integrating over the microsphere region separated by a distance ≤L from the surface, and weighting with the probability for a point at height z to interact with a ligand, which is proportional to (L2 − z2)1/2:
| (8) |
Approximating L as 76 nm, h as 18 nm, and noting that the relative velocity w between the surface of a sphere close to a plane in a shear flow is ∼0.43 times the sphere velocity u (21), we obtain for the average molecular encounter duration:
| (9) |
An average encounter duration is only an approximation, but accurate calculation of the distribution of encounter durations would result in awkward formulae, without substantially changing the essence of our calculation.
Estimate of mean frequency of molecular encounters
As shown in Fig. 2 B, a receptor located at M moving at distance z above a plane surface will encounter molecules located on a strip of width 2 (L2 − z2)1/2, where L is the length of the ligand + receptor couple. Defining as σL the surface density of ligand molecules on the plane, the number of molecules encountered per unit time is 2 w (L2 − z2)1/2 σL. Integrating over the region of the microsphere surface located at the binding distance from the plane, and noting that the relative velocity between the sphere surface and the plane is 43% of the sphere velocity, the number λ of encounters per millimeter of sphere displacement is:
| (10) |
where h is the distance between the sphere and the plane, and σR is the surface density of receptors on the sphere surface (Fig. 2 B). Taking as h the average sphere height as derived from Boltzmann's law, and approximating L as 76 nm, we find λ ≈ 55,000 mm−1 when σL is 2 μm−2.
Parameter fitting
Fitting experimental data to theoretical curves was achieved by minimizing the sum calculated on all experimental points; yexp and yth represent the experimental and calculated values of the encounter efficiency, respectively.
Statistics
Analysis of variance and regression lines were obtained according to standard statistical methods (28).
Results
Monitoring the formation and dissociation of single molecular bonds between ICAM-1 and anti-ICAM-1 antibodies
Microspheres of 2.25-μm radius were coated with anti-ICAM-1 antibodies and driven along ICAM-1-coated surfaces in a flow chamber. Based on Boltzmann's law, in accordance with direct measurements (16), the average distance between spheres and surfaces was estimated as 18 nm, much less than the total length of ligand-receptor couples (∼76 nm). Thus, the duration of contact between ligand and receptor sites was limited by particle horizontal velocity rather than by vertical Brownian motion, in contrast with previously used conditions (15). The wall shear rate varied between 14–98 s−1, resulting in a mean particle velocity between 13–92 μm/s. The average time available for association between anti-ICAM-1 and ICAM-1 during an encounter (designated as encounter duration) was thus estimated to vary between ∼2.1–17 ms.
Defining particles as arrested when they moved by less than 0.5 μm during a 200-ms interval, we detected numerous stopping events whose duration and frequency were recorded. Detachment rates are given in Table 1.
Table 1.
Detachment rate of surface-bound microspheres
| ICAM-1 density | Wall shear rate | Detachment rate (s−1) |
|---|---|---|
| 1 μm−2 | 28 s−1 | 0.54 ± 0.056 (n = 274) |
| 2 μm−2 | 28 s−1 | 0.42 ± 0.029 (n = 729) |
| 4 μm−2 | 28 s−1 | 0.27 ± 0.048 (n = 165) |
| 1 μm−2 | 56 s−1 | 0.52 ± 0.087 (n = 108) |
| 2 μm−2 | 56 s−1 | 0.44 ± 0.035 (n =543) |
| 4 μm−2 | 56 s−1 | 0.46 ± 0.071 (n = 137) |
| 2 μm−2 | 66 s−1 | 0.57 ± 0.058 (n = 267) |
Anti-ICAM-1-coated microspheres were driven along surfaces coated with ICAM-1 molecules at low density. Duration of binding events was recorded and used to derive initial detachment rate ± statistical uncertainty, as explained. Number n of recorded arrests is indicated in parentheses.
The hypothesis that these events were mostly mediated by single bonds is supported by the finding that 1), binding frequency (i.e., number of arrests per unit length of microsphere displacement) was linearly dependent on the surface density of binding sites on the chamber floor (Fig. 3); and 2), arrest duration was not altered when binding-site density was varied, except with the lowest shear rate and highest binding-site density, where multiple bonds might occur during the same binding event (Table 1).
Figure 3.

Linear dependence of binding frequency on ligand density. Anti-ICAM-1-coated microspheres were driven along surfaces coated with ICAM-1 at low density with a wall shear rate of 28 s−1 (squares) or 56 s−1 (circles). The number of binding events per millimeter of trajectory is plotted versus ICAM-1 surface density. Vertical bar length is twice the standard error.
Dependence of binding frequency on encounter duration is not consistent with a monophasic model including a single association-rate parameter
A straightforward consequence of the standard model of bond formation described by Eqs. 1 and 2 (corresponding to model 1 in Materials and Methods) is that binding frequency should scale as a power of encounter duration ranging between 0 and 1. As shown in Fig. 4, binding frequency scaled as a power of encounter duration higher than 1. This conclusion could not be an artifact attributable to a low efficiency of bond detection at a higher shear rate, because the ligand-receptor bond lifetime was not significantly shortened when the shear rate was increased (Table 1). Further, our conclusions are supported by previous reports from our and other laboratories (Table 2). Thus, bond formation between ICAM and anti-ICAM could not be modeled as a standard monophasic reaction.
Figure 4.

Encounter efficiency is proportional to a power of encounter duration that is higher than unity. Anti-ICAM-1-coated microspheres were driven along surfaces coated with a low density of ICAM-1 (1, 2, and 4 molecules/μm2, shown as diamonds, squares, and circles, respectively), at a wall shear rate between 14–98 s−1. The frequency of specific binding events was plotted versus average duration of molecular encounters between ligand and receptor molecules, using a logarithmic scale. The slope of the regression line formed by experimental values, excluding the highest contact duration, was 2.41 ± 0.18, 2.88 ± 0.32, and 2.44 ± 0.30 when ICAM-1 density was 1, 2, and 4 molecules/μm2, respectively. Data for 1 and 4 mol/μm2 at 98 s−1 (no significant binding) could not appear on a logarithmic scale.
Accounting for experimental data with conventional kinetic models of multiphasic reactions would involve many unknown parameters that are difficult to derive unambiguously
A possible way to account for our data would be to assume that ligand-receptor association occurred as a multiphasic reaction involving transient intermediate complexes. The simplest case would involve a single transient state (Fig. 1 B and Eq. 3, corresponding to model 2 in Materials and Methods). Basic equations would yield two additional adjustable parameters, compared with model 1, and provide the possibility that encounter efficiency might vary as a power of encounter duration lower than or equal to 2.
Experimental data were fitted to theoretical plots by varying two parameters, i.e., the number λ of molecular encounters per millimeter of microsphere displacement and k01, to minimize the sum of squared distances between the logarithms of experimental and calculated collision efficiencies (Fig. 5). The dependence of theoretical curves on k12/k01 was too weak to allow an accurate determination of the best choice for this ratio. The sum of squares ranged between 1.02–1.13. An obvious limitation of this model is that Eq. 5 predicts that encounter efficiency cannot vary as a power of encounter time higher than 2, in contrast with Fig. 4 and Table 2. This limitation might be overcome by introducing a number of intermediate states (LR)3, (LR)4, … in Eq. 3. However, this would increase the number of adjustable parameters and worsen the aforementioned difficulty in determining kinetic parameters.
Figure 5.

Standard kinetic modeling of encounter efficiency. The experimental dependence of binding frequency on wall shear rate was fitted to nondimensional plots of encounter efficiency versus molecular contact duration, expressed as dimensionless product k01t (Eq. 5). A two-parameter fit was simply obtained by displacing the experimental curve on a log-log plot, and minimizing the squared difference. Dot-segment, broken, and thick curves were obtained with k12/k01 = 10, 1, and 0.1, respectively. The sum of squared errors corresponding to the best fit was 1.08 ± 0.06 for all curves, demonstrating the impossibility of unambiguously determining k12/k01. There was a large uncertainty in locating the adjusted data (squares) because the best-fit regions of calculated curves closely matched a straight line with a slope of 2, and fitted values of log(k01t) could be indefinitely decreased without significantly altering the squared difference. The accuracy of the fit is illustrated by considering a slightly translated curve (triangles) yielding a sum of squared errors of 2.50.
Thus, the simple view that ligand-receptor association behaves as a monophasic reaction with a single on-rate parameter is unable to account for the behavior disclosed by recent methods of dissecting ligand-receptor association at the single bond level. Further, the natural way of dealing with this situation by refining kinetic analyses (17,22) is not fully convenient, even if it is often unavoidable, because it requires too many parameters to allow for a safe experimental determination of each of them.
Experimental data perfectly match a simple model based on diffusion
As shown in Fig. 1 C and described quantitatively in Materials and Methods, a simple model of bond formation between a ligand and a receptor maintained at binding distance during a short time t might consist of representing bond formation as a progression of the complex along a rough energy landscape involving the multiple formation and dissociation of weak interactions. This suggests that the dependence of encounter efficiency on encounter duration might resemble the erfc function. As shown in Fig. 6, an excellent fit was found between binding frequencies and λ erfc[(t0/t)1/2] for the three tested surface densities of ICAM-1 molecules. The sum of squared errors was 0.21 at a density of two ICAM-1 molecules/μm2, and the best-fit parameters were t0 = 8.94 ms and λ = 27.5 encounters/mm. The same parameter t0 and encounter frequencies of 27.5/2 and 27.5 × 2 mm−1, respectively, fitted the experimental data well, corresponding to 1 and 4 ICAM-1/μm2.
Figure 6.

Excellent match between erfc and experimental data. Plots of binding frequency versus estimated contact duration (Eq. 2) were fitted to erfc(t−1/2) by dividing all abscissas by the same factor of 8.94 ms, and frequencies by 13.75 mm−1, 13.75 × 2 mm−1, and 13.75 × 4 mm−1 when the surface density of ICAM-1 was 1 μm−2 (diamonds), 2 μm−2 (squares), and 4 μm−2 (circles), respectively.
Numerical simulations show that erfc provides a robust account of diffusion under a wide range of conditions
Because the simplified reaction pathway leading to erfc function may not closely mimic actual reaction pathways, it was important to know whether the analytical solution that matched our experimental results was strongly dependent on the shape of energy landscapes. Because diffusion equations can be solved analytically only for a limited number or cases (27), extensive computer simulations were performed to explore the robustness of approximating diffusion with an erfc function. Representative results are shown in Fig. 7. Our conclusions may be summarized as follows:
-
1.
The two-parameter function λerfc[(t0/t)1/2] often allowed a correct fit of the probability that a complex entering a reaction path at time zero will diffuse to an energy well after time t.
-
2.
Parameter t0 is about x2/4D, where x is the distance between the well and the entry of the reaction path, and D is the effective diffusion coefficient. Further, λ should simply represent the frequency of molecular encounters per unit length of particle displacement.
-
3.
If the reaction well is too shallow, or if there is a high probability that the complex will exit from the reaction path before reaching the well, erfc may still give a correct account of encounter efficiency versus duration, but parameters 1/t0 and λ may be markedly lower than 4D/x2 or the frequency of molecular encounters.
-
4.
That the detachment rate increase did not result in a significant decrease of arrest duration (Table 1) suggests that the binding state is sufficiently steep to resist hydrodynamic forces, according to the simple model of Bell (29).
Discussion
The purpose of this study was to question the suitability of using an association-rate constant (kon) to describe the rate of bond formation between ligand and receptor molecules. The starting point was an experimental demonstration that the probability of bond formation during a molecular encounter of small duration t may be proportional to a power of t markedly higher than unity. A qualitative way to express this conclusion would state that bond formation requires a minimum contact time. Because of the significance of this conclusion, it is important to discuss the validity of all hypotheses underlying our data interpretation.
Decreased binding efficiency measured at higher shear rates cannot be attributable to a defect of arrest detection
A simple explanation for our findings would state that binding events may be less efficiently detected at higher shear rates for two reasons: 1), binding events should be shortened by the hydrodynamic drag supported by bonds; and 2), a very transient arrest might be less easily detected when the average velocity of unbound particles is higher, because of the higher shear rate. These possibilities were ruled out by using low-enough shear rates to avoid a substantial effect of forces on bond lifetime (Table 1), and by only counting arrests much longer than the time resolution of our apparatus.
Decreased binding efficiency measured at higher shear rates cannot be attributable to an increase of sphere-to-surface distance as a consequence of hydrodynamic forces
We derived sphere height from velocity according to four steps:
-
1.
We checked basic results from low Reynolds number hydrodynamics concerning the motion of a sphere close to a plane in a laminar shear flow (21). The dimensionless parameters h/R and u/RG (Fig. 2; h is the sphere-to-surface distance, R and u are the sphere radius and velocity, respectively, and G is the shear rate) are related through a universal relationship that was fitted to an analytical formula for convenience (15). Although the Reynolds number remained lower than 10−5, we had to assess the relevance of theoretical results using actual surfaces separated by nanometer-scale distances. As previously reported (15), we measured the velocity distribution of microspheres of 1.4-μm and 2.25-μm radius. We checked without any parameter fitting that G could be derived from a velocity distribution with ∼5% accuracy. Further, using known values of G and microsphere size and density, we showed that the calculated height distribution matched Boltzmann's distribution, supporting the view that forces generated during sphere-to-surface approach were much lower than the sedimentation force.
-
2.
As an independent check of the validity of hydrodynamic equations, we devised a method to allow for direct measurement of the sphere-to-surface distance from images obtained with reflection interference contrast microscopy. Measurements were calibrated by studying the distance between a sphere glued to the tip of an atomic-force microscope and a test surface. This method was then used for the simultaneous determination of microsphere height and velocity in a laminar flow chamber. It was concluded that the lubrication theory was acceptable with spheres of 2.25-μm radius and a wall shear rate of a few s−1 (16).
-
3.
We used hydrodynamic equations to check that the sphere-to-surface distance h was independent of the flow rate, as expected. In 76 independent experiments, we measured the ratio between mean cell velocity and wall shear rate G (which was assumed to be proportional to the flow rate). First, we used analysis of variance to test the dependence of u/G on G: no correlation was detected (p = 0.84). Second, we used standard linear regression methods to estimate the maximum admissible increase of (u/G) when G was increased from 28 to 98 s−1, yielding 9.9% for a confidence threshold of 0.05 (28). The corresponding increase of sphere-to-surface distance h would be from 18 to 38 nm.
-
4.
The last step consisted of verifying that such an increase of parameter h could not account for the decreased binding efficiency we found at higher shear rates. According to Eqs. 7–9, increasing h from 18 to 38 nm would decrease prefactor 219 of Eq. 9 by 14%. The ligand-receptor encounter time would thus be divided by 4.1 instead of 3.5 when the shear rate increased from 28 to 98 s−1. This would not render the measured decrease of encounter efficiency accounted for by linear model 1. Indeed, for all three surface concentrations of Fc ICAM we assayed, the respective decreases of contact efficiency were higher than 11 and 40 when the shear rate was increased from 28 s−1 by a factor of 2.5 and 3.5, respectively.
Validity of our estimate of contact duration
The interpretation of our results is dependent on the validity of Eq. 9 for two reasons. First, we assumed that the duration of encounter between a ligand and a microsphere-bound receptor at height h was inversely proportional to the sphere velocity. Second, although the main point of our work was to demonstrate the lack of proportionality between contact duration and contact efficiency, our estimate of 10 ms for the order of magnitude of minimal contact time for bond formation was directly proportional to prefactor 219 of Eq. 9. These assumptions are dependent on three points:
-
1.
Local hydrodynamic forces might change the orientation of ligand and receptors, thus impairing contact formation at higher shear rates. This possibility was examined by modeling ligands and receptors as series of two or three rigid segments (Fig. 2 C), and approximating the force and torque experienced by each segment as 6πμaGz and 4πμa3G, according to exact formulae obtained for spheres in viscous fluids (30). The sphere radius a was taken as half the length of the considered segment, z was the distance between the segment center and the surface where it was anchored, and the local value of G around molecules was approximated as the ratio between the relative velocity of the sphere surface and the sphere-to-surface distance. When z was higher than 29 nm, the work of forces on segments during a right-angle rotation was lower than kBT/10, where kB is Boltzmann's constant and T is the absolute temperature. Further, ligand molecules separated from spheres by less than 29 nm were necessarily slanted, even in the absence of shear. Thus, the effect of hydrodynamic forces on the orientation of binding sites was deemed to be negligible.
-
2.
Equation 7 assumes that ligand and receptor molecules are flexible enough to bind when the distance between their anchors ranges between ∼18–76 nm. This point was addressed semiquantitatively elsewhere (31). Because binding sites are held by a total of three immunoglobulin molecules (Fig. 2 C), thus providing three highly flexible hinge regions (32), Eq. 7 should give an acceptable order of magnitude for 〈t〉.
-
3.
Microspheres are subjected to a vertical Brownian motion with an amplitude on the order of 18 nm, based on Boltmann's law. As mentioned above, the prefactor in Eq. 9 is only weakly dependent on microsphere height when this is less than ∼50 nm. Thus, although Brownian motion had a major influence on contact between microspheres of 1.4-μm radius and ligand-coated surfaces (12,15), this was not important under the experimental conditions used in the above experiments.
In conclusion, Eq. 9 should provide an acceptable approximation for the flow-rate dependence and order of magnitude of ligand-receptor encounters.
Our data are of general significance, rather than reflective of a particular behavior of the ligand-receptor couple used in this study
To test the generality of our findings, we examined previously published reports on single-bond formation between surface-attached molecules. As shown in Table 2, the reported binding frequencies varied as a power of encounter time that might be much higher than unity.
Which theoretical framework can be used to account for bond formation?
The simplest way to account for encounter efficiency scaling as a power of contact time between 1 and 2 may be to postulate the occurrence of an undetectable binding state with two additional adjustable parameters (Eq. 3 and model 2). The experimental data shown in Table 2 may be accommodated in this way with up to five intermediate stages (to account for exponent 4.5). However, there are two problems with this approach: 1), it is not reasonable to derive more than two fitted parameters with a fairly simple-shaped experimental curve, as shown in Fig. 2; and 2), even if this difficulty did not exist, it would be desirable to account for the binding behavior of a given ligand-receptor couple with a limited number of parameters.
Thus, the growing number of parameters required to account for a number of experimental data (19,22) by postulating the existence of an increasing number of barriers and basins in the energy landscape was an incentive for us to explore the possibility of using a simpler description by postulating the presence of a kinetic trap impeding the formation of the first stable complex. This hypothesis is supported by previous reports based on kinetic studies of protein conformational change, leading to the concept of rough energy landscapes (24–26).
Conclusions
Although many authors emphasized the importance of association rates, and reported difficulties in comparing 2D and 3D kon, the suitability of this parameter to account for molecular interactions as conveniently as affinity constants or dissociation rates was not actually questioned. The data presented here and in other reports suggest that there is an intrinsic difficulty in using association rates to account for a single-bond formation between surface-attached molecules, and we suggest that a possible way to deal with this problem would be to postulate the existence of a kinetic trap resulting in threshold contact times for bond formation.
Acknowledgments
This work was supported by grant JCJC06-0135 from the Agence Nationale pour la Recherche.
References
- 1.Creighton T.E. 2nd ed. W.H. Freeman & Co.; New York: 1993. Proteins—Structure and Molecular Properties. [Google Scholar]
- 2.Foote M.C. Kinetic maturation of an immune response. Nature. 1991;352:530–532. doi: 10.1038/352530a0. [DOI] [PubMed] [Google Scholar]
- 3.Lawrence M.B., Springer T.A. Leukocytes roll on a selectin at physiologic flow rates: distinction from and prerequisite for adhesion through integrins. Cell. 1991;65:859–873. doi: 10.1016/0092-8674(91)90393-d. [DOI] [PubMed] [Google Scholar]
- 4.Dwir O., Kansas S., Alon R. An activated L-selectin mutant with conserved equilibrium binding properties but enhanced ligand recognition under shear flow. J. Biol. Chem. 2000;275:18682–18691. doi: 10.1074/jbc.M001103200. [DOI] [PubMed] [Google Scholar]
- 5.Vitte J., Pierres A., Benoliel A.M., Bongrand P. Direct quantification of the modulation of interaction between cell-or surface-bound LFA-1 and ICAM-1. J. Leukoc. Biol. 2004;76:594–602. doi: 10.1189/jlb.0204077. [DOI] [PubMed] [Google Scholar]
- 6.Zhang F., Marcus W.D., Goyal N.H., Selvaraj P., Springer T.A. Two-dimensional kinetics regulation of αLβ2-ICAM-1 interaction by conformational changes of the αL-inserted domain. J. Biol. Chem. 2005;280:42207–42218. doi: 10.1074/jbc.M510407200. [DOI] [PMC free article] [PubMed] [Google Scholar]
- 7.Dustin M.L., Bromley S.K., Davis M.M., Zhu C. Identification of self through two-dimensional chemistry and synapses. Annu. Rev. Cell Dev. Biol. 2001;17:133–157. doi: 10.1146/annurev.cellbio.17.1.133. [DOI] [PubMed] [Google Scholar]
- 8.Schuck P. Use of surface plasmon resonance to probe the equilibrium and dynamic aspects of interactions between biological macromolecules. Annu. Rev. Biophys. Biomol. Struct. 1997;26:541–566. doi: 10.1146/annurev.biophys.26.1.541. [DOI] [PubMed] [Google Scholar]
- 9.Leonard P., Säfsten P., Hearty S., McDonnell B., Finlay W. High throughput ranking of recombinant avian scFv antibody fragments from crude lysates using the Biacore A100. J. Immunol. Methods. 2007;323:172–179. doi: 10.1016/j.jim.2007.04.010. [DOI] [PubMed] [Google Scholar]
- 10.Hinterdorfer P., Baumgartner W., Gruber H.J., Schilcher K., Schindler H. Detection and localization of individual antibody-antigen recognition events by atomic force microscopy. Proc. Natl. Acad. Sci. USA. 1996;93:3477–3481. doi: 10.1073/pnas.93.8.3477. [DOI] [PMC free article] [PubMed] [Google Scholar]
- 11.Dustin M.L. Adhesive bond dynamics in contacts between T lymphocytes and glass-supported planar bilayers reconstituted with the immunoglobulin-related adhesion molecule CD58. J. Biol. Chem. 1997;272:15782–15788. doi: 10.1074/jbc.272.25.15782. [DOI] [PubMed] [Google Scholar]
- 12.Pierres A., Feracci H., Delmas V., Benoliel A.M., Thiéry J.P. Experimental study of the interaction range and association rate of surface-attached cadherin 11. Proc. Natl. Acad. Sci. USA. 1998;95:9256–9261. doi: 10.1073/pnas.95.16.9256. [DOI] [PMC free article] [PubMed] [Google Scholar]
- 13.Chesla S.E., Selvaraj P., Zhu C. Measuring two-dimensional receptor-ligand binding kinetics by micropipette. Biophys. J. 1998;75:1553–1572. doi: 10.1016/S0006-3495(98)74074-3. [DOI] [PMC free article] [PubMed] [Google Scholar]
- 14.Chen W., Evans E.A., McEver R.P., Zhu C. Monitoring receptor-ligand interactions between surfaces by thermal fluctuations. Biophys. J. 2008;94:694–701. doi: 10.1529/biophysj.107.117895. [DOI] [PMC free article] [PubMed] [Google Scholar]
- 15.Pierres A., Benoliel A.M., Zhu C., Bongrand P. Diffusion of microspheres in shear flow near a wall: use to measure binding rates between attached molecules. Biophys. J. 2001;81:25–42. doi: 10.1016/S0006-3495(01)75677-9. [DOI] [PMC free article] [PubMed] [Google Scholar]
- 16.Robert P., Sengupta K., Puech P.H., Bongrand P., Limozin L. Tuning the formation and rupture of single ligand-receptor bonds by hyaluronan-induced repulsion. Biophys. J. 2008;95:3999–4012. doi: 10.1529/biophysj.108.135947. [DOI] [PMC free article] [PubMed] [Google Scholar]
- 17.Pierres A., Benoliel A.M., Bongrand P. Measuring the lifetime of bonds made between surface-linked molecules. J. Biol. Chem. 1995;270:26586–26592. doi: 10.1074/jbc.270.44.26586. [DOI] [PubMed] [Google Scholar]
- 18.Fischmann T.O., Bentley G.A., Bhat T.N., Boulot G., Mariuzza R.A. Crystallographic refinement of the three-dimensional structure of the FabD1.3-lysozyme complex at 2.5-Å resolution. J. Biol. Chem. 1991;266:12915–12920. [PubMed] [Google Scholar]
- 19.Pierres A., Touchard D., Benoliel A.M., Bongrand P. Dissecting streptavidin-biotin interaction with a laminar flow chamber. Biophys. J. 2002;82:3214–3223. doi: 10.1016/S0006-3495(02)75664-6. [DOI] [PMC free article] [PubMed] [Google Scholar]
- 20.Pierres A., Prakasam A., Touchard D., Benoliel A.M., Bongrand P. Dissecting subsecond cadherin bound states reveals an efficient way for cells to achieve ultrafast probing of their environment. FEBS Lett. 2007;581:1841–1846. doi: 10.1016/j.febslet.2007.03.077. [DOI] [PMC free article] [PubMed] [Google Scholar]
- 21.Goldman A.J., Cox R.G., Brenner H. Slow viscous motion of a sphere parallel to a plane wall—II. Couette flow. Chem. Eng. Sci. 1967;22:653–660. [Google Scholar]
- 22.Beeson C., McConnell H.M. Kinetic intermediates in the reactions between peptides and proteins of major histocompatibility complex class II. Proc. Natl. Acad. Sci. USA. 1994;91:8842–8845. doi: 10.1073/pnas.91.19.8842. [DOI] [PMC free article] [PubMed] [Google Scholar]
- 23.Merkel R., Nassoy P., Leung A., Ritchie K., Evans E. Energy landscapes of receptor-ligand bonds explored with dynamic force spectroscopy. Nature. 1999;397:50–53. doi: 10.1038/16219. [DOI] [PubMed] [Google Scholar]
- 24.Ansari A., Berendzen J., Bowne S.F., Frauenfelder H., Iben I.E.T. Protein states and proteinquakes. Proc. Natl. Acad. Sci. USA. 1985;82:5000–5004. doi: 10.1073/pnas.82.15.5000. [DOI] [PMC free article] [PubMed] [Google Scholar]
- 25.Zwanzig R. Diffusion in a rough potential. Proc. Natl. Acad. Sci. USA. 1988;85:2029–2030. doi: 10.1073/pnas.85.7.2029. [DOI] [PMC free article] [PubMed] [Google Scholar]
- 26.Chu J.W., Voth G.A. Coarse-grained free energy functions for studying protein conformational changes: a double-well network model. Biophys. J. 2007;93:3860–3871. doi: 10.1529/biophysj.107.112060. [DOI] [PMC free article] [PubMed] [Google Scholar]
- 27.Crank J. 2nd ed. Oxford University Press; Oxford: 1975. The Mathematics of Diffusion. [Google Scholar]
- 28.Snedecor G.W., Cochran W.G. Iowa State University Press; Ames, IA: 1980. Statistical Methods. [Google Scholar]
- 29.Bell G.I. Models for the specific adhesion of cells to cells. Science. 1978;200:618–627. doi: 10.1126/science.347575. [DOI] [PubMed] [Google Scholar]
- 30.van de Ven T.G.M. Academic Press; London: 1989. Colloidal Hydrodynamics. [Google Scholar]
- 31.Pierres A., Benoliel A.M., Bongrand P. Studying receptor-mediated cell adhesion at the single molecule level. Cell Adhes. Commun. 1998;5:375–395. doi: 10.3109/15419069809010783. [DOI] [PMC free article] [PubMed] [Google Scholar]
- 32.Valentine R.C., Green N.M. Electron microscopy of an antibody-hapten complex. J. Mol. Biol. 1967;27:615–617. doi: 10.1016/0022-2836(67)90063-0. [DOI] [PubMed] [Google Scholar]
- 33.Paschall C.D., Guilford W.H., Lawrence M.B. Enhancement of L-selectin, but not P-selectin, bond formation frequency by convective flow. Biophys. J. 2008;94:1034–1045. doi: 10.1529/biophysj.106.098707. [DOI] [PMC free article] [PubMed] [Google Scholar]
- 34.Yago T., Zarnitsyna V.I., Klopocki G., McEver R.P., Zhu C. Transport governs flow-enhanced cell tethering through L-selectin at threshold shear. Biophys. J. 2007;92:330–342. doi: 10.1529/biophysj.106.090969. [DOI] [PMC free article] [PubMed] [Google Scholar]
- 35.Edmondson K.E., Denney W.S., Diamond S.L. Neutrophil-bead collision assay: pharmacologically induced changes in membrane mechanics regulate the PSG-1/P-selectin adhesion lifetime. Biophys. J. 2005;89:3603–3614. doi: 10.1529/biophysj.105.066134. [DOI] [PMC free article] [PubMed] [Google Scholar]
- 36.Rinker K.D., Prabhakar V., Truskey G.A. Effect of contact time and force on monocyte adhesion to vascular endothelium. Biophys. J. 2001;80:1722–1732. doi: 10.1016/S0006-3495(01)76143-7. [DOI] [PMC free article] [PubMed] [Google Scholar]