Abstract
TORC1 (Target of rapamycin complex 1) has a critical role in the regulation of cell growth and cell size. A wide range of signals, including amino acids, is known to activate TORC1. Here, we report the identification of Rag GTPases as novel activators of TORC1 in response to amino acid signals. Knockdown of Rag gene expression suppressed the stimulatory effect of amino acids on TORC1 in Drosophila S2 cells. Expression of constitutively active (GTP-bound) Rag in mammalian cells enhances TORC1 in the absence of amino acids while expression of dominant negative Rag blocks the stimulatory effects of amino acids on TORC1. Drosophila genetic studies also show that the Rag GTPases regulate cell growth, autophagy, and animal viability under starvation. Together, our studies establish a novel function of Rag GTPases in TORC1 activation in response to amino acid signals.
Introduction
A wide range of signals regulates the activity of Target of rapamycin (TOR) to control cell growth. TOR exists in two distinct complexes1, 2, TORC1 and TORC2, which share mTOR and mLST8 and have each their unique subunits. TORC1 is directly inhibited by rapamycin3, while TORC2 is not4–6. TORC1 positively regulates cell growth and cell size by promoting anabolic processes such as protein synthesis1, 7 and inhibiting catabolic processes such as autophagy8–10. The S6-kinase and translation factor 4EBP1 are phosphorylated upon TORC1 activation to mediate TOR-induced translational regulation11, 12 and their phosphorylations have been used to assess TOR activation in vivo
TORC1 is regulated by mitogenic growth factors, cellular energy levels, and amino acids1, 2. The mechanisms of TORC1 regulation by growth factors and energy levels have been characterized. For example, growth factors activate TORC1 partly through PI3K, Akt, TSC1/TSC2, and Rheb13–15, a small GTPase of the Ras family that directly binds to and stimulates TORC1 activity16–18. Amino acids are potent activators of TORC119 however, the mechanism of TORC1 activation by amino acids is largely unknown. Although studies have implicated the VPS34 PI3 kinase in nutrient response20, 21, its precise function in TORC1 activation remains to be established.
Gtr1 and Gtr2 are unique members of the Ras GTPase family in yeast22 that have a long C-terminal extension which is required for Gtr1/Gtr2 heterodimer formation23, 24. In yeast, Gtr1/Gtr2 act in a multifunctional protein complex involved in nuclear transport regulation, intracellular protein trafficking, microautophagy, and exit from rapamycin-induced growth arrest22, 24–26. RagA and RagB are mammalian homologues of Gtr1 while RagC and RagD are corresponding homologues of Gtr227, 28. Although the physiological functions of Rag family GTPases are largely unknown, RagA and RagB can form heterodimers with RagC and RagD28 and Rag complexes may functionally interact with Ran to modulate nuclear transport22, 29. Here, we identify Rag GTPases as novel regulators of TORC1 in cultured mammalian cells and Drosophila. Our data indicate that Rag promotes cell growth and inhibits autophagy by activating TORC1 in response to amino acid signals.
Results
dRagA and dRagC are positive regulators of S6K phosphorylation in Drosophila S2 cells
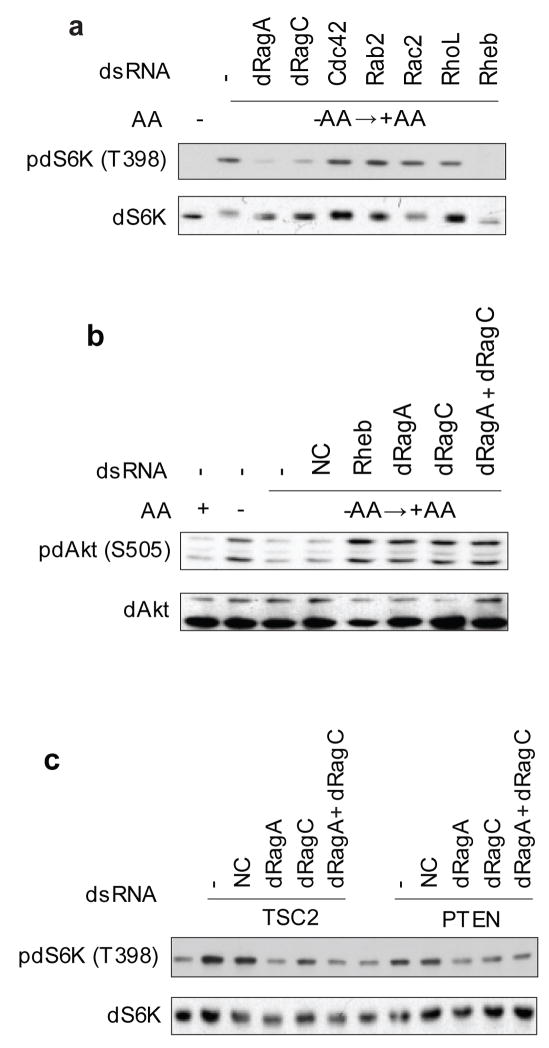
The GTPase family proteins are involved in almost every aspects of cellular signaling. We hypothesized that amino acid signaling to TORC1 may involve a GTPase(s). We performed a RNA interference (RNAi) screen of 132 annotated Drosophila GTPases using Drosophila S2 cells and looking for the GTPases whose silencing prevents amino acid-induced phosphorylation and mobility shift of dS6K in S2 cells (Fig. 1a). CG11968 and CG8707 were identified as important for dS6K phosphorylation in response to amino acids (Fig. 1a). Sequence comparison analyses show that CG11968 is most closely homologous to the yeast Gtr1 and mammalian RagA and RagB, while CG8707 is homologous to the yeast Gtr2 and mammalian RagC and RagD and therefore named them dRagA and dRagC, respectively (Fig. 1a). Consistent with results in yeast and mammalian cells, these proteins were previously found to interact in large scale two hybrid screens30. Knockdown of many other GTPases, such as the Rho family members, had no effect on dS6K phosphorylation (Fig. 1a).
Figure 1. dRagA and dRagC are novel activators of TORC1 in Drosophila S2 cells.
(a) Knockdown of dRagA and dRagC decreased dS6K phosphorylation (T398). Drosophila S2 cells treated with or without each indicated RNAi were amino acids (AA) starved for 1 h followed by AA stimulation for 30 min. Phosphorylation and protein levels of dS6K were determined by immunoblotting with indicated antibodies.
(b) dRagA and dRagC are not required for dAkt phosphorylation. Drosophila S2 cells treated with or without each indicated RNAi were AA starved for 1 h and stimulated with AA for 30 min. Phosphorylation and protein levels of dAkt were determined by immunoblotting with appropriate antibodies as indicated. NC: negative control RNAi.
(c) dRagA and dRagC function parallel to TSC2 and PTEN. dRagA or/and dRagC RNAi was added to S2 cells in combination with dTSC2 or dPTEN RNAi as indicated. dTSC2 or dPTEN RNAi treatment increased pdS6K (T398) and this increase was compromised by dRagA or/and dRagC RNAi.
Rheb was also isolated in our screen. It is worth noting that Rheb knockdown reproducibly caused a stronger inhibition of S6K phosphorylation than dRagA and dRagC (Fig. 1a), consistent with the notion that Rheb is a direct activator of TORC117, 18. Knockdown of several other GTPases, such as Rab5 and Ran, also decreased dS6K phosphorylation. However, knockdown of Rab5 and Ran significantly decreased cell numbers as well (data not shown), indicating a general effect of these GTPases on cell proliferation/apoptosis. Therefore, we focused our efforts on the Rag GTPases.
Amino acids are known to stimulate TORC1 but not TORC22. In fact, amino acid starvation indirectly elevates TORC2 activity because inactivation of S6K by amino acid starvation relieves the feedback inhibition on TORC231, 32 (Fig. 1b). We tested the effect of dRag on dAkt phosphorylation, a TORC2 substrate. Knockdown of dRagA or dRagC caused a significant increase of dAkt phosphorylation (Fig. 1b). These data are consistent with the notion that dRagA and dRagC play a positive role in TORC1 activation but not TORC2 activation.
To determine the functional relationship between dRag and the components of TOR signaling pathway, we performed knockdown of dTSC2 and dPTEN, two negative regulators of dTOR, in combination with dRag. As expected, dTSC2 knockdown increased dS6K phosphorylation (Fig. 1c). Knockdown of either dRagA or dRagC compromised the effect of TSC2 knockdown on dS6K phosphorylation (Fig. 1c). Of note is that knockdown of dRagA or dRagC did not decrease dS6K phosphorylation below the basal level when dTSC2 was also knocked down. In contrast, dRheb knockdown eliminated dS6K phosphorylation even when dTSC2 was knocked down (data not shown). Similar results between dRag and dPTEN were observed (Fig. 1c). These data suggest that RagA and RagC may function in parallel to PTEN and TSC2 to activate TORC1.
Rag GTPases regulate mammalian TORC1
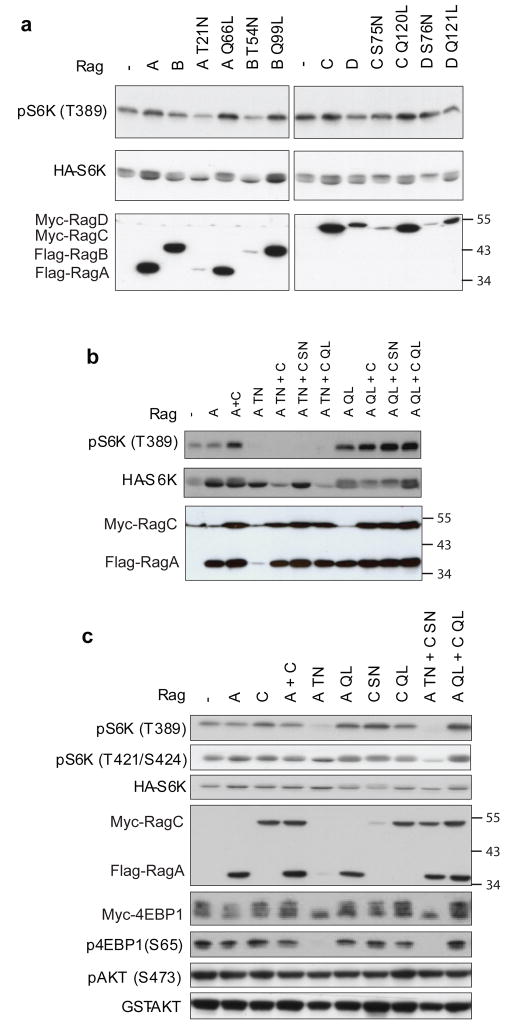
We next examined the function of Rag GTPases in regulation of mammalian TORC1 in cultured cells. Human RagA shares over 90% sequence identity with RagB but only 25% sequence identity with RagC and RagD while RagC shares 87% sequence identity with RagD28. Wild type as well as constitutively active and dominant negative mutants of human RagA, B, C, and D were constructed. In vivo labeling of RagA showed that both wild type and RagA Q66L contained high levels of GTP while RagA T21N bound little nucleotide (Supplementary Fig. S1). We found that expression of Rag, especially the constitutively active RagA Q66L and RagB Q99L, increased phosphorylation of co-transfected HA-S6K (Fig. 2a). In contrast, expression of dominant negative RagA T21N and RagB T54N decreased S6K phosphorylation. The effect of dominant negative RagA and RagB expression on S6K was also evident as shown by an increase in S6K mobility (Fig. 2a). On the other hand, expression of constitutively active and dominant negative RagC or RagD had only a minor effect on S6K phosphorylation (Fig. 2a). Surprisingly, the dominant negative mutants RagC S75N and RagD S76N decreased S6K mobility (Fig. 2a), indicating a possible increase of phosphorylation (see results later).
Figure 2. Mammalian Rag GTPases regulate TORC1 activity.
(a) Constitutively active RagA and RagB stimulate S6K phosphorylation. 200 ng of each mammalian RagA, RagB, RagC, or RagD construct was co-transfected with HA-S6K (20 ng) into HEK293 cells. Their corresponding dominant negative mutants (RagA T21N, RagB T54N, RagC S75N, RagD S76N), and constitutively active mutants (RagA Q66L, RagB Q99L, RagC Q120L, RagD Q121L), were also tested. Phosphorylation and protein levels were determined by immunoblotting with appropriate antibodies, as indicated. Molecular weights of markers are indicated on the right.
(b) RagA has a dominant role over RagC in regulating S6K phosphorylation. 200 ng of each indicated Rag constructs were co-transfected with 20 ng of HA-S6K. The different Rag mutants used in the transfection are indicated on the top of each lane.
(c) Rag regulates TORC1 but not TORC2 activity. 200 ng of each indicated Rag constructs were co-transfected with 20 ng of HA-S6K, 20 ng of Myc-4EBP1, or 100 ng of GST-AKT. Phosphorylation and protein levels were determined by immunoblotting with appropriate antibodies, as indicated.
We confirmed the physical interaction between RagA and RagC (data not shown). The relationship between RagA and RagC in S6K phosphorylation was further investigated. As shown in Fig. 2b, RagA T21N dominantly inhibited S6K phosphorylation regardless of the nucleotide binding status of the co-expressed RagC. Moreover, RagA Q66L dominantly activated S6K phosphorylation regardless of the nucleotide binding status of the co-transfected RagC. Notably, RagA T21N and RagC S75N were poorly expressed when they were transfected alone. However, when they were co-transfected with either wild type or mutant versions of RagC or RagA, the expression levels were markedly increased (Fig. 2b), suggesting dimer formation stabilizes the dominant negative mutants of RagA and RagC, which are unstable.
To further examine the role of Rag GTPases in mTORC1 regulation, we determined the phosphorylation status of the S6K site T421/S424, which is not directly phosphorylated by mTORC1, and 4EBP1, another direct substrate of mTORC1. RagA T21N did not decrease S6K T421/S424 phosphorylation as much as T389. In contrast, RagAT21N completely blocked 4EBP1 phosphorylation (S65) and also caused a dramatic mobility shift of the co-transfected 4EBP1 (Fig. 2c). On the other hand, Rag had little effect on AKT (S473) phosphorylation, a TORC2 substrate 33. These results support the notion that Rag GTPases specifically activate mTORC1 but not mTORC2.
Rag GTPases regulate amino acid response
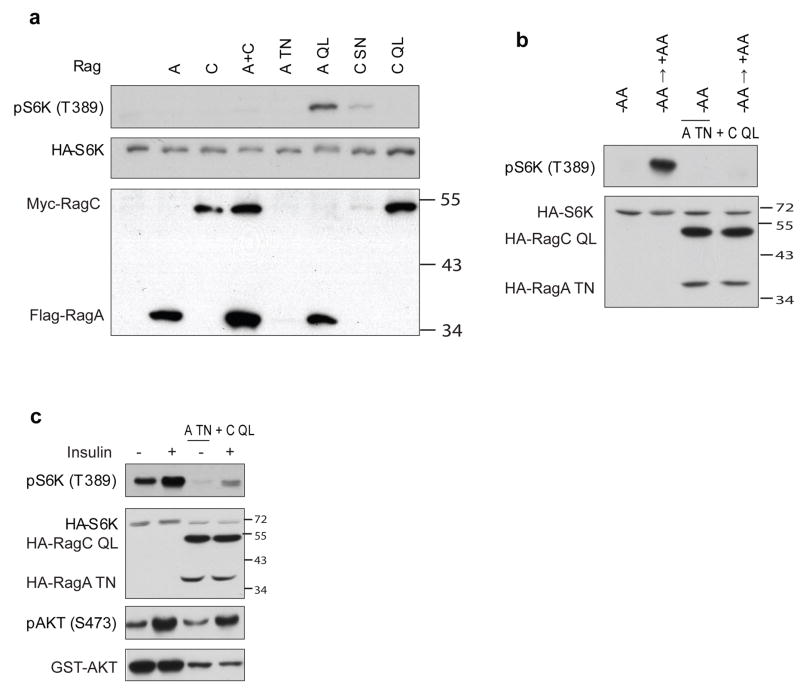
The stimulatory effect of constitutively active RagA on S6K phosphorylation was not dramatic in normal culture medium (Fig. 2). Previously, we had also observed that stimulation of S6K phosphorylation by Rheb was not dramatic in rich medium but was greatly enhanced under nutrient poor conditions34. Therefore, we tested S6K phosphorylation under amino acid deprivation. Co-expression of constitutively active RagA Q66L increased S6K phosphorylation while wild type RagA or dominant negative RagA T21N did not (Fig. 3a). Moreover, expression of RagA T21N and RagC Q120L completely blocked S6K phosphorylation in response to amino acid stimulation (Fig. 3b). Surprisingly, expression of dominant negative RagC S75N but not constitutively active RagC Q120L reproducibly increased S6K phosphorylation (Fig. 3a). Although the effect was less dramatic, given the low expression of RagC S75N, the S6K activation caused by RagC S75N was in fact rather significant. Transfection with as little as 20ng of RagA Q66L DNA strongly increased S6K phosphorylation in the absence of amino acids and this effect lasted over 12hrs (Fig. S2a, data not shown). Expression of RagA T21N strongly blocked amino acid stimulation even though the expression level was low (Fig. S2a).
Figure 3. Rag GTPases are involved in amino acid response.
(a) RagA Q66L and RagC S75N activate TORC1 in the absence of AA. 200 ng of each indicated Rag constructs was co-transfected with HA-S6K (20 ng) into HEK293 cells. Cells were AA starved for 1 h before harvest. Phosphorylation and protein levels were determined by immunoblotting with appropriate antibodies, as indicated. Molecular weights of markers are indicated on the right.
(b) RagA T21N and RagC Q120L block S6K phosphorylation in response to AA stimulation. 200 ng of pcDNA3 or each indicated Rag construct was co-transfected with HA-S6K into HEK293 cells. Cells were AA starved for 1 h (−AA) and either remained in AA starvation media or stimulated with AA containing media for 30 min (+AA) before harvest. Phosphorylation and protein levels were determined by immunoblotting with appropriate antibodies, as indicated.
(c) RagA T21N and RagC Q120L suppress the insulin stimulation on S6K phosphorylation. 200 ng of pcDNA3 or each indicated Rag construct was co-transfected with HA-S6K (20 ng) or GST-AKT (100 ng) into HeLa cells. Cells were serum starved overnight and stimulated with insulin (400 nM) for 30 min. Phosphorylation and protein levels were determined by immunoblotting with appropriate antibodies, as indicated.
We tested whether RagA Q66L can overcome inhibition by osmotic stress. As shown in Fig. S2b, osmotic stress still inhibited RagA Q66L-induced S6K phosphorylation. We found that neither RagA Q66L nor RagA T21N affected AMPK phosphorylation (data not shown), excluding an involvement of AMPK.
In the absence of amino acids, the ability of insulin to stimulate S6K was significantly compromised (Fig. S3)8, 19. We therefore examined the effect of Rag on insulin signaling. Co-expression of RagA T21N and RagC Q120L potently diminished the ability of insulin to stimulate S6K phosphorylation (Fig. 3c), similar to the results obtained under amino acid starvation conditions (Fig. S3). In contrast, the insulin-induced AKT phosphorylation was not affected by Rag (Fig. 3c). These data further support the notion that the Rag GTPases may be specifically involved in amino acid signaling.
Rag GTPases regulate cell size in Drosophila
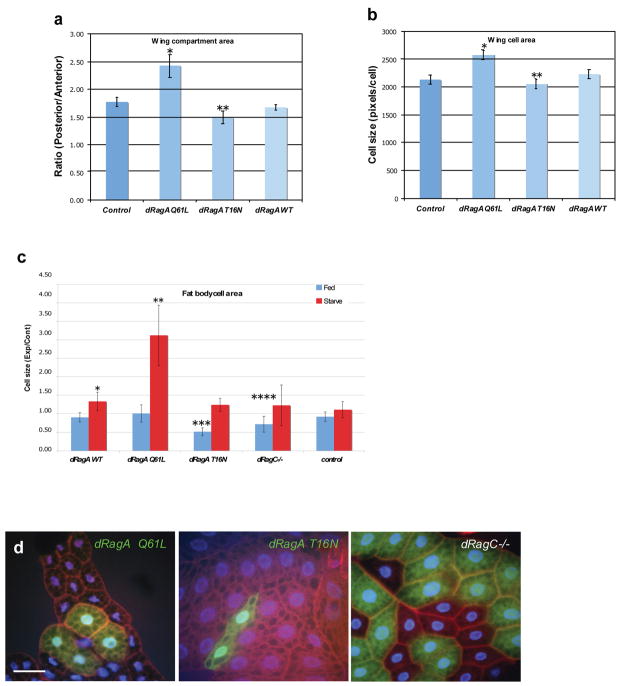
TOR signaling has been well established in the regulation of cell and organ size in Drosophila35, 36. This led us to examine the contribution of dRagA and dRagC to cell growth in vivo. dRagA wild type, constitutively active mutant dRagA Q61L, and dominant negative mutant dRagA T16N were each expressed in posterior wing compartments using the posterior driver en-GAL4. We found that expression of the constitutively active dRagA Q61L but not the wild type dRagA significantly increased posterior compartment size relative to that of the control anterior compartment (Fig. 4a). In contrast, expression of the dominant negative dRagA T16N decreased posterior wing compartment size. Consistent with these results, expression of dRagA Q61L increased individual cell size of the wing, while expression of dRagA T16N reduced cell size (Fig. 4b). We also expressed dRagA in the dorsal wing surface of the wing using the dorsal specific ap-GAL4. As predicted, expression of dRagA Q61L or dRagA T16N caused wing curvature downward or upward, respectively (Fig. S4a, b). These results support that high activity of dRagA promotes cell growth and low activity of dRagA inhibits cell growth.
Figure 4. dRagA and dRagC promote cell and organ growth in Drosophila.
(a) dRagA positively regulates wing compartment size. Wild type or mutant dRagA transgenes were expressed in posterior compartments with the en-GAL4 driver. The ratios of representative posterior to anterior compartment areas are shown. Posterior compartment area is significantly increased in response to dRagA Q61L expression and decreased in response to dRagA T16N expression. P values: *7.32e-04 (n=7), **6.18e-04 (n=12); Student’s 2-tailed t-test, where n represents number of adult wings analyzed.
(b) dRagA positively regulates wing cell size. Average area of posterior compartment cells from en-GAL4 UAS-dRagA adult wings is shown. dRagA Q61L expressing cells are significantly larger and dRagA T16N expressing cells are smaller than controls. P values: *1.15e-03 (n=7), **0.025 (n=12); Student’s 2-tailed t-test, where n represents number of adult wings analyzed.
(c, d) dRag GTPases positively regulate larval fat body cell size, (c) Cell area of clonally-induced dRagA expressing cells or dRagC homozygous mutant cells relative to neighboring wild type control cells is shown. Cell area was determined from phalloidin-stained fixed fat body samples from fed or 48 hr starved larvae. Expression of dRagA WT or dRagA Q61L significantly increases relative cell area under starvation but not fed conditions. dRagA T16N expressing cells and dRagC loss-of-function cells are significantly smaller than control cells only under nutrient replete conditions. Results are graphed as mean ± standard deviation in n samples. P values: *2.04e0-3 (n=5), **2.94e-06 (n=14), ***3.79e-07 (n=14), ****1.36e-0 (n=30)5; Student’s 2-tailed t-test. (d) Representative examples of fat body cells with altered dRagA activity. dRagA transgene expressing cells are marked by expression of GFP in the two left panels, and dRagC homozygous mutant cells are marked by absence of GFP in the right panel. Scale bar represents 50 μm.
The Drosophila larval fat body is involved in TOR-dependent nutrient sensing as well as in relaying a nutritional response during development37. We thus examined the role of dRagA in cell size regulation in this tissue on regular food or after 48-hour amino acid starvation. Under starvation conditions, clonal overexpression of wild type dRagA resulted in a modest increase in individual cell size, whereas expression of constitutively active dRagA Q61L resulted in a dramatic 3-fold increase in cell size compared to neighboring cells under starvation conditions (Fig. 4c, d). Interestingly, however, expression of wild type and dRagA Q61L had little effect on cell size under normal fed conditions (Fig. 4c), consistent with a specific effect of dRagA in nutrient response. Furthermore, expression of dRagA T16N potently decreased cell size, and this effect was visible only under nutrient sufficiency but not under nutrient starvation (Fig. 4c, d). Together, these data are consistent with the effect of RagA on S6K phosphorylation observed in mammalian cells (active RagA increases S6K in amino acid free medium and dominant negative RagA inhibits S6K in rich medium) and strongly support a role of dRagA specifically involved in nutrient response.
To investigate the function of endogenous dRag, we identified a P element insertion in the 5′ untranslated region of the dRagC gene. Animals homozygous for this insertion were found to arrest growth at the early third instar larval stage, similar to the growth arrest observed in Tor loss of function mutants36, and could be restored to viability upon mobilization of the P element (data not shown). In the larval fat body, clones of cells homozygous for this dRagC mutation showed a statistically significant reduction in cell size under fed but not starved conditions (Fig. 4c, d), highlighting a requirement for endogenous dRagC in cell growth regulation and nutrient response.
Rag and TSC1/2 function independently and in parallel to promote TORC1 signaling
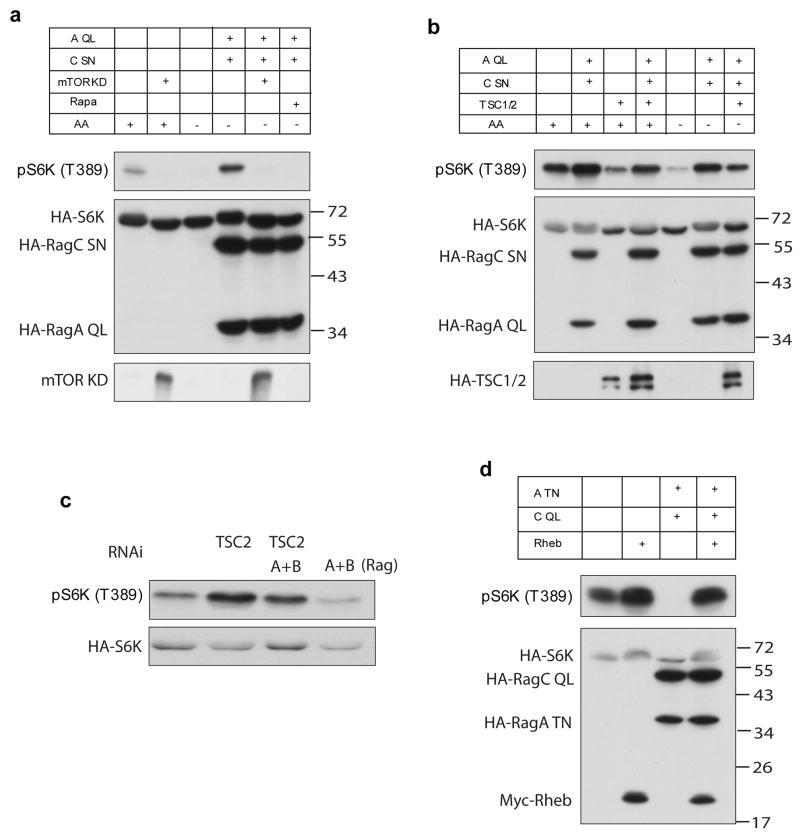
We next examined the relationship between Rag and TORC1 pathway components in further detail. In mammalian cells, rapamycin treatment completely blocked RagA Q66L/RagC S75N induced S6K phosphorylation (Fig. 5a). Consistent with this, co-expression of an mTOR kinase dead mutant (mTOR-KD) also effectively inhibited RagA Q66L/RagC S75N induced S6K phosphorylation. These results show that Rag functions upstream of mTOR. On the other hand, expression of TSC1/TSC2 partially inhibited the stimulatory effect of RagA Q66L/RagC S75N (Fig. 5b). Conversely, expression of RagA Q66L/RagC S75N partially reversed the inhibitory effect of TSC1/TSC2. To further investigate the relationship between Rag and TSC, we examined the endogenous proteins. Both RagA and RagB genes are expressed in HeLa cells (data not shown). Knockdown of both RagA and RagB decreased S6K phosphorylation and also compromised the increase of S6K phosphorylation caused by TSC2 knockdown (Fig. 5c). These results indicate that Rag and TSC1/2 may function in parallel pathways to independently regulate mTORC1 activity.
Figure 5. Relationship between Rag and components of the TOR pathway.
(a) Rag acts through TORC1 to regulate S6K phosphorylation. transfected with constructs as indicated. Co-expression of 600 ng of mTOR kinase dead (mTOR KD) construct or rapamycin treatment (20 nM, 30 min) abolished the effect of RagA Q66L and RagC S75N on S6K phosphorylation. Protein level of mTOR KD was determined by immunoblotting with anti-mTOR antibody. Molecular weights of markers are indicated on the right.
(b) RagA/RagC and TSC1/TSC2 independently regulate S6K phosphorylation. HEK293 cells were transfected with 200 ng of each Rag and/or TSC constructs as indicated. Amino acid starvation for 1 hour (−AA) is indicated. Phosphorylation and protein levels of the transfected proteins were determined by immunoblotting with appropriate antibodies, as indicated.
(c) TSC2 and RagA/B independently affect S6K phosphorylation. 20 ng of HA-S6K was transfected into HeLa cells with or without RNAi against human TSC2, RagA and RagB as indicated.
(d) RagA T21N and RagC Q120L do not block the Rheb-induced S6K phosphorylation. RagA T21N and RagC Q120L (200 ng each) were transfected into HEK293 cells with or without Rheb construct (20 ng). S6K was included in the co-transfection. Phosphorylation and protein levels of the transfected proteins were determined by immunoblotting with appropriate antibodies, as indicated.
We then tested the effect of RagA T21N on Rheb induced S6K phosphorylation. Expression of RagA T21N and RagC Q120L potently blocked basal S6K phosphorylation but did not inhibit Rheb-induced S6K phosphorylation (Fig. 5d). Amino acid starvation also failed to block the stimulatory effect of Rheb on S6K phosphorylation (data not shown). These data exclude a model that Rag functions downstream of Rheb but are consistent with Rag acting either parallel or upstream of Rheb.
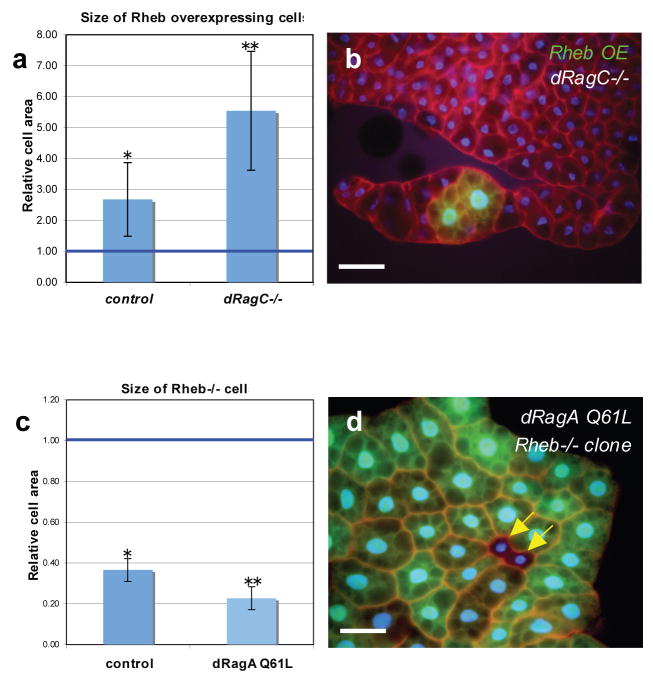
We also investigated the functional relationship between Rag and Rheb in vivo through genetic studies in Drosophila. To test whether dRagC is required for Rheb to stimulate cell growth, the effect of Rheb overexpression on fat body cell size was examined in dRagC−/− cells. Mutation of dRagC did not block the growth stimulatory effect of Rheb overexpression (Fig. 6a, b). In fact, Rheb overexpression induced a greater relative cell size increase in a dRagC−/− genetic background. Similarly, Rheb overexpression has been shown to have a stronger effect on cell size under starvation conditions38, further suggesting that nutrient signaling is impaired in dRagC mutants. We also examined the effect of Rheb loss of function under conditions of dRagA Q61L activation, and found that Rheb mutant cells were smaller than neighboring wild type cells both in control animals and in animals ubiquitously expressing dRagA Q61L throughout the fat body (Fig 6c, d). These data indicate that dRagA and dRagC are not required for Rheb to stimulate cell growth. We also found that the increase in cell size in response to dRagA Q61L expression was partially or completely suppressed in two different Rheb hypomorphic mutant backgrounds (data not shown), indicating that Rheb activity may be required for the growth effects of dRagA. Together, these data suggest that Rag acts parallel or upstream of Rheb to stimulate cell growth.
Figure 6. Rag GTPases act in parallel to Rheb to promote fat body cell growth.
(a, b) dRagC is not required for Rheb-induced cell growth. (a) Area of Rheb-overexpressing cells in control or dRagC mutant (dRagC−/−) backgrounds under fed conditions, relative to that of neighboring control cells which were assigned a value of 1. Overexpression of Rheb leads to a significant increase in cell area in both control and dRagC mutant backgrounds. *P=3.4e-02 (n=5), **P=6.1e-03 (n=5); Student’s 2-tailed t-test, where n represents number of experimental samples.. (b) A representative example of Rheb overexpressing cells in dRagC mutant background. Rheb transgene expressing cells are marked by co-expression of GFP. Cell boundaries are labeled by phalloidin staining in red; nuclei are labeled by DAPI in blue. Scale bar represents 50 μm.
(c, d) Expression of dRagA Q61L fails to rescue the growth impairment of Rheb mutant cells. (c) Relative area of clonally-induced Rheb26.2 homozygous mutant cells in a control background and in animals expressing dRagA Q61L throughout the fat body. Clonally induced Rheb26.2 homozygous mutant cells are significantly smaller than neighboring control cells both in wild type and in dRagA Q61L expressing backgrounds. *P=2.91e-04 (n=7), **P=2.59e-08 (n=5); Student’s 2-tailed t-test; fed conditions where n represents number of experimental samples. (d) A representative example of Rheb homozygous mutant cells (marked by lack of GFP, arrows) in fat body ubiquitously expressing UAS-dRagA Q61L. GFP-positive control cells in this experiment are a mixture of Rheb+/− and Rheb+/+. Scale bar represents 50 μm.
Tsc1 mutant animals die at an early larval stage due to hyperactive TOR signaling, and this lethality can be rescued by heterozygous mutation of TOR or dS6K 39, 40. Similarly, we observed that heterozygous disruption of dRagC partially suppressed the early larval lethality caused by Tsc1 mutation (Fig. S4c, d). This incomplete rescue suggests that dRagC may be somewhat responsive to Tsc1/Tsc2 signaling.
Rag proteins regulate starvation responses in Drosophila
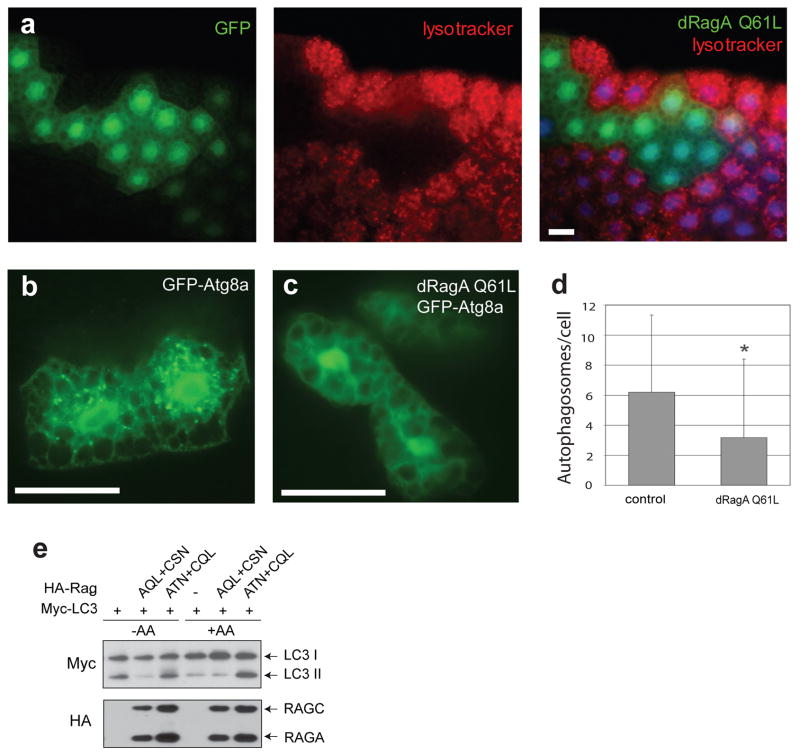
Autophagy is strongly induced in the Drosophila fat body in response to starvation, and this is dependent upon downregulation of TOR signaling. Autophagy can be readily imaged in vivo using markers such as GFP-Atg8 and Lysotracker 41. We found that overexpression of dRagA Q61L strongly inhibited starvation-induced punctate Lysotracker and GFP-Atg8a staining (Fig. 7a–d) in response to starvation in Drosophila. This observation indicates that active dRagA suppresses the nutrient starvation response, suggesting that high dRagA activity may generate false signals mimicking nutrient sufficiency, thereby suppressing autophagy.
Figure 7. Regulation of autophagy by Rag.
(a–d) dRagA Q61L suppresses autophagy. (a) Drosophila fat body cells clonally expressing dRagA Q61L (marked in green by GFP expression) fail to accumulate autolysosomes (evident in surrounding control cells by punctate Lysotracker Red staining) in response to 4-hr starvation. Nuclei are marked in blue by DAPI. (b–d) Induction of autophagosomes in response to 4-hr starvation is evident by the punctate pattern of GFP-Atg8a expression in control fat body cells (b), but not in cells expressing dRagA Q61L (c). Average number of GFP-Atg8a-marked autophagosomes per cell in control and dRagA Q61L-expressing clones is shown in (d) (*P=2.91E-06, Students two-tailed t-test for 33 fat body samples imaged per genotype). Scale bars represent 25 μm in each panel.
(e) RagA regulates LC3 conversion in mammalian cells. Myc-LC3 was co-transfected with RagA QL and RagC SN or RagA SN and RagC QL into HEK293 cells as indicated. One day after transfection, cells were cultured in amino acid sufficiency medium (+AA) or amino acid depleted medium (−AA) for 4 hours before harvesting. Western blotting for Myc-LC3 and HA-Rag were performed. Autophagic conversion of LC3I into the lipidated LC3II form is blocked by active RagA and stimulated by dominant negative RagA.
LC3, the mammalian Atg8 homolog, undergoes a set of modifications resulting in conversion from LC3I to LC3II during autophagy 42. To further test the function of Rag in autophagy, we examined the LC3 modification in HEK293 cells. Expression of RagA QL and RagC SN inhibited LC3 conversion in response to amino acid starvation (Fig. 7e). Furthermore, expression of RagA TN and RagC QL enhanced LC3 conversion even in the presence of amino acids. These results are consistent with the data observed in Drosophila and further demonstrate a role of the Rag GTPases in autophagy regulation in response to nutrient signals.
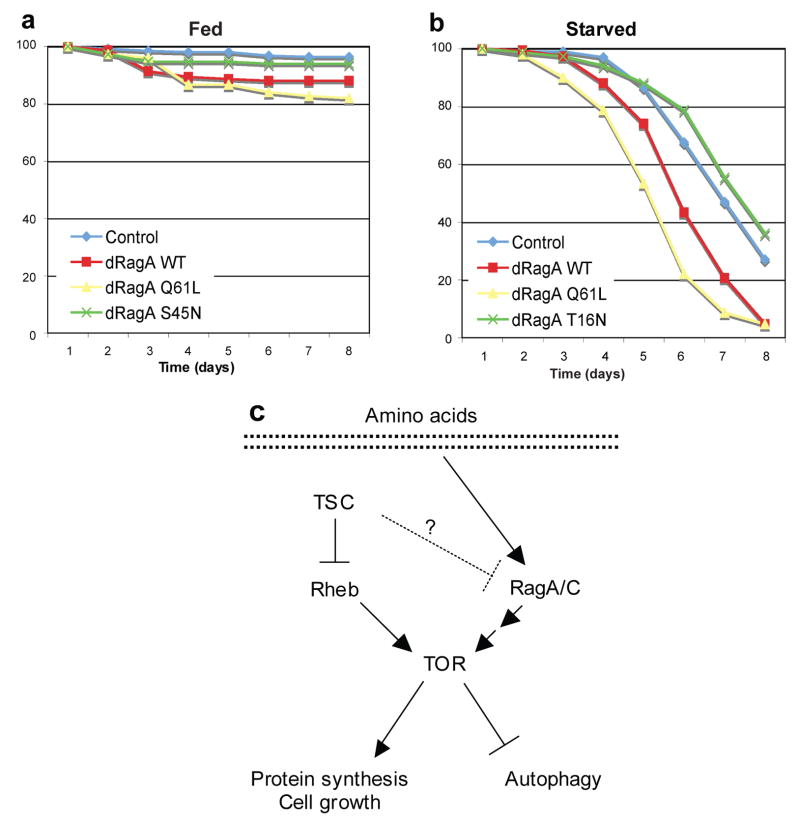
Since proper response to nutrient limitation is also important for organisms to survive under unfavorable conditions 43, 44, we investigated the effect of dRagA activity on adult animal viability in response to starvation. Targeted expression of constitutively active dRagA Q61L to the fat body had no significant effect on survival in animals given a normal diet, but resulted in a significantly accelerated rate of death under starvation conditions (Fig. 8a, b). In contrast, animals expressing the dominant negative dRagA T16N were more resistant to death induced by starvation. Similar effects on starvation survival were observed with ubiquitous expression of dRagA transgenes (data not shown). Taken together these data suggest that the activity of dRagA is important for signaling in response to nutrient starvation and also is critical for animal survival.
Figure 8. High dRagA activity sensitizes Drosophila to starvation.
(a, b) dRagA activation increases sensitivity to starvation. Expression of dRagA Q61L using the fat body-specific Cg-GAL4 driver significantly decreases survival of adult female flies under starvation (a) conditions but not fed (b) conditions, relative to controls (Cg-GAL4 alone). Asterisks indicate time points with significant difference compared to controls (*P<0.05; Students two-tailed t-test; n = 150 flies/genotype/treatment).
(c) A proposed model of Rag GTPase in regulation of TORC1 activity. Rag GTPases act independently of and in parallel to TSC-Rheb to activate TOR signaling, possibly by transducing a nutrient-dependent signal. The mechanism of TOR regulation by Rag GTPases is indirect, and likely involves additional unidentified factors.
Discussion
Amino acids are critical activators of TORC1 however the mechanism of amino acid signaling is largely unresolved. Although VPS34 was proposed to mediate nutrient signals to TOR20, 21, we recently found that Drosophila with Vps34 null mutations have normal TOR activity45. Vps34 knockdown had no effect on dS6K phosphorylation (data not shown). In this report, we have identified Rag GTPases as important novel activators of TORC1 pathway in response to amino acids both in Drosophila and in mammals. Knockdown of dRagA or dRagC dramatically decreased dS6K phosphorylation in response to amino acid stimulation. Overexpression of constitutively active dRagA Q61L increased cell size in fat body and wings, especially in starved Drosophila. Expression of dominant negative dRagA T16N decreased cell size and this effect was stronger when nutrients were sufficient. Furthermore, dRagA Q61L expression and dRagC mutation suppressed starvation-induced autophagy and the lethality of Tsc1 mutant animals, respectively. In mammalian cells, overexpression of constitutively active RagA activated TORC1 even in the absence of amino acids, and expression of dominant negative RagA blocked TORC1 activation in response to amino acid stimulation. The relationship between Rag and amino acids is rather specific because constituvely active RagA could not overcome osmotic stress.
Rag physiological role in nutrient response is further supported by the fact that flies expressing dRagA Q61L die earlier than the controls during starvation, presumably due to a failure to attenuate their metabolic activity and growth owing to a false sense of nutrient sufficiency. Additionally, animals expressing dRagA T16N are more resistant to starvation and survive longer in the absence of nutrients.
Our data indicate that dimer formation between RagA/B and RagC/D is important for TORC1 activation. Within the dimer, the function of RagA/B is dominant. In other words, RagA Q66L dominantly activates and RagA T21N dominantly inhibits TORC1 regardless of the nucleotide binding status of the RagC/D in the complex. Nevertheless, RagC/D is likely to be critical for the dimer function, given the effects of dRagC knockdown in S2 cells and the phenotypes of dRagC mutant animals. Interestingly, the yeast Gtr1 and Gtr2 need to be in GTP-bound and GDP-bound status, respectively, to function26. Our results suggest that the relationship between RagA and RagC is similar to that between Gtr1 and Gtr2. In addition, RagC may have a GTPase-independent role in stabilizing RagA and may regulate RagA localization or activity, or aid in TORC1 activation.
Studies in yeast have shown that Gtr1/Gtr2 could control intracellular protein trafficking, thereby regulating the localization of the general amino acid permease Gap126. This observation suggests a possible mechanism whereby Gtr1/2 activate TORC1 by promoting amino acid import and thus regulating nutrient availability. However, our data from mammalian cells are not consistent with this model: complete and extended amino acids depletion fails to inhibit TORC1 activity in cells overexpressing RagA Q66L. Second, we found that the amino acid import was not significantly affected by RagA expression (Fig. S5). Therefore, it is unlikely that Rag regulates TORC1 by promoting the availability of nutrients. Instead, we favor a model in which Rag acts between amino acids and TORC1 in a pathway parallel to the TSC-Rheb axis (Fig. 8c). An interesting possibility is that Rag regulates localization of TORC1 pathway components.
This study identifies Rag GTPases as novel positive regulators of TORC1 in amino acid signaling, a conclusion supported by biochemical studies in mammalian cells and genetic studies in Drosophila. Future study to elucidate the molecular mechanism of Rag in amino acid sensing and TORC1 activation will shed new insight into this important pathway.
Methods
Antibodies, Plasmids, and Reagents
Anti-Drosophila S6 kinase antibody was generously provided by Dr. Mary Stewart (University of North Dakota State University, Fargo, ND). Anti-phospho Drosophila S6K, anti-S6K, anti-phospho S6K, anti-Akt, anti-phospho Akt, and antiphospho 4EBP1 antibodies were from Cell Signaling Inc (Beverly, MA). Anti-mTOR and anti-Myc antibodies were from Santa Cruz Biotechnology (Santa Cruz, CA). Anti-HA and anti-Flag antibodies from Covance (Philadelphia, PA) and Sigma (St. Louis, MO), respectively. The cDNAs encoding human RagA and RagC were obtained from American Tissue Culture Collection (Manassas, VA) and PCR amplified. RagA was subcloned into BamHI/XhoI restriction enzyme site of pcDNA3-HA and pcDNA3-FLAG and RagC was subcloned into BamHI/EcoRI restriction enzyme site of pcDNA3-HA and Myc-pRK5 vectors. The cDNAs encoding RagB and RagD were PCR amplified from human brain cDNA library and cDNA library generated from HEK293 cells, respectively. RagB and RagD were subcloned into EcoRV/XhoI and BamHI/EcoRI site of pcDNA3-FLAG and pRK5-Myc vectors, respectively. All mutant constructs of RagA, B, C, and D were created by PCR mutagenesis and were verified by DNA sequencing. Primers used for Rag constructs cloning are listed in Supplementary Information, Table S1. All other DNA constructs, including HA-S6K, Myc-4EBP1, GST-AKT, Flag-mTOR KD, HA-TSC1, HA-TSC2, Myc-Rheb, were laboratory stock. Insulin and rapamycin were obtained from Sigma and Cell Signaling, respectively. siRNAs targeting human TSC2, RagA, and RagB were obtained from Dharmacon, Inc. (Lafayette, CO)
Cell Culture
Drosophila S2 cells (Invitrogen, Carlsbad, CA) were cultured in Drosophila SFM (Invitrogen) supplemented with L-glutamine (45ml of 200mM L-Glutamine/500ml media) in 27°C incubator. HEK293 cells and HeLa cells were cultured in Dulbecco’s modified Eagle’s medium (DMEM) (Invitrogen, Cat. No. 12430) supplemented with 10% fetal bovine serum (FBS) in 37°C humidified incubator under 5% CO2.
Amino acid (AA) containing (SDMK)- or AA free (SDMK-AA)-media used for Drosophila S2 cells were made based on Schneider’s Drosophila Medium (Invitrogen) formulation. Stocks for AA (2X), inorganic salts (2.5X), and other components (5X) were made individually and mixed together to final concentration of 1X SDMK or 1X SDMK-AA. For SDMK-AA, ddH2O was added instead of AA. Final pH and osmolality was adjusted to 6.6–6.8 and 345–365 mOsm/kg, respectively. SDMK and SDMK-AA were used for AA stimulation and AA starvation, respectively for Drosophila S2 cells.
Amino acid (AA) containing (DMEMK)- or AA free (DMEMK-AA)-media used for HEK293 and HeLa cells were made based on DMEM medium (Invitrogen, Cat. No. 12430) formulation. Stocks for AA (10X), inorganic salts and other components (2X) were made individually. For vitamins, MEM vitamin solution (Invitrogen, 100X) was used in 1:25 dilution (final concentration=4X). Stocks were mixed together to final concentration of 1X DMEMK or 1X DMEMK-AA. For DMEMK-AA, ddH2O was added instead of AA. Final pH and osmolality was adjusted to 7.0–7.4 and 295–340 mOsm/kg, respectively. DMEMK and DMEMK-AA were used for AA stimulation and AA starvation, respectively for HEK293 and HeLa cells.
RNA Interference
Drosophila RNA interference (RNAi) experiments were performed as described with minor modifications46. Briefly, primers flanked with T7 RNA polymerase binding site (GAATTAATACGACTCACTATAGGGAGA) at the 5′ end followed by gene specific sequences (Table S2) were designed to amplify approximately 600 bp of the coding region of the gene of interest. Each individual DNA fragment was amplified with this primer by PCR from Drosophila genomic DNA and resulted PCR products were purified by using the High pure PCR purification kit (Roche, Indianapolis, IN). Using the purified PCR products as templates, In vitro transcription was performed to produce dsRNA by using a MEGAscript T7 transcription kit (Ambion, Austin, TX). The transcribed RNAs were annealed in vitro by incubation at 65°C for 30 min followed by slow cooling down to room temperature. dsRNA were analyzed by 1% agarose gel electrophoresis for the integrity as well as length and quantified. Drosophila S2 cells were cultured in 12-well plates for 4 days with a starting density of 2 × 10⁵ cells per well. On days 1 and 3, 4 μg of dsRNA targeting the gene of interest was added directly to the culture wells. Cells were lysed at the end of day 4, with 150 μl per well of the mild lysis buffer (10 mM Tris-HCl [pH 7.5], 100 mM NaCl, 1% NP-40, 50 mM NaF, 2 mM EDTA [pH 8.0], 1 mM DTT, 1 mM PMSF, 10 μg/ml leupeptin, and 10 μg/ml aprotinin). Cell lysates were subjected to SDS-PAGE.
For RNAi experiments in HeLa cells, cells were diluted and plated into 6-well plates at about 30% confluency. 24 hrs later, 20 μM of siRNA (final concentration) were transfected using Lipofectamine (Invitrogen) following manufacturer’s protocol.
Transfection and Western Blot Analysis
Transfection was performed in serum-free conditions using Lipofectamine™ reagent (Invitrogen) as described by the manufacturer. Cells were lysed in mild lysis buffer (10 mM Tris-HCl [pH 7.5], 100 mM NaCl, 1% NP-40, 50 mM NaF, 2 mM EDTA [pH 8.0], 1 mM DTT, 1 mM PMSF, 10 μg/ml leupeptin, and 10 μg/ml aprotinin). Samples were resolved by SDS-PAGE, transferred to polyvinylidene difluoride membrane, and then blotted with the desired antibodies.
Drosophila Stocks and Genetic Manipulations
ESTs GH04846 and GH16429 encoding dRagA/CG11968 and dRagC/CG8707, respectively, were purchased from the Drosophila Genomics Resource Center (Bloomington, IN). Wild type and PCR-generated mutant versions of these cDNAs were subcloned into pUAST and injected into w1118 embryos by standard procedures (Model System Genomics, Duke University). P[EPgy2]EY11726 is a lethal insertion in the 5-UTR of dRagC/CG8707. Transposase-mediated excision of this line resulted in complete restoration of viability. To generate homozyogous dRagC clones, the EY11726 element was recombined with FRT42D. Clones of cells for dRagCEY11726 or Rheb2D1 mutant or expressing dRag transgenes were generated as described47. Flies were cultured on standard cornmeal/molasses/agar medium at 25 °C.
Histology and Size Quantification
Culture and starvation of larvae, fat body dissection, Texas Red-phalloidin treatment and Lysotracker staining were performed as described48. GFP-Atg8a was expressed in spontaneous larval fat body clones as described45. Images were captured using ACT1 software to run a DXM 1200 Nikon digital camera attached to a Zeiss Axioscope 2 epifluorescence microscope with Plan-Neoflar 5x and 40X objective lens. Average area of mutant and surrounding control fat body cells was determined using the histogram function of Adobe Photoshop 7.0. To quantify transgene effects on adult wing cell and compartment size, the average area and number of cells within a representative anterior region (area between wing margin and L1) and a representative posterior region (area between L3 and L4) was determined using Photoshop 7.0. Statistical analyses were performed on a minimum of six samples per genotype, and significance was determined using Student’s 2-tailed unpaired t-test.
Viability Assays
Fifty female adult flies expressing the indicated UAS-dRag transgenes using the fat body specific cg-GAL4 driver were fed on regular food for 24–48 hours post eclosion, and then transferred to vials containing either plain agar (starved) or standard fly media (fed). Viable flies were counted and transferred to fresh vials every 24 hours. These experiments were carried out in triplicate.
Supplementary Material
Acknowledgments
The authors wish to thank Drs. Ken Inoki for discussions and Mary Stewart for dS6K antibody. This work is supported by NIH grants to K.L.G. (GM62694 and CA108941) and T.P.N. (GM62509).
Footnotes
Author Contributions
K.L.G. conceived the idea of GTPase screen; K.L.G. and E.K. designed and E.K. performed the screen and mammalian experiments; P.G.H. and T.P.N. designed and performed the drosophila experiments with the assistance of E.K.; L.L. performed the LC3 experiments; K.L.G. and T.P.N. coordinated the study; K.L.G., E.K., P.G.H. and T.P.N. wrote the paper; all authors commented on the manuscript.
References
- 1.Hay N, Sonenberg N. Upstream and down stream of mTOR. Genes Dev. 2004;18:1926–1945. doi: 10.1101/gad.1212704. [DOI] [PubMed] [Google Scholar]
- 2.Wullschleger S, Loewith R, Hall MN. TOR signaling in growth and metabolism. Cell. 2006;124:471–484. doi: 10.1016/j.cell.2006.01.016. [DOI] [PubMed] [Google Scholar]
- 3.Sabatini DM, Erdjument-Bromage H, Lui M, Tempst P, Snyder SH. RAFT1: a mammalian protein that binds to FKBP12 in a rapamycin-dependent fashion and is homologous to yeast TORs. Cell. 1994;78:35–43. doi: 10.1016/0092-8674(94)90570-3. [DOI] [PubMed] [Google Scholar]
- 4.Jacinto E, et al. Mammalian TOR complex 2 controls the actin cytoskeleton and is rapamycin insensitive. Nat Cell Biol. 2004;6:1122–1128. doi: 10.1038/ncb1183. [DOI] [PubMed] [Google Scholar]
- 5.Loewith R, et al. Two TOR complexes, only one of which is rapamycin sensitive, have distinct roles in cell growth control. Mol Cell. 2002;10:457–468. doi: 10.1016/s1097-2765(02)00636-6. [DOI] [PubMed] [Google Scholar]
- 6.Sarbassov DD, et al. Rictor, a novel binding partner of mTOR, defines a rapamycin-insensitive and raptor-independent pathway that regulates the cytoskeleton. Curr Biol. 2004;14:1296–1302. doi: 10.1016/j.cub.2004.06.054. [DOI] [PubMed] [Google Scholar]
- 7.Fingar DC, Salama S, Tsou C, Harlow E, Blenis J. Mammalian cell size is controlled by mTOR and its downstream targets S6K1 and 4EBP1/elF4E. Genes Dev. 2002;16:1472–1487. doi: 10.1101/gad.995802. [DOI] [PMC free article] [PubMed] [Google Scholar]
- 8.Blommaart EF, Luiken JJ, Blommaart PJ, van Woerkom GM, Meijer AJ. Phosphorylation of ribosomal protein S6 is inhibitory for autophagy in isolated rat hepatocytes. J Biol Chem. 1995;270:2320–2326. doi: 10.1074/jbc.270.5.2320. [DOI] [PubMed] [Google Scholar]
- 9.Noda T, Ohsumi Y. Tor, a phosphatidylinositol kinase homologue, controls autophagy in yeast. J Biol Chem. 1998;273:3963–3966. doi: 10.1074/jbc.273.7.3963. [DOI] [PubMed] [Google Scholar]
- 10.Shigemitsu K, et al. Regulation of translational effectors by amino acid and mammalian target of rapamycin signaling pathways. Possible involvement of autophagy in cultured hepatoma cells. J Biol Chem. 1999;274:1058–1065. doi: 10.1074/jbc.274.2.1058. [DOI] [PubMed] [Google Scholar]
- 11.Gingras AC, Kennedy SG, O’Leary MA, Sonenberg N, Hay N. 4E-BP1, a repressor of mRNA translation, is phosphorylated and inactivated by the Akt(PKB) signaling pathway. Genes Dev. 1998;12:502–513. doi: 10.1101/gad.12.4.502. [DOI] [PMC free article] [PubMed] [Google Scholar]
- 12.Thomas G. The S6 kinase signaling pathway in the control of development and growth. Biol Res. 2002;35:305–313. doi: 10.4067/s0716-97602002000200022. [DOI] [PubMed] [Google Scholar]
- 13.Inoki K, Li Y, Zhu T, Wu J, Guan KL. TSC2 is phosphorylated and inhibited by Akt and suppresses mTOR signalling. Nat Cell Biol. 2002;4:648–657. doi: 10.1038/ncb839. [DOI] [PubMed] [Google Scholar]
- 14.Manning BD, Tee AR, Logsdon MN, Blenis J, Cantley LC. Identification of the tuberous sclerosis complex-2 tumor suppressor gene product tuberin as a target of the phosphoinositide 3-kinase/akt pathway. Mol Cell. 2002;10:151–162. doi: 10.1016/s1097-2765(02)00568-3. [DOI] [PubMed] [Google Scholar]
- 15.Potter CJ, Pedraza LG, Xu T. Akt regulates growth by directly phosphorylating Tsc2. Nat Cell Biol. 2002;4:658–665. doi: 10.1038/ncb840. [DOI] [PubMed] [Google Scholar]
- 16.Kwiatkowski DJ. Rhebbing up mTOR: new insights on TSC1 and TSC2, and the pathogenesis of tuberous sclerosis. Cancer Biol Ther. 2003;2:471–476. doi: 10.4161/cbt.2.5.446. [DOI] [PubMed] [Google Scholar]
- 17.Long X, Ortiz-Vega S, Lin Y, Avruch J. Rheb binding to mammalian target of rapamycin (mTOR) is regulated by amino acid sufficiency. J Biol Chem. 2005;280:23433–23436. doi: 10.1074/jbc.C500169200. [DOI] [PubMed] [Google Scholar]
- 18.Sancak Y, et al. PRAS40 is an insulin-regulated inhibitor of the mTORC1 protein kinase. Mol Cell. 2007;25:903–915. doi: 10.1016/j.molcel.2007.03.003. [DOI] [PubMed] [Google Scholar]
- 19.Hara K, et al. Amino acid sufficiency and mTOR regulate p70 S6 kinase and eIF-4E BP1 through a common effector mechanism. J Biol Chem. 1998;273:14484–14494. doi: 10.1074/jbc.273.23.14484. [DOI] [PubMed] [Google Scholar]
- 20.Byfield MP, Murray JT, Backer JM. hVps34 is a nutrient-regulated lipid kinase required for activation of p70 S6 kinase. J Biol Chem. 2005;280:33076–33082. doi: 10.1074/jbc.M507201200. [DOI] [PubMed] [Google Scholar]
- 21.Nobukuni T, et al. Amino acids mediate mTOR/raptor signaling through activation of class 3 phosphatidylinositol 3OH-kinase. Proc Natl Acad Sci U S A. 2005;102:14238–14243. doi: 10.1073/pnas.0506925102. [DOI] [PMC free article] [PubMed] [Google Scholar]
- 22.Nakashima N, Noguchi E, Nishimoto T. Saccharomyces cerevisiae putative G protein, Gtr1p, which forms complexes with itself and a novel protein designated as Gtr2p, negatively regulates the Ran/Gsp1p G protein cycle through Gtr2p. Genetics. 1999;152:853–867. doi: 10.1093/genetics/152.3.853. [DOI] [PMC free article] [PubMed] [Google Scholar]
- 23.Bun-Ya M, Harashima S, Oshima Y. Putative GTP-binding protein, Gtr1, associated with the function of the Pho84 inorganic phosphate transporter in Saccharomyces cerevisiae. Mol Cell Biol. 1992;12:2958–2966. doi: 10.1128/mcb.12.7.2958. [DOI] [PMC free article] [PubMed] [Google Scholar]
- 24.Nakashima N, Hayashi N, Noguchi E, Nishimoto T. Putative GTPase Gtr1p genetically interacts with the RanGTPase cycle in Saccharomyces cerevisiae. J Cell Sci. 1996;109 (Pt 9):2311–2318. doi: 10.1242/jcs.109.9.2311. [DOI] [PubMed] [Google Scholar]
- 25.Dubouloz F, Deloche O, Wanke V, Cameroni E, De Virgilio C. The TOR and EGO protein complexes orchestrate microautophagy in yeast. Mol Cell. 2005;19:15–26. doi: 10.1016/j.molcel.2005.05.020. [DOI] [PubMed] [Google Scholar]
- 26.Gao M, Kaiser CA. A conserved GTPase-containing complex is required for intracellular sorting of the general amino-acid permease in yeast. Nat Cell Biol. 2006;8:657–667. doi: 10.1038/ncb1419. [DOI] [PubMed] [Google Scholar]
- 27.Schurmann A, Brauers A, Massmann S, Becker W, Joost HG. Cloning of a novel family of mammalian GTP-binding proteins (RagA, RagBs, RagB1) with remote similarity to the Ras-related GTPases. J Biol Chem. 1995;270:28982–28988. doi: 10.1074/jbc.270.48.28982. [DOI] [PubMed] [Google Scholar]
- 28.Sekiguchi T, Hirose E, Nakashima N, li M, Nishimoto T. Novel G proteins, Rag C and Rag D, interact with GTP-binding proteins, Rag A and Rag B. J Biol Chem. 2001;276:7246–7257. doi: 10.1074/jbc.M004389200. [DOI] [PubMed] [Google Scholar]
- 29.Hirose E, Nakashima N, Sekiguchi T, Nishimoto T. RagA is a functional homologue of S. cerevisiae Gtr1p involved in the Ran/Gsp1-GTPase pathway. J Cell Sci. 1998;111 (Pt 1):11–21. doi: 10.1242/jcs.111.1.11. [DOI] [PubMed] [Google Scholar]
- 30.Giot L, et al. A protein interaction map of Drosophila melanogaster. Science. 2003;302:1727–1736. doi: 10.1126/science.1090289. [DOI] [PubMed] [Google Scholar]
- 31.Harrington LS, et al. The TSC1-2 tumor suppressor controls insulin-PI3K signaling via regulation of IRS proteins. J Cell Biol. 2004;166:213–223. doi: 10.1083/jcb.200403069. [DOI] [PMC free article] [PubMed] [Google Scholar]
- 32.Shah OJ, Wang Z, Hunter T. Inappropriate activation of the TSC/Rheb/mTOR/S6K cassette induces IRS1/2 depletion, insulin resistance, and cell survival deficiencies. Curr Biol. 2004;14:1650–1656. doi: 10.1016/j.cub.2004.08.026. [DOI] [PubMed] [Google Scholar]
- 33.Sarbassov DD, Guertin DA, Ali SM, Sabatini DM. Phosphorylation and regulation of Akt/PKB by the rictor-mTOR complex. Science. 2005;307:1098–1101. doi: 10.1126/science.1106148. [DOI] [PubMed] [Google Scholar]
- 34.Inoki K, Li Y, Xu T, Guan KL. Rheb GTPase is a direct target of TSC2 GAP activity and regulates mTOR signaling. Genes Dev. 2003;17:1829–1834. doi: 10.1101/gad.1110003. [DOI] [PMC free article] [PubMed] [Google Scholar]
- 35.Oldham S, Montagne J, Radimerski T, Thomas G, Hafen E. Genetic and biochemical characterization of dTOR, the Drosophila homolog of the target of rapamycin. Genes Dev. 2000;14:2689–2694. doi: 10.1101/gad.845700. [DOI] [PMC free article] [PubMed] [Google Scholar]
- 36.Zhang H, Stallock JP, Ng JC, Reinhard C, Neufeld TP. Regulation of cellular growth by the Drosophila target of rapamycin dTOR. Genes Dev. 2000;14:2712–2724. doi: 10.1101/gad.835000. [DOI] [PMC free article] [PubMed] [Google Scholar]
- 37.Colombani J, et al. A nutrient sensor mechanism controls Drosophila growth. Cell. 2003;114:739–749. doi: 10.1016/s0092-8674(03)00713-x. [DOI] [PubMed] [Google Scholar]
- 38.Saucedo LJ, et al. Rheb promotes cell growth as a component of the insulin/TOR signalling network. Nat Cell Biol. 2003;5:566–571. doi: 10.1038/ncb996. [DOI] [PubMed] [Google Scholar]
- 39.Radimerski T, Montagne J, Hemmings-Mieszczak M, Thomas G. Lethality of Drosophila lacking TSC tumor suppressor function rescued by reducing dS6K signaling. Genes Dev. 2002;16:2627–2632. doi: 10.1101/gad.239102. [DOI] [PMC free article] [PubMed] [Google Scholar]
- 40.Zhang Y, Billington CJ, Jr, Pan D, Neufeld TP. Drosophila target of rapamycin kinase functions as a multimer. Genetics. 2006;172:355–362. doi: 10.1534/genetics.105.051979. [DOI] [PMC free article] [PubMed] [Google Scholar]
- 41.Scott RC, Schuldiner O, Neufeld TP. Role and regulation of starvation-induced autophagy in the Drosophila fat body. Dev Cell. 2004;7:167–178. doi: 10.1016/j.devcel.2004.07.009. [DOI] [PubMed] [Google Scholar]
- 42.Klionsky DJ, Cuervo AM, Seglen PO. Methods for monitoring autophagy from yeast to human. Autophagy. 2007;3:181–206. doi: 10.4161/auto.3678. [DOI] [PubMed] [Google Scholar]
- 43.Britton JS, Lockwood WK, Li L, Cohen SM, Edgar BA. Drosophila’s insulin/PI3-kinase pathway coordinates cellular metabolism with nutritional conditions. Dev Cell. 2002;2:239–249. doi: 10.1016/s1534-5807(02)00117-x. [DOI] [PubMed] [Google Scholar]
- 44.Juhasz G, Erdi B, Sass M, Neufeld TP. Atg7-dependent autophagy promotes neuronal health, stress tolerance, and longevity but is dispensable for metamorphosis in Drosophila. Genes Dev. 2007;21:3061–3066. doi: 10.1101/gad.1600707. [DOI] [PMC free article] [PubMed] [Google Scholar]
- 45.Juhasz G, et al. The class III PI(3)K Vps34 promotes autophagy and endocytosis but not TOR signaling in Drosophila. J Cell Biol. 2008;181:655–666. doi: 10.1083/jcb.200712051. [DOI] [PMC free article] [PubMed] [Google Scholar]
- 46.Clemens JC, et al. Use of double-stranded RNA interference in Drosophila cell lines to dissect signal transduction pathways. Proc Natl Acad Sci U S A. 2000;97:6499–6503. doi: 10.1073/pnas.110149597. [DOI] [PMC free article] [PubMed] [Google Scholar]
- 47.Scott RC, Juhasz G, Neufeld TP. Direct induction of autophagy by Atg1 inhibits cell growth and induces apoptotic cell death. Curr Biol. 2007;17:1–11. doi: 10.1016/j.cub.2006.10.053. [DOI] [PMC free article] [PubMed] [Google Scholar]
- 48.Hennig KM, Colombani J, Neufeld TP. TOR coordinates bulk and targeted endocytosis in the Drosophila melanogaster fat body to regulate cell growth. J Cell Biol. 2006;173:963–974. doi: 10.1083/jcb.200511140. [DOI] [PMC free article] [PubMed] [Google Scholar]
Associated Data
This section collects any data citations, data availability statements, or supplementary materials included in this article.


