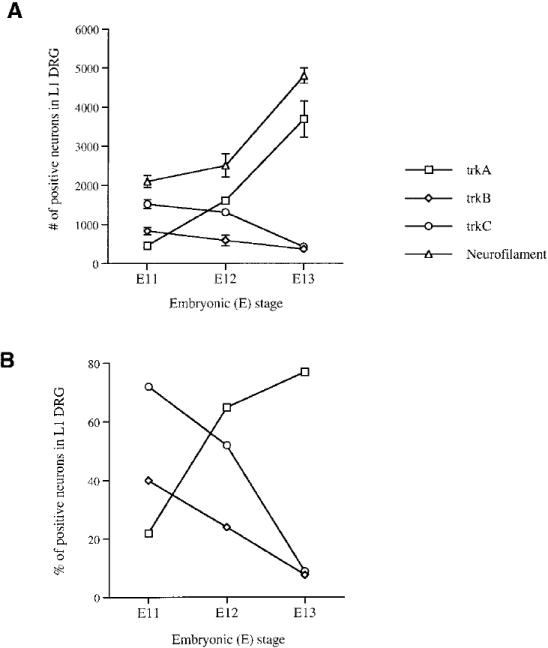
Figure 2. Development of TrkA-, TrkB-, and TrkC-Expressing Cells in Early DRGs.

(A) Graph depicts numbers of cells in the L1 DRG expressing individual Trk receptors or neurofilament antigen at E11, E12, and E13. The numbers of cells positive for each Trk were counted in the L1 DRGs of at least two different embryos. Numbers for neurofilament-expressing cells were determined earlier and published in a separate publication (Fariñas et al., 1996).
(B) Graph showing the percentage of neurons expressing each Trk in DRGs of different embryonic stages as quantified by division by the total number of neurons (neurofilament-expressing cells) present in these ganglia at each stage (Fariñas et al., 1996). Each point in the graph represents the percentage of Trk-positive neurons in the L1 ganglia.
