Abstract
An understanding of texture perception by robotic systems can be developed by examining human texture perception through a probe. Like texture perception through direct touch with the finger, texture perception by indirect means of a probe is multi-dimensional, comprising rough, hard, and sticky texture continua. In this study, we describe the individual subject variability in probe-mediated texture perception, and compare similarities and differences of texture perception between direct touch and indirect touch. The results show variability among subjects, as individual subjects may choose to rely on different degrees of three texture dimensions and do so at different scanning velocities. Despite this variability between scanning conditions within each subject, the subjects make consistently reliable discriminations of textures and subjective magnitude estimates along texture continua when indirectly exploring texture surfaces with a probe. These data contribute information that is valuable to the design of robotic sensory systems, and to the understanding of sensory feedback, which is essential in teleoperations.
Keywords: sensory feedback, tactile perception, texture, probe, tool
1. INTRODUCTION
The study of tactile perception by means of a tool has become an important aspect of somatosensory research as it has many applications in robotics, haptics, and medical instrumentation such as in teleoperations. In minimally invasive surgery (MIS) using a laparoscopic probe, surgeons rely on visual images of activity at the probe tip. However, the image of the target tissue is often restricted by surrounding tissues, serum, and blood. Instead, tactile cues transmitted through a probe, such as feedback about vibration and contact force, provide important information about tissue properties. Supporting this idea, Bholat et al. [3] report that laparoscopic instruments provide haptic feedback for texture, shape, and consistency of an object. In this study, we extend our previous work, which shows that the probe-mediated texture perception is multi-dimensional and is based on rough, hard, and sticky texture continua [28]. We here describe the factors that are involved in the perception of tactile textures, and especially focus on individual variability in haptic perception and the effect of scanning velocity on the probe-based texture perception.
The majority of psychophysical studies of texture perception fall into two broad categories: roughness perception and classification/identification of textured surfaces. In studies of roughness perception in direct touch, subjects typically scan a texture surface with one or more fingers and make judgments about the subjective roughness magnitude of the stimulus, or they are asked to scan two different texture surfaces and discriminate between them. A series of studies demonstrate that the major determining factor for perceived roughness is the groove width of grating patterns or the inter-element spacing of embossed dot patterns [4;7;8;19;21;22;24;29]. In addition to exploring roughness perception, studies have also characterized other texture dimensions such as “softness” and “stickiness”, thus suggesting that texture perception in direct touch is multi-dimensional [2;11;12]. We have recently explored the multi-dimensional nature of texture perception in our study of indirect touch by means of a probe, which shows that scanning texture surfaces with a probe yields rich multidimensional texture percepts that vary along the rough-smooth, hard-soft, and sticky-slippery continua [28]. However, the organization of texture perceptual space is different in the two modes of scanning [28].
In this study, we examine whether there are perceptual differences among subjects between two scanning conditions, how the scanning velocity might affect the vibration spectra transmitted from the probe, and, finally, how the changes in vibration spectra may have effects on the perceptual qualities of texture surfaces. The results show individual variability among subjects in perceived roughness, hardness and stickiness of textures, as well as in perceived dissimilarity of texture pairs. The dissimilarity rating differences among subjects manifest as the individual differences in the degree of linear fit to the N-dimensional MDS (multidimensional scaling) model [12;28]. In other words, certain subjects may use fewer texture dimensions than others to discriminate between different textures. Despite the use of different mean scanning velocities among subjects, perceived roughness magnitude estimates for textures are consistent among subjects, indicating the possibility of perceptual texture constancy regardless of the scanning condition.
2. PSYCHOPHYSICAL MEASURES OF TEXTURE SURFACES
Methodology for psychophysical measurements of texture perception
To quantify the degree of perceptual quality of textures, we measured subjective magnitude estimates of “dissimilarity” of texture pairs as well as “roughness,” “hardness,” and “stickiness” of individual texture surfaces. Detailed methods are described elsewhere [28]. Briefly, we asked eight subjects to rate the subjective magnitude estimates of “dissimilarity” (i.e., difference) in texture properties regardless of the texture continua, which allowed us to quantify perceptual similarities and differences of texture pairs [2;28]. These subjects were also asked to give adjective scale ratings along three primary perceptual continua, the “roughness,” “hardness,” and “stickiness” of each texture. This allowed us to determine to what extent information along these continua contributes to the perceived dissimilarity between textures. The dissimilarity task is a ratio-scale task in which the rating value of the dissimilarity varies linearly as the magnitude of the perceived dissimilarity changes.
By asking subjects to additionally rate individual textures on three different perceptual continua, we could characterize the contribution of the three perceptual continua to the dissimilarity ratings. In the previous direct touch studies, during which subjects used one or more fingers, the properties of textures have been examined with the use of “adjective” words such as “rough,” “hard,” “sticky,” “warm,” “bumpy,” “blur,” or “harsh” [9;11;12;19;21;23]. The antonyms of these terms comprise opposite texture qualities along the same texture continua. For example, the most common term for the opposite of “rough” is “smooth” and the word “sticky” pairs with “slippery,” forming each texture dimension (or axis). Similar adjectives are also used in texture perception with indirect touch by means of a probe. Our subjects gave subjective magnitude estimates (given as number ratings) of perceived roughness, hardness, and stickiness of sixteen individual textures scanned either directly with the finger or indirectly with a 3 mm-tip-diameter Delrin probe. As for the dissimilarity task, adjective rating task is also a ratio-scale task in which the rating value of the roughness, hardness, and stickiness varies linearly as the magnitude of the perceived adjective properties changes. The ratings were normalized by their mean within each block and subject.
Texture stimuli
The sixteen textures we used in this study were corduroy, denim, fleece, foam, glass, latex, nylon, organza, three types of water color papers (paper1, paper2, paper3), rubber, suede, two types of vinyl surfaces (vinyl1, vinyl2), and wood. All except three of the sixteen stimuli were mounted on 7 cm×22 cm×0.6 cm Plexiglas blocks using double-sided tape (the other three, glass, rubber, and wood, did not need to be mounted), and were placed in placed in wells milled in a 13 cm×61cm×3 cm stainless steel block and were fixed in the stimulus assembly by steel flaps (Figure 1). A curtain hung from the bottom of a 40-inch flat monitor (Dell, Inc.) between the subject and the assembly; subjects could not see the textures when they extended their hands under the curtain to explore the textures. Pink noise was provided to subjects through headphones to mask any auditory cues. A visual cue on the monitor signaled to the subject to start scanning. Subjects reported a dissimilarity number rating after scanning each texture pair in the dissimilarity task and reported a number rating on a texture continua after scanning each texture in the adjective rating task.
Figure 1.
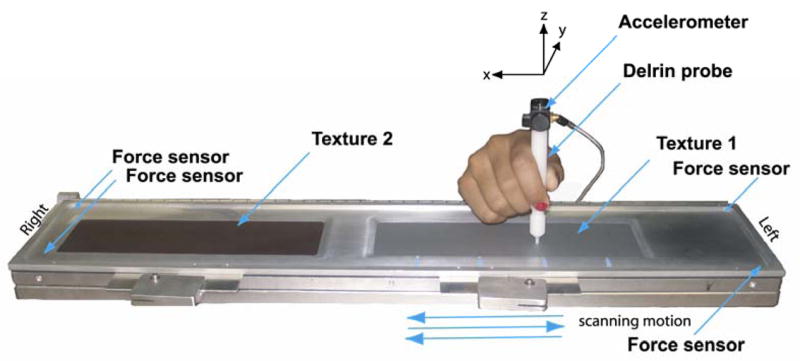
Experimenter’s view of texture apparatus. The subject places the probe (or finger) on the leftmost platform of the stimulus assembly and proceeds to scan textures placed in the apertures. The typical motion of scanning consists of a few cycles of back-and-forth motion. In the “dissimilarity” task, the subject scans Texture 1 and then Texture 2, and gives subjective magnitude ratings of perceived “dissimilarity” of texture pairs. In the perceived “roughness,” “hardness,” or “stickiness” task, the subject scans only the first texture, and gives magnitude estimate ratings. Contact force is monitored by force sensors (load cells) located at each corner of the apparatus. The vibration elicited by the probe is monitored by the tri-axial accelerometer attached to the top of the probe.
3. TEXTURE INFORMATION THROUGH A PROBE
In the psychophysical study of probe-mediated texture perception, there are many approaches to examine perceptual qualities of textures from scanning the surface with a probe. One approach is to use controlled texture surfaces with regularly spaced elements such as embossed dots or sandpapers with known sand particle sizes [4;7;8;19;21;22;24;29]. Another way is to use materials that are available in our normal environment, such as fabrics, and are therefore more relevant to day-to-day human tactile perception. For this reason, we used in our study of probe-mediated texture perception the sixteen different texture surfaces that are described in the previous section, which are all commercially available materials
We first describe the types of information one can obtain from scanning texture surfaces with a probe. When one holds a stylus-like probe and scans a surface of a texture, many different physical parameters transmitted from the probe are relevant in conveying the surface properties. Such physical parameters include vibrations, contact force perpendicular to the texture surface, tangential force along the scanning direction, and torque around the probe (i.e., differential force applied to the skin surface of different finger pads or hand regions in contact with the probe). Vibrations can be recorded by the use of an accelerometer, while texture compliance can be obtained by measuring how deep one can indent the probe into the texture per unit force. Similarly, the coefficient of friction can be obtained by measuring how fast the probe material moves by unit tangential force. Out of these parameters, vibrations could perhaps be one of the most studied parameters that convey the surface property of the textures.
Vibrations
In our study, the vibrations were measured by a tri-axial accelerometer (Kistler Inc., model 8692B5, +/− 5g range) attached to the top end of the probe (Figure 1). Textures are held in place using the apparatus shown in Figure 1. Subjects scanned texture surfaces with a 3-mm diameter tip Delrin® probe on either a single texture (Texture 1 in the figure) to rate perceived magnitude estimates of “roughness,” “hardness,”, or “stickiness,” or pairs of textures (Texture 1 and Texture 2) to rate their perceived “dissimilarity” (see Yoshioka et al., 2007 for detailed psychophysical procedures).
Scanning force was measured using four force transducers placed at the four corners of the texture apparatus (Figure 1), each possessing a sampling rate of 5000 Hz. The force data from these four transducers were then averaged. Vibration data in the form of acceleration were recorded during the period when the probe was in contact with the texture (Figure 2 second panel). Scanning velocity was then assessed. The computation of velocity from acceleration was carried out in the frequency domain by taking the Fourier transform of acceleration information first (Figure 2 third panel), and converting it to the Fourier transform of velocity (Figure 2 fourth panel). Fourier transform of velocity information was then inversely Fourier-transformed to velocity in the time domain (Figure 2 fifth panel). These processes are shown in the following mathematical steps [10].
Figure 2.
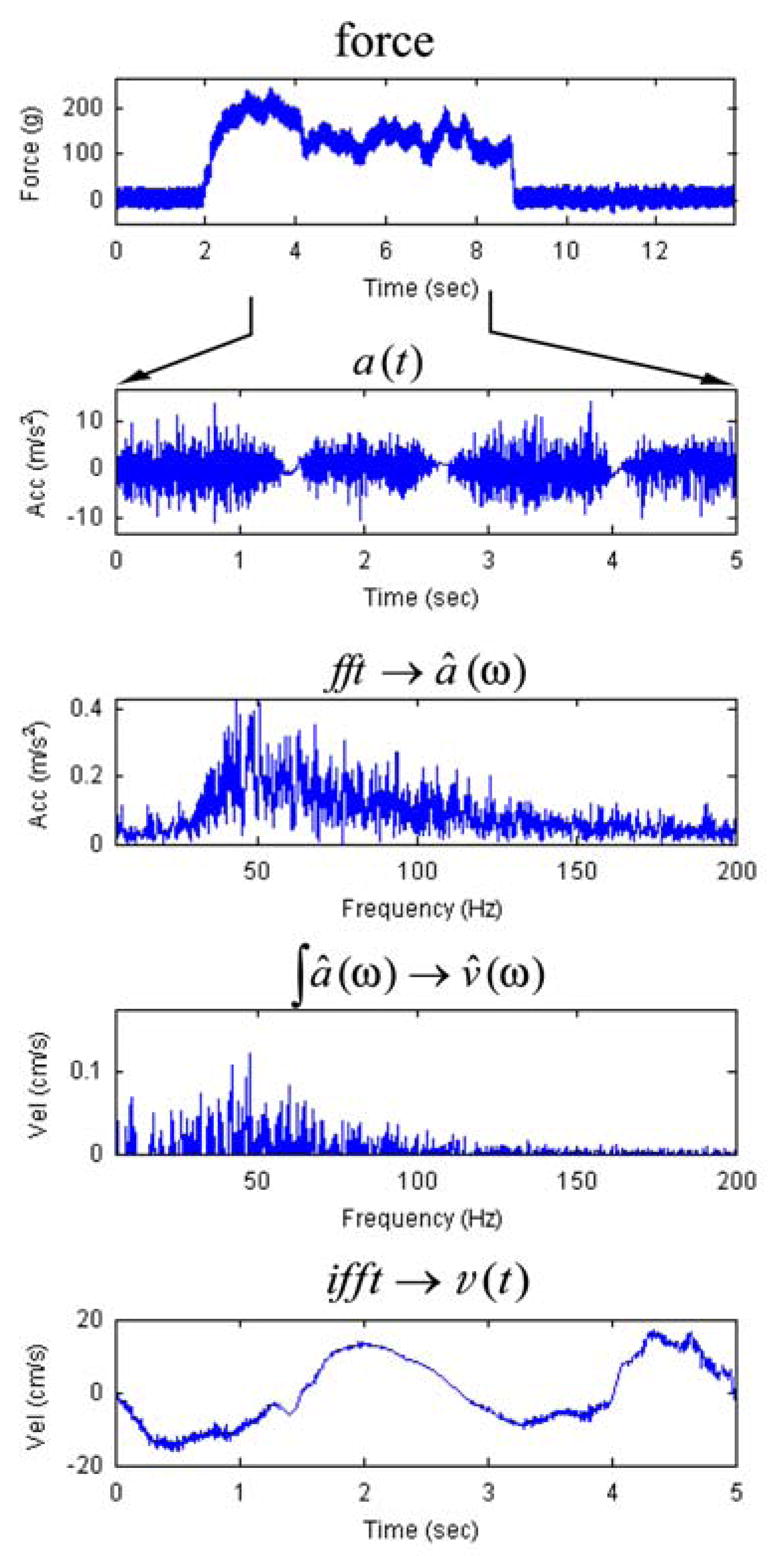
Mean contact force (top) during “free” scanning of texture surface “vinyl” by a plastic Delrin probe with 3-mm diameter tip. Vibrations are recorded with an accelerometer, and a(t) shows vibrations along the scanning direction (x-axis) in time domain. FFT of the vibration shows a broad frequency profile up to 200 Hz with a peak frequency of 40 Hz. Integrating the acceleration a(ω) yields a velocity profile in frequency domain (ω: angular frequency), which can be converted by inverse FFT to yield velocity profile, v(t), in the time domain.
| (1) |
where Fourier transform of acceleration, a(t,) in time domain t, is acceleration, â(ω), in frequency domain ω:
| (2) |
Fourier transform of velocity v is represented by v̂(ω).
| (3) |
Inverse Fourier transform of velocity v̂(ω) gives velocity in time domain, v(t).
| (4) |
One important aspect of this procedure is that the computation requires the use of a low frequency component (e.g., < 10 Hz), sometimes referred to 1/f noise [6], if one wishes to obtain a velocity profile with the slowly-changing scanning velocity. In addition, the DC signal is absent during the integration of acceleration â (ω) to compute velocity v̂ (ω) since one cannot divide acceleration â (ω) by frequency zero. Because of the absence of this DC signal, the DC offset of velocity is less certain. The post-hoc analysis of hand movement was also made in a subset of subjects (n = 3) using an analog video camera (SONY CCD-TRV68). This showed comparable velocity measures with a peak velocity of 15–20 cm/sec in each scanning direction and a mean velocity of 4–10 cm/sec. In this analysis, the analog video data were converted to the digital data files using an analog-digital converter (Pinnacle Dazzle) at the temporal resolution of approximately 30 ms.
4. PROBE-BASED TEXTURE PERCEPTION IS MULTIDIMENSIONAL
A few studies in direct touch have addressed the question of whether a single adjective term (e.g., “rough”) is adequate to describe the entire texture property or, instead, multiple adjectives are necessary to do so [9;11;12;19;21;23]. In particular, Hollins and colleagues have identified rough/smooth, hard/soft, and sticky/slippery as primary axes of multi-dimensional space for texture perception in direct touch, with sticky/slippery axis contributing the least to the overall structure of texture space [11]. In indirect touch, during which surfaces are scanned by means of a probe, a similar, but not identical, result was found [28]. Whether these three texture continua, rough-smooth, hard-soft, and sticky-slippery, are primary and independent texture dimensions can be determined by examining the orthogonality of these texture axes as illustrated in a three-dimensional texture perceptual space model (Figure 3 left panel).
Figure 3.
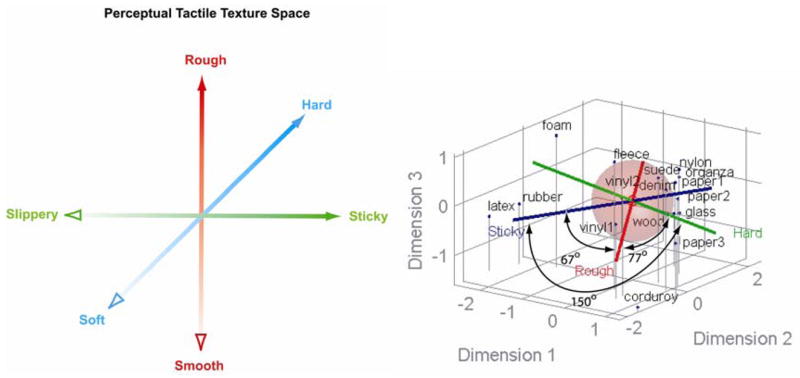
Left panel: A hypothetical model of tactile texture perceptual space based on three-dimensional rough-smooth, hard-soft, and sticky-slippery texture axes when textures are scanned by means of a probe. These axes intersect at right angles showing that the three texture dimensions are independent of each other. Right panel: Actual tactile texture perceptual space based on rough-smooth, hard-soft, and sticky-slippery texture axes when textures are scanned by means of a probe. Data are averaged for eight subjects. The angles between the intersecting axes represent the degree to which these texture dimensions are independent with each other. Modified from Yoshioka et al. (2007).
On the basis of correlating perceived dissimilarity ratings with the normalized perceived roughness ratings, we have identified that the sticky axis and rough axis are independent of each other (i.e., close to orthogonal) (Figure 3 right panel). A similar relationship also exists between the hard axis and rough axis. The extreme ends of hard and sticky axes are located on opposite sides of the texture space, reflecting the fact that rubber and latex received both high stickiness and softness ratings.
5. SUBJECT VARIABILITY IN TEXTURE PERCEPTION
5.1 Similarities and differences in multi-dimensionality of tactile texture perception among subjects and between scanning conditions
In our previous study, a model based on the MDS (multidimensional scaling) algorithm in overall subjects showed a strong fit (r2 > 0.9) when it was based on two or more arbitrary texture dimensions. We further examined the individual subject variability in the relationship between the number of dimensions in the model and the degree of linear fit. The resulting scree plots for individual subjects showed that the range of fit (r2), which also represents the subject variability, is large at low MDS model dimensions in both conditions (Figure 4). For example, the spread of the coefficient of determination (r2) is 0.16 at one dimension in the finger condition, but smaller at 2 or 3 dimensions. In the probe condition, this spread of the coefficient of determination (r2) is much larger: 0.92 at 1-D, and 0.08 at 2-D. As in the previous observations, two or more dimensions are necessary to achieve r2 higher than 0.85 in all subjects in the finger and probe scanning conditions (Figure 4). A clear difference between two modes of scanning for each subject is particularly evident with one dimensional model. Only half the subjects in the probe scanning achieved r2 higher than 0.75, whereas all subjects in the finger scanning condition achieved 0.75 or higher. This indicates that one texture dimension could provide a basis for a good fit between the model and the actual perception in the finger condition. In contrast, only half the subjects achieve the same level of the fit in the probe scanning condition.
Figure 4.
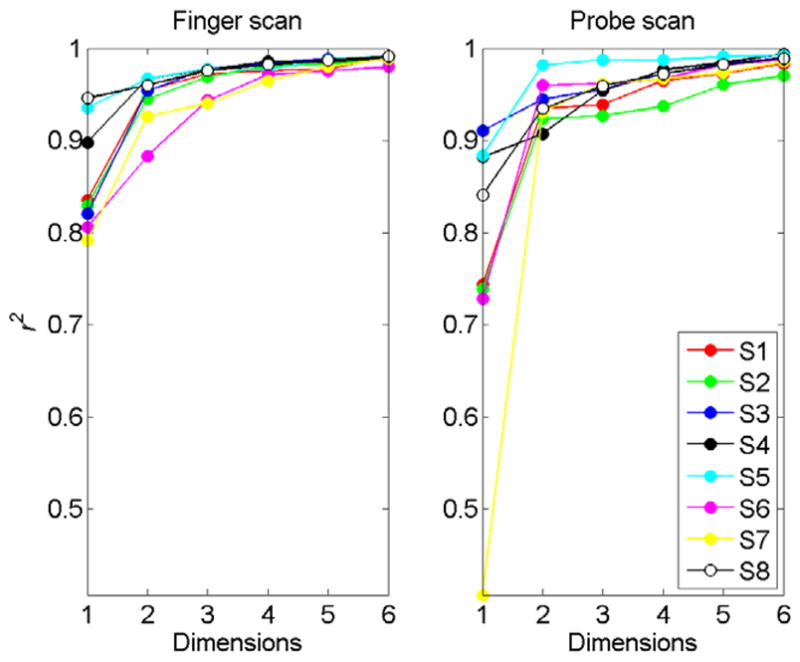
Scree plots of individual subjects (S1–S8) illustrating the coefficient of determination r2 achieved by N-dimensional MDS models. The dimensionality of the model is shown as abscissa for the coefficient of determination based on dissimilarity ratings obtained in the finger-scanning (left panel) and probe-scanning (right panel) conditions. Two or more dimensions are necessary to achieve a good fit in the finger-scanning and probe-scanning conditions at the level above r2 = 0.9. Note that many subjects in the probe scanning show lower r2 than those in the finger scanning for the 1-dimensional MDS model.
5.2 Subject variability in adjective scaling (rough, hard, sticky) between finger scan and probe scanconditions
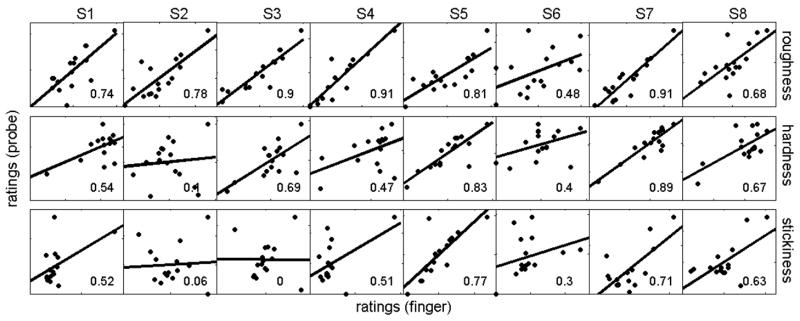
When normalized subjective magnitude estimates of perceived roughness, hardness, and stickiness were plotted between finger and probe scanning conditions among eight subjects (S1–S8; Figure 5), some subjects showed consistently high correlations across rough, hard, and sticky continua (S5 and S7), while some showed high correlations in one texture dimension, typically in roughness (S3 and S4), and while others showed marginal correlation in all adjective ratings (S6). In general, the correlation coefficient is higher for roughness measurements than for hardness and stickiness measurements. These results point to the fact that the information used to judge perceived roughness may be more similar between two modes of scanning than those used to judge hardness or stickiness.
Figure 5.
Correlation between adjective ratings (rough, hard, sticky) in finger and probe scanning conditions for eight individual subjects (S1–S8). Numbers inside each plot show the correlation coefficient between the two scanning conditions. Note the degree of variability in each subject for correlations of three adjective scaling between two scanning conditions.
6. EFFECTS OF SCANNING VELOCITY
6.1 Effects of scanning velocity on vibration spectra and vibration amplitudes
When textures are scanned with a probe at different scanning velocities, the frequency spectra transmitted through the probe will vary depending on the velocity during scanning. This change in spectra is more obvious in certain texture surfaces than others, and is demonstrated in Figure 6, in which corduroy and suede were scanned with a Delrin 3mm-diameter-tip probe at two different velocities. To record the acceleration data at constant velocities, we used a belt-conveyer apparatus that moved the textures mounted on the Plexiglas plate at velocities 40 or 80 mm/sec while a stationary probe held by the hand was pressed against the texture surfaces. Here, corduroy was moved at 40 mm/sec, and the acceleration was recorded along the scanning direction (x-axis). The corduroy sample had ridges and troughs at 3 mm intervals (i.e., 3 mm distance between one ridge to another ridge), and the expected fundamental frequency at the scanning velocity of 40 mm/sec was 13.3 Hz. The actual data show that the fundamental frequency was at 13.5 Hz, and 2nd and 3rd harmonics were at 27 and 40 Hz, respectively (Figure 6 upper 2 panels). These peaks were present in all x-, y-, and z-axis of the accelerometer, although the amplitude of each peak was slightly different depending on the axes (not shown). When the scanning velocity was doubled to 80 mm/sec, the frequency spectra shifted to a higher frequency by doubling the fundamental frequency and those of 2nd and 3rd harmonics to 27, 54, and 80 Hz (Figure 6).
Figure 6.
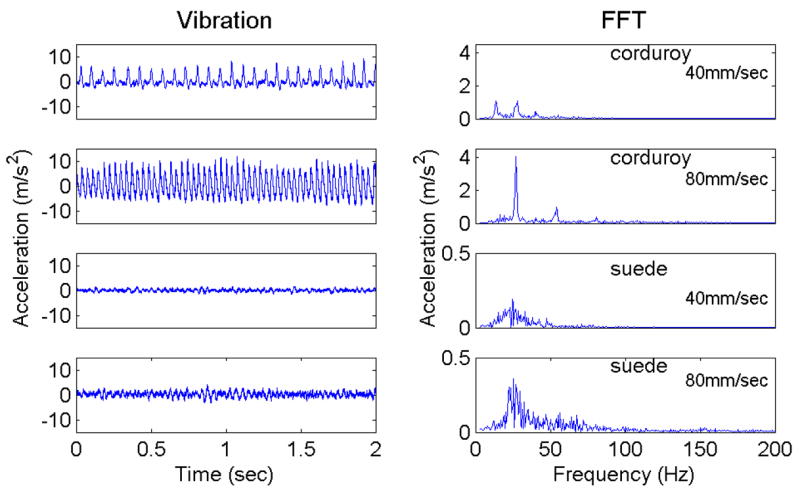
Effect of scanning velocities on the amplitudes of vibrations (i.e., acceleration; Left panels) and the corresponding FFT frequency profiles (Right panels) for corduroy and suede. Texture surfaces were scanned with a 3 mm diameter tip Delrin probe for 2 sec at the velocity of either 40 mm/sec or 80 mm/sec. Note that the amplitudes of FFT profiles and vibrations both increase by the increase of velocity from 40 mm/sec to 80 mm/sec. Fundamental frequency and 2nd and 3rd harmonics of corduroy double from 13.5, 27, and 40 Hz to 27, 54, and 80 Hz when the velocity doubles from 40mm/sec to 80mm/sec. For suede, frequency peaks do not shift to higher frequencies by the increase of velocity, whereas the amplitude of the frequency profile increases by the increase of velocity.
Acceleration-based vibrations and corresponding frequency profiles of “suede” are shown in Figure 6 in the lower 4 panels. In suede, there was no clear FFT frequency peak shift produced by doubling scanning velocity from 40 mm/sec to 80 mm/sec (Figure 6). It is most likely that the lack of spectral peak shift by changes in velocity is attributed to the probe tip size. For corduroy, the 3mm tip diameter of the Delrin plastic probe could be small enough to capture the 3 mm inter-ridge texture patterns. However, the 3 mm tip size appears to be too coarse to capture fine texture pattern of suede. In both textures, however, the increase of velocity resulted in the increase of vibration amplitudes.
6.2 Effects of scanning velocities on roughness perception
As described in the previous section, the changes in scanning velocity affect the vibration frequency spectra of some textures. Therefore, it is reasonable to conjecture that the changes in frequency spectra might affect the perceptual quality of textures. On the other hand, it is difficult to believe that, for example, touching the same cotton shirt at different velocities with the finger will change the perceived roughness of the texture. If the constancy of texture perception exists in direct touch, a similar mechanism might also exist in texture perception by means of a probe. Perceptual texture constancy implies that the perception of texture surfaces is not affected greatly by the scanning condition. We have examined the average scanning velocities of three subjects and their perceived roughness magnitude estimates (Figure 7). There was a large variability in individual scanning velocities used to explore sixteen texture surfaces (subject S1: 74 mm/s, S2: 35 mm/s, S3: 65 mm/s). Peak velocities reached 277 mm/s for S1, 141 mm/s for S2, and 276 mm/s for S3. Although subjects had different mean scanning velocities, they made consistent roughness estimates for sixteen texture surfaces. This result suggests that there is a possible mechanism underlying perceptual constancy of textures.
Figure 7.
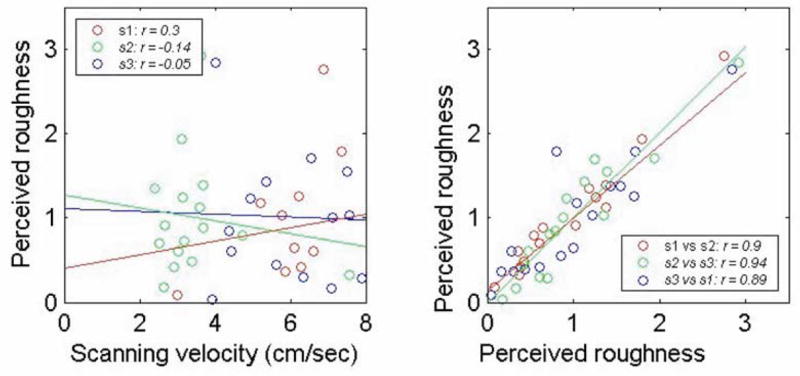
Left. Mean scanning velocity (cm/s) vs. normalized perceived roughness for sixteen texture stimuli among three subjects (S1–S3). These three subjects used different scanning velocities, and there is little correlation between the scanning velocity and perceived roughness. Right. Perceived roughness ratings are correlated between pairs of subjects. Despite the use of different mean velocities in three subjects, perceived roughness ratings are highly correlated with each other (r = 0.89–0.94).
7. CONCLUSIONS
Subjective magnitude estimates of three adjective continua (“rough”, “hard”, “sticky”) were correlated with the MDS texture perceptual space based on the perceived “dissimilarity” of texture pairs scanned by means of a probe or the finger. Our previous work has demonstrated that three physical quantities, vibration, texture compliance, and friction, carry roughness, hardness, and stickiness information, and these adjective continua are substrates to determine perceived dissimilarity of texture pairs [28]. In probe-mediated texture perception, these physical quantities can vary depending on how one scans the texture surface with a probe. If the surface is scanned rapidly, the texture surface pattern may provide higher frequency vibratory information than if the surface is scanned slowly. This also depends on the geometric relationship between the texture pattern and the probe tip size and material. Klatzky and colleagues have shown that if the probe tip size is so small that the tip touches the bottom of the inter-dot space, the magnitude of perceived roughness decreases [17].
In this study, we examined how these factors might contribute to subject performance variability in texture perception. There was variability among subjects between finger and probe scanning conditions when rating subjective magnitudes of dissimilarity for texture pairs, as well as when rating the perceived roughness, hardness and stickiness of individual textures. Despite variability in subject data in different scanning conditions, subjects were not affected in their ability to discriminate texture pairs and make judgments about the roughness of individual textures. Subject performance did not seem affected by scanning velocity of the probe when exploring texture surfaces.
In perceived roughness task, previous studies report that the major determining factor for perceived roughness is groove width of grating patterns or inter-element spacing of embossed dot patterns [4;7;8;19;21;22;24;29]. Perceived roughness is not affected by scanning velocity and only mildly affected by force [19;21], which is consistent with the results obtained in this study. In a series of studies to characterize the role of tangential force in roughness perception, Smith and his colleagues found that the oscillations in tangential force are correlated with perceived roughness, though the correlation coefficient was lower (r = 0.64) than the correlation between perceived roughness and the spatial period of embossed dot patterns (r = 0.86–0.96) [25].
A recent model for neural mechanisms of roughness perception by Johnson and colleagues proposes that the spatial distribution of activity in SA1 fibers determines perceived roughness [4;7;8;29]. Alternatively, Hollins and colleague has proposed a duplex theory of roughness perception which suggests that rough and fine texture perception are carried out respectively by the activity of both SA1 afferents and PC afferents, and their central connections [1;14]. However, Yoshioka and colleagues have demonstrated that SA1 fibers are still responsible for roughness perception down to the groove width of 100 microns using triangular and trapezoidal grating patterns as texture stimuli [29]. In texture perception explored with a probe, texture information is primarily provided by vibratory cues, since spatial information about the texture is not available. It is quite likely that SA1 afferents may not be responsible for the perception of some textures since higher frequency vibrotactile information might carry the majority of texture information. Such an idea has been proposed [13;28], although neural data have not been obtained to prove the validity of the hypothesis.
In addition to the study of roughness, Hollins and colleagues have also demonstrated that texture perception with a finger provides rich multi-dimensional texture percepts, which include the perception of surface roughness, hardness, and stickiness [2;11;12]. LaMotte and Srinivasan have demonstrated that the softness of deformable objects depends on the compliance of the objects when in contact with both the finger and a probe [18;26]. Hollins and colleagues [15] used a force-feedback virtual surface device, the Phantom (SensAble Technologies, Inc.), to study the effect of varying coefficient of friction and found that the perceived stickiness and coefficient of friction obey Stevens’ power law [27]. Roughness perception with probes has been studied by at least two groups, Lederman, Klatzky, and colleagues, and Brydges and colleagues, who have demonstrated that similar subjective roughness magnitudes are obtained when textured patterns are scanned with a probe or the bare finger [5;16;17]. However, these studies have used simple textures as stimuli (embossed dot patterns or sandpapers) rather than the range of complex texture surfaces that are likely to produce complex vibratory patterns. The current study used various texture surfaces with a wide range along different texture continua that generated broad, but distinct frequency spectra. Our study indeed shows that probe scanning yields rich multi-dimensional texture percepts that vary along the roughness/smoothness, hardness/softness, and stickiness/slipperiness continua with subject variability reflecting the different strategies individual subjects employ. Our observation that perceived roughness is not affected by different scanning velocities used by subjects is in accord with the previous reports in direct touch that perceived roughness is not affected by scanning velocity and only mildly affected by force [19;21]. In probe-mediated texture perception, the effect of roughness perception is significant only when the velocity is increased ten-fold [20]. A wide range of operating velocities to maintain steady roughness perception implies a mechanism for perceptual texture constancy. The future study is necessary to address this mechanism of texture perception by combining both psychophysical and neurophysiological studies.
Acknowledgments
We thank Justin Killebrew, Frank Dammann, Bill Nash, and Bill Quinlan for technical support; Steve Hsiao, Jim Craig, and Sliman Bensmaia for assistance with the variable aspects of this project. Supported by NIH grants NS054180, NS18787, NS34086, NS38034, and DC 00095.
Reference List
- 1.Bensmaia SJ, Hollins M. The vibrations of texture. Somatosens Mot Res. 2003;20:33–43. doi: 10.1080/0899022031000083825. [DOI] [PMC free article] [PubMed] [Google Scholar]
- 2.Bensmaia SJ, Hollins M. Pacinian representations of fine surface texture. Percept Psychophys. 2005;67:842–854. doi: 10.3758/bf03193537. [DOI] [PubMed] [Google Scholar]
- 3.Bholat OS, Haluck RS, Murray WB, Gorman PJ, Krummel TM. Tactile feedback is present during minimally invasive surgery. J Am Coll Surg. 1999;189:349–355. doi: 10.1016/s1072-7515(99)00184-2. [DOI] [PubMed] [Google Scholar]
- 4.Blake DT, Hsiao SS, Johnson KO. Neural coding mechanisms in tactile pattern recognition: the relative contributions of slowly and rapidly adapting mechanoreceptors to perceived roughness. J Neurosci. 1997;17:7480–7489. doi: 10.1523/JNEUROSCI.17-19-07480.1997. [DOI] [PMC free article] [PubMed] [Google Scholar]
- 5.Brydges R, Carnahan H, Dubrowski A. Surface exploration using laparoscopic surgical instruments: the perception of surface roughness. Ergonomics. 2005;48:874–894. doi: 10.1080/00140130500123704. [DOI] [PubMed] [Google Scholar]
- 6.Choi S, Tan HZ. Perceived Instability of VirtualHaptic Texture. I ExperimentalStudies Presence Teleoper. Virtual Environ. 2004;13:395–415. [Google Scholar]
- 7.Connor CE, Hsiao SS, Phillips JR, Johnson KO. Tactile roughness: neural codes that account for psychophysical magnitude estimates. J Neurosci. 1990;10:3823–3836. doi: 10.1523/JNEUROSCI.10-12-03823.1990. [DOI] [PMC free article] [PubMed] [Google Scholar]
- 8.Connor CE, Johnson KO. Neural coding of tactile texture: comparisons of spatial and temporal mechanisms for roughness perception. J Neurosci. 1992;12:3414–3426. doi: 10.1523/JNEUROSCI.12-09-03414.1992. [DOI] [PMC free article] [PubMed] [Google Scholar]
- 9.Gescheider GA, Bolanowski SJ, Greenfield TC, Brunette KE. Perception of the tactile texture of raised-dot patterns: A multidimensional analysis. Somatosens Mot Res. 2005;22:127–140. doi: 10.1080/08990220500262018. [DOI] [PubMed] [Google Scholar]
- 10.Greenberg MD. Foundations of Applied Mathematics. Englewood Cliffs, New Jersey: Prentice Hall, Inc; 1978. [Google Scholar]
- 11.Hollins M, Bensmaïa SJ, Karlof K, Young F. Individual differences in perceptual space for tactile textures: Evidence from multidimensional scaling. Percept Psychophys. 2000;62:1534–1544. doi: 10.3758/bf03212154. [DOI] [PubMed] [Google Scholar]
- 12.Hollins M, Faldowski R, Rao S, Young F. Perceptual dimensions of tactile surface texture: A multidimensional-scaling analysis. Percept Psychophys. 1993;54:697–705. doi: 10.3758/bf03211795. [DOI] [PubMed] [Google Scholar]
- 13.Hollins M, Lorenz F, Harper D. Somatosensory coding of roughness: the effect of texture adaptation in direct and indirect touch. J Neurosci. 2006;26:5582–5588. doi: 10.1523/JNEUROSCI.0028-06.2006. [DOI] [PMC free article] [PubMed] [Google Scholar]
- 14.Hollins M, Risner SR. Evidence for the duplex theory of tactile texture perception. Percept Psychophys. 2000;62:695–705. doi: 10.3758/bf03206916. [DOI] [PubMed] [Google Scholar]
- 15.Hollins M, Seeger A, Pelli G, Taylor R. Haptic perception of virtual surfaces: scaling subjective qualities and interstimulus differences. Perception. 2004;33:1001–1019. doi: 10.1068/p5025. [DOI] [PubMed] [Google Scholar]
- 16.Klatzky RL, Lederman SJ. Tactile roughness perception with a rigid link interposed between skin and surface. Percept Psychophys. 1999;61:591–607. doi: 10.3758/bf03205532. [DOI] [PubMed] [Google Scholar]
- 17.Klatzky RL, Lederman SJ, Hamilton C, Grindley M, Swendsen RH. Feeling textures through a probe: effects of probe and surface geometry and exploratory factors. Percept Psychophys. 2003;65:613–631. doi: 10.3758/bf03194587. [DOI] [PubMed] [Google Scholar]
- 18.LaMotte RH. Softness discrimination with a tool. J Neurophysiol. 2000;83:1777–1786. doi: 10.1152/jn.2000.83.4.1777. [DOI] [PubMed] [Google Scholar]
- 19.Lederman SJ. Tactile roughness of grooved surfaces: The touching process and the effects of macro- and microsurface structure. Percept Psychophys. 1974;16:385–395. [Google Scholar]
- 20.Lederman SJ, Klatzky RL, Hamilton CL, Ramsay GI. Perceiving surface roughness via a rigid probe: Psychophysical effects of exploration speed and mode of touch. Electronic Journal of Haptic Research. 1999;1:1–20. [Google Scholar]
- 21.Lederman SJ, Taylor MM. Fingertip force, surface geometry, and the perception of roughness by active touch. Percept Psychophys. 1972;12:401–408. [Google Scholar]
- 22.Meftah EM, Belingard L, Chapman CE. Relative effects of the spatial and temporal characteristics of scanned surfaces on human perception of tactile roughness using passive touch. Exp Brain Res. 2000;132:351–361. doi: 10.1007/s002210000348. [DOI] [PubMed] [Google Scholar]
- 23.Picard D, Dacremont C, Valentin D, Giboreau A. Perceptual dimensions of tactile textures. Acta Psychol (Amst) 2003;114:165–184. doi: 10.1016/j.actpsy.2003.08.001. [DOI] [PubMed] [Google Scholar]
- 24.Sathian K, Goodwin AW, John KT, Darian-Smith I. Perceived roughness of a grating: correlation with responses of mechanoreceptive afferents innervating the monkey's fingerpad. J Neurosci. 1989;9:1273–1279. doi: 10.1523/JNEUROSCI.09-04-01273.1989. [DOI] [PMC free article] [PubMed] [Google Scholar]
- 25.Smith AM, Chapman CE, Deslandes M, Langlais JS, Thibodeau MP. Role of friction and tangential force variation in the subjective scaling of tactile roughness. Exp Brain Res. 2002;144:211–223. doi: 10.1007/s00221-002-1015-y. [DOI] [PubMed] [Google Scholar]
- 26.Srinivasan MA, LaMotte RH. Tactual discrimination of softness. J Neurophysiol. 1995;73:88–101. doi: 10.1152/jn.1995.73.1.88. [DOI] [PubMed] [Google Scholar]
- 27.Stevens SS, Harris JR. The scaling of subjective roughness and smoothness. J Exp Psychol. 1962;64:489–494. doi: 10.1037/h0042621. [DOI] [PubMed] [Google Scholar]
- 28.Yoshioka T, Bensmaia SJ, Craig JC, Hsiao SS. Texture perception through direct and indirect touch: An analysis of perceptual space for tactile textures in two modes of exploration. Somatosens Mot Res. 2007;24:53–70. doi: 10.1080/08990220701318163. [DOI] [PMC free article] [PubMed] [Google Scholar]
- 29.Yoshioka T, Gibb B, Dorsch AK, Hsiao SS, Johnson KO. Neural coding mechanisms underlying perceived roughness of finely textured surfaces. J Neurosci. 2001;21:6905–6916. doi: 10.1523/JNEUROSCI.21-17-06905.2001. [DOI] [PMC free article] [PubMed] [Google Scholar]


