Abstract
Vascular disease is a leading cause of death and disability in the western world. Diagnosis and staging of atherosclerosis is a challenge, especially with regards to the identification of plaque vulnerability. We are developing imaging methods based upon MRI and intravascular microcoils. In order to rigorously validate our MRI imaging methods and algorithms, we have developed a new cryo-imaging system that allows one to alternately section and image the block face of tissue. We obtain 3D pathology of vessel segments excised from cadaver and we characterize the tissues of atheroma using episcopic autofluorescence and bright field microscopy images. After embedding the vessel, the block is frozen, and block face microscopic images are taken every 200µm with an image resolution of 30µm×30µm. The series of images is then corrected for uneven illumination, serially registered to one another, and the 3D vessel segment is reconstructed. Some sections are recovered and processed with histological staining for validation. Seven tissue types can be readily identified from the cryo-images: necrotic core, calcification, lipid pool, media, adventitia, fibrosis, thrombus, and normal intima. Since the whole vessel segment is available, we could register 3D data to images from MR, or other modalities, for validation. In addition, visualization tools such as multi-planar reformatting 3D rendering can be used to study 3D plaque morphology, in microscopic detail.
Keywords: Atherosclerosis, MRI, histology, cryo-imaging
1. INTRODUCTION
Cardiovascular disease (CVD) is the leading cause of death and disability in the western world, accounting for 40% of the nation’s mortality and much of its morbidity 1. The American Heart Association estimates that 13.2 million Americans have CVD. Approximately 1 in 3 initial heart attacks is fatal, and in 1 of every 6 patients who experience a heart attack, sudden death is the first, last and only symptom 2.
Atherosclerosis is a disease of the vessel wall that can cause a lumen stenosis. In the early stages, the vessel may remodel and accommodate further increases in plaque volume without compromising luminal size 3. Hence, the severity of the disease must be determined by assessing both stenosis of the lumen and the lesion’s morphology. Specifically, luminal stenosis alone has shown limited ability as a predictor of the clinical outcome and the natural history of the disease.
MRI has the advantage to permit simultaneous visualization of both the arterial lumen and vessel wall, and has also the potential to characterize atherosclerotic plaque 4−10. Major plaque components, such as the lipid core, calcification, fibrous connective tissue, and intraplaque hemorrhage/thrombus have been identified with regard to their signal intensity characteristics on dark blood T1W, T2W and PDW images 4–7,9. These black blood MRI techniques have also been shown to be useful for vessel wall area measurement 11–14, a generally-accepted direct measure of plaque burden.
We are developing new image acquisition and analysis methods. Images are acquired with MRI intravascular microcoils. We use custom-made microcoils and commercial grade catheters manufactured by Interventional Imaging Inc. (Cleveland, Ohio, USA). We are evaluating the ability of tissue classification techniques using multiple MR image types to determine tissue types in atherosclerotic plaque. Validation of MR measurements is usually done by comparing MR images to histological sections. This is fraught with problems. Histological sections are often deformed by the staining processing and the precise registration of the section with a given MR image is very difficult to achieve, and often result in approximate identification of the tissue using the plaque morphological features.
We developed an imaging platform that enables us to simultaneously obtain high quality micro-coil and surface coil images. Various images and parametric T1, T2, and proton density images are obtained at multiple known locations along the vessel with reference to a 3D fast TrueFISP acquisition that encompasses the entire vessel segment. Following MR imaging, we use a novel cryomicrotome/3D imaging device. Vessel specimens are flash frozen and the resulting block is serially cut while imaging the block face with bright field episcopic microscopy, as well as autofluorescence imaging. In the next section we describe the methodology and the image processing steps required to obtain full 3D reconstruction of the vessel specimen, as well as the semi-automatic segmentation of its main tissues. We then present some results, before discussing the main points of the proposed method.
2. METHOD
2.1. Tissue samples
Tissue samples are obtained from human cadavers within 24 hours of death. Large arteries, such as iliac, are removed and stored in a sealed container at 4°C prior to imaging. When tissues are kept this way, the MRI signal does not degrade for up to 6 days 4. Cases are mostly individuals>30 years of age and referred to the University Hospitals of Cleveland for autopsy following consent from the family; no further screening is done. Vessel segments cover a wide spectrum of atheroma lesions, as well as healthy tissue. Vessel segments from different artery locations from each cadaver can be obtained, but so far we have processed mostly iliac arteries. At least 70 cases per year, almost equally divided on gender are available to us. All cases have been referred to the University Hospitals of Cleveland for autopsy following consent from the family. We obtain approval from the Case Institutional Review Board to work with the specimens in compliance with federal, state and local laws.
2.2. MRI imaging
We have developed a platform for imaging vessels with surface coils and micro-coils (Figure 1) using three channels of a Siemens Sonata 1.5T clinical scanner. Using a design which has evolved over several months, vessels are stably mounted on a cylindrical plastic tube and bathed in medium at body temperature. The specimens in the medium and supporting rig are inserted in a transparent plastic tube and sealed (Falcon®, 50 ml polypropylene conical tubes). Images are obtained from either the micro- or surface coils, or both. This rig is easy to use and up to 50 mm of vessel can be imaged at once. Most components are made of transparent plastic, which allows one to position the vessel segment and micro-coil. The transparent medium is kept at 37°C by encasing the vessels and imaging coils inside a container with warm circulating temperature controlled water. Sufficient time is given to the specimens to reach a stable temperature. Temperature is checked manually before and after the imaging session. Off-line test showed sufficient temperature stability over several hours.
Figure 1.
Left panel shows one of the custom made microcoils and surface array coils. Middle and right panel shows a high resolution sagital image of a 3D 250µm3 isotropic data set from vessel segment. In the right panel, high signal from the microcoils can be observed. The vessel segments were position on a plastic rig plastic seen as the black thick vertical.
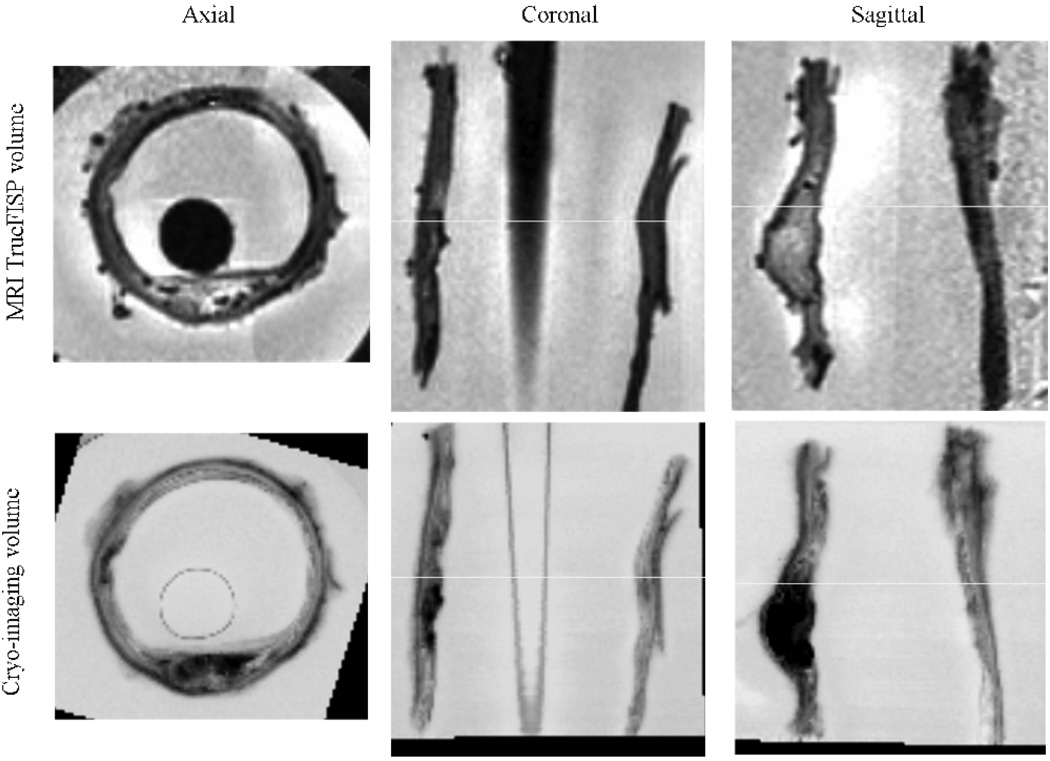
During a typical imaging session, we acquire several data sets: (1) a high resolution (0.25µm isotropic) TrueFISP volume that encompasses all specimens (Figure 1, middle and right panels; Figure 9 top images); (2) several spin echoes at different TR/TE for PD/T1/T2 parametric mapping; (3) and potentially other sequences that we want to study such as Gradient echo. Typical imaging time is 3 hours to acquire 14 slices, possibly spread over multiple vessel segments. Every image of interest can be easily referenced using the scanner parameters to the TrueFISP volume that we use in the following steps as the MRI reference to register 3D histology. Several different bath media can be used, but we chose to fill the container with Optimal Cutting Temperature (OCT) gel for easier registration as explained below. OCT gel is transparent and very viscous such that it minimizes motion from floating extravascular tissue during imaging. Tests showed that tissue signal is unchanged after several hours of immersion in the gel.
Figure 9.
Registration of MRI to Cryo-imaging. The top three panels show MRI 3D TrueFISP volume in common axial, coronal, and sagittal views. The Cryo-imaging volume was converted to gray level and registered to the MRI volume. Rigid body transformation was used (3 translations, and 3 rotations). The bottom row of three panels show the same corresponding views from the cryo-imaging data set. Slight artifacts on The MRI dataset was due to intensity inhomogeneity correction.
2.3. 3D Cryo-Imaging and Histology
Following imaging, the plastic container with the vessels is removed from the reception coils and snaps frozen in liquid nitrogen. Care is taken to keep the tube horizontal in the same orientation as during imaging. The resulting frozen cylinder of OCT with the vessel segments inside is then cut with a band saw to finally produce as many small cylinders of frozen OCT as vessel segments, each one about 10 to 20 mm long. Specimens can be kept at −80°C until further processing.
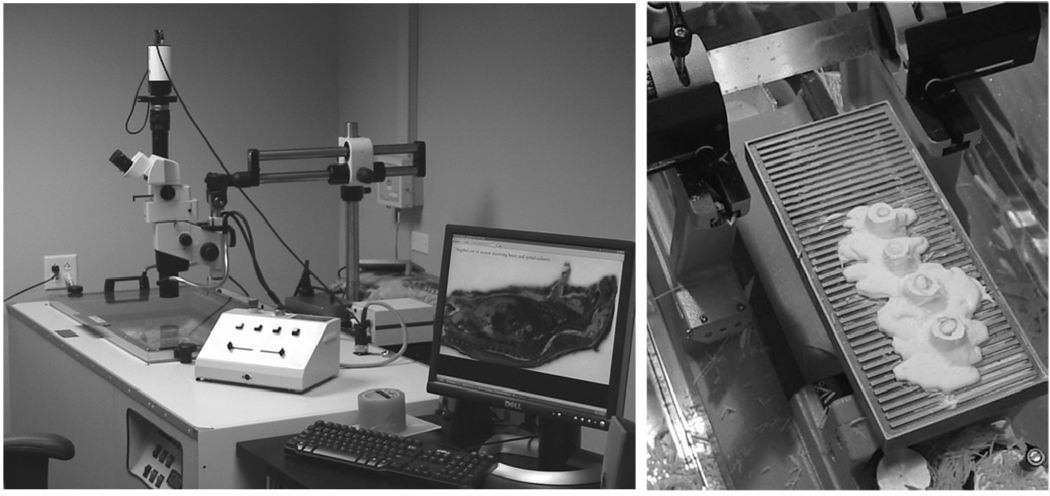
For cryo-imaging and histology, each individual vessel segment is warmed up to −20°C and mounted on the stage of a cryomicrotome (8250 Large Section Cryostat, Vibratome, St. Louis, MO). The microtome stage dimensions are up to 250mm×110mm and allow to cut several specimens at once as shown in Figure 2. Slice thickness is adjustable manually from 2µm to 40µm.
Figure 2.
Cryomicrotome setup. Left image shows the stereo microscope on top of the cryomicrotome. The right panel shows a detail of the stage with four vessel segments on the stage during slicing.
A stereo microscope can be positioned to take bright field RGB images of the face block as it is cut (left panel of Figure 2). A digital color camera can capture RGB images, using a bright light illuminator. A range of microscope magnifications are possible. Depending on the magnification, digital images have pixel sizes from 1.2×1.2µm2 to 52×52µm2. Large field of view, high resolution images are composed of tiled images. For blood vessel imaging, we typically used a magnification giving a pixel resolution of 29.3×29.3µm2 or 24×24µm2. Fluorescence imaging is also possible. We used a blue light excitation and a GFP emission filter for fluorescence imaging.
We do not add a fluorophore. We found that auto-fluorescence in combination with bright field imaging allows one to specify plaque tissues unambiguously. For fluorescence, we used a typical exposure time of 1500ms. Typical exposure time for bright field RGB imaging is about 20ms. Images of the block face are taken after every five 40µm cuts, 200µm total. We acquire thus 50 images per 10mm of vessel segment.
2.4. Tissue Identification
2.4.1. Image Preprocessing
Bright field lighting intensity inhomogeneity is corrected using a reference image technique. Subsurface signal is digitally removed. In addition to careful positioning, digital corrections are used to carefully align the stack of tissue images. Following this registration the full 3-D volume of the blood vessel segment can be reconstructed and an isotropic 3D volume is generated. Additional 3D reformatting with a resolution matching the one acquired by the 3D TrueFISP high–resolution MRI sequence is also generated for further registration with MRI. Image processing tasks were performed using Matlab (The MathWorks, Natick, MA) and Analyze Version 6.0 (AnalyzeDirect Inc., Lenexa, KS).
2.4.2. Identification of tissue types in optical images
We performed a series of experiments where we compared cryo-images to tissue sections transferred to glass slides for regular histology staining. We could then match the pictures taken with our imaging system to tissue identified under regular histopathology analysis. We used Oil-Red-O on the cryo section to identify lipids, H&E for general morphology identification of the vessel wall, Elastic Van Giesson for elastin and fibrous tissue identification, and Malory Trichrome in some cases for unambiguous fibrous tissue identification 15–18. Features in the histological sections were identified with the assistance of a board-certified pathologist (Dr. Hoffman). Histology results were compared to the cyro-imaging data. These experiments demonstrated that we could unambiguously identify the main tissue types (Media, fibrous cap, Adventitia, Fibro-Fatty plaque, Calcification, Peri-adventitia tissues, and Hemorrhage) present in the vessel wall from the cryo-images. A person trained on these validated cryo-image data can reliably segment additional cryo-images.
2.4.3. Supervised tissue classification
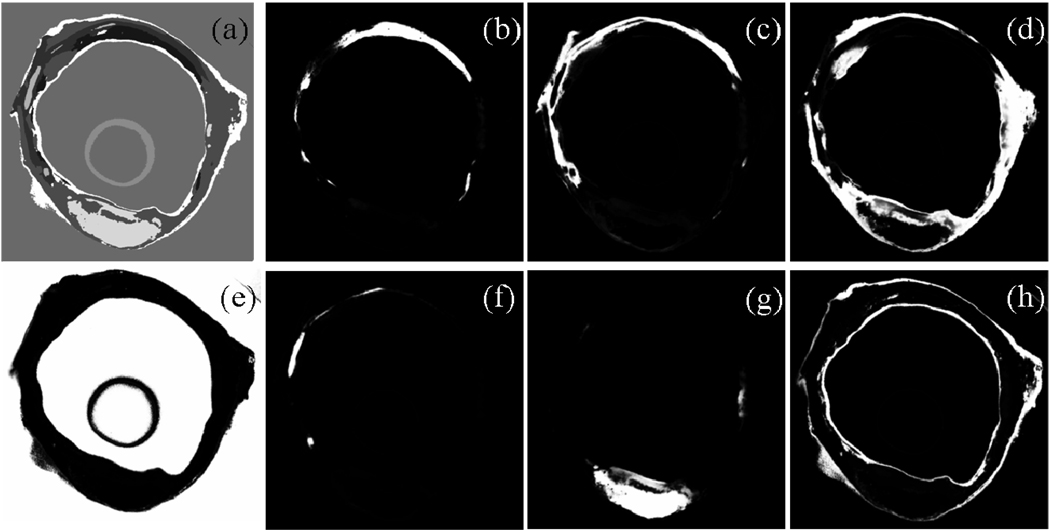
We segmented cryo-image volumes using a supervised tissue classification algorithm. Training of the algorithm is now described. In selected tissue slices, an expert drew regions of interest (ROI’s) corresponding to each tissue type. Eight different tissues types can be easily determined from image characteristics visible in bright field and autofluorescence images. Tissue types are: Adventitia (encompassing red, blood rich tissue), Media (encompassing pale tissue), Calcification, Fibro-fatty plaque, Peri-adventitial fat (very pale pink hue), and Thrombus/Hemorrhage/Necrotic core. The expert also identified a ROI corresponding to OCT medium and another for fiducial markers (e.g., the blue straw in Figure 5),
Figure 5.
3D multiplanar reformatting. Corrected images were registered and a 3D 50µm3 isotropic volume was interpolated using cubic spline interpolation. This volume could then be reformatted at arbitrary angles. Shown are axial (a), sagital (b), and coronal (c) sections.
Automatic segmentation of the tissues defined manually is then performed on the whole stack of images using a supervised fuzzy c-means algorithm (FCM). We chose FCM because it can account for the partial volume effect due to a mixture of tissue types within a pixel. Eight classes are obtained from the manually drawn ROI’s; typically each class will contain as many as 100 pixels. Since FCM is sensitive to noise, we used a modified cost function that takes spatial information into account. That is, a pixel surrounded by a given tissue should be similar to that tissue. Several modifications of the original FCM have been proposed to account for such spatial information 19,20. By analogy to the maximum likelihood method that can incorporate prior information, we modified the cost function of the FCM algorithm:
| (1) |
and the resulting update for the class membership becomes:
| (2) |
Where K=8 is the number of classes, N the number of pixels, vj the prototype of the class j, and yi the pixel intensity at pixel i. All values are vectors with four components corresponding to the three RGB planes and the green autofluorescence plane. Dij was constrained to be at least half a gray level value of the original images (q). The weights w in equation (1) and equation (2) are similar to prior probabilities and could be computed using a Markov Random Field as described in 21. However due to the large size of our data set, we used a simplified mean field approximation 22. Starting with constant and uniform weights, we iterate equation (2) with the estimation of the weights given by:
| (3) |
where Ni represents the set of eight neighbors of pixel i. Typically four iterations were necessary to reach stability of the membership estimates in about 40s for a 1360×1036 pixel images with four bands. The maximal number of iteration allowed was set to ten. Because of memory limitation, the classification was performed slice by slice as opposed to 3D. The constraint wij≠0 from equation (1) can practically be ignore when computing equation (2).
2.5. MRI/Cryo-Imaging registration
After the registration of the cryo-imaging stack of images, a 3D volume was available and could be registered to the 3D volume from the 3D TrueFISP MRI acquisition. Because little, if any deformation of the vessel segment occurred during snap freezing, we used rigid body registration as implemented in Analyze, which included three translation and three rotation parameters. In addition, to compensate for the uncertainty of the voxel size we used also three scaling parameters. A first rough manual registration was performed using interactive tools, followed by an automatic optimization of the parameters using mutual-information. The RGB cryo-imaging volume was thus converted prior to registration to a gray level volume in Analyze. Accuracy of the registration was assessed by overlapping images in different views, as well as the checkboard display and other tools available in Analyze.
3. RESULTS
Figure 3 shows the result of illumination correction. The original image in panel (a) is divided by the homogeneous white phantom shown in panel (b) to yield the corrected image shown in panel (c) where the white OCT medium has become homogeneously white across the whole image. In figure 4, the result of the subsurface signal reduction is illustrated. In panels (a) and (b) are shown the original illumination corrected RGB and the autofluorescence images. After correction the corresponding images impanel (c) and (d) present much sharper delineation of tissue, as well as a reduced bleeding of signal through the OCT medium.
Figure 3.
Intensity inhomogeneity correction. The original image shown in panel (a) presents significant intensity inhomogeneity as seen by the shadows at the corners. Panel (b) shows the reference image of white non-reflective paper, processed to reduce noise. The corrected image is in panel (c).
Figure 4.
Image deblurring. The original bright field (a) and autofluorescence (b) images are processed to reduce diffused light from inside the specimen bloc. Corrected images (c) and (d) images present sharpened edges.
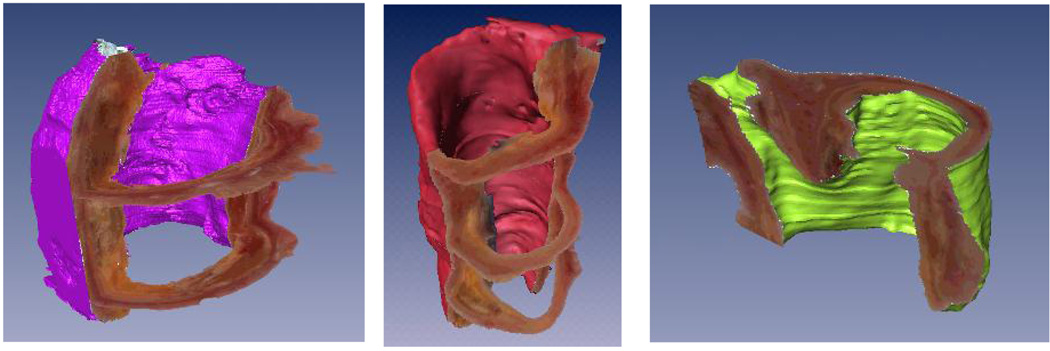
After the previous correction steps are applied to all the images, the entire stack of images can be registered to yield a 3D volume. Figure 5 shows three perpendicular views (axial, sagittal, and coronal) of a vessel segment that has been interpolated with spline interpolation to yield a 50µm3 isotropic dataset. Multiplanar reformatting of any arbitrary slice orientation can be performed to allow studying the 3D morphology of plaque features. Rendering of three different vessel segments are shown in Figure 6 where the OCT medium has been segmented out to show vessel surface boundaries.
Figure 6.
Examples of 3D reconstruction. Three vessel specimens are shown. Slices were registered, and the volume reformatted to yield 3D isotropic voxels. Rendering was performed using Amira (Mercury Computer System Inc., San Diego, CA).
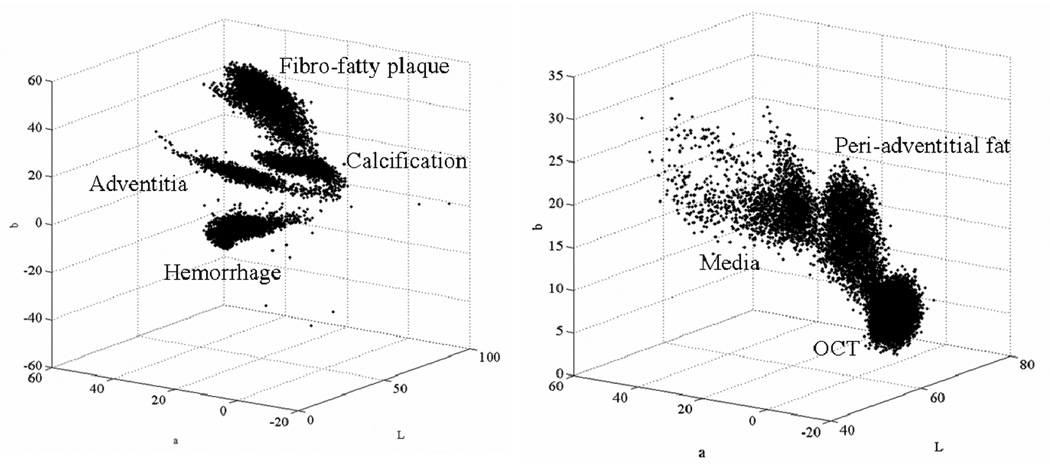
Typical ROI’s for the different tissues were manually segmented. Figure 7 shows these ROI’s in the feature space. RGB images were transformed to the Lab color space. The axis in Figure 7 are thus L, a, and b. All the selected tissues are represented by well defined clusters. The actual feature space has four dimensions since we used also autofluorescence images, but only three could be represented easily. Automatic supervised classification was subsequently performed and results are shown in Figure 8. Panel (a) shows a crisp segmentation of the eight classes, while other panels show individual membership maps. Classification results in Figure 8 were obtained from a different slice that the one where the ROI’s were manually segmented, illustrating the consistence of the signal intensity across the entire vessel segment.
Figure 7.
Tissue ROI’s in the feature space. After manual segmentation of the main tissue types, the corresponding pixels are shown here in the feature space. RGB images were transformed to the Lab color space. Axis are thus L, a, and b.
Figure 8.
Supervised tissue classification. Panel (a) shows the result of crisp segmentation with eight gray levels for the eight classes. Examples of classes are (b) Fibro-fatty plaque; (c) Media like tissue with low blood content and high autofluorescence; (d) Adventitia like tissue with high blood content; (e) OCT; (f) Calcification; (g) Old hemorrhage/Necrotic core; (h) Peri-adventitial fat/fibrous cap/Intima tissue. Classification was performed with four bands: L, a, b, and autofluorescence image.
Finally, in Figure 9 we show the result of 3D rigid body registration of the MRI and Cryo-imaging data set. Three arbitrary views (axial, coronal, and sagittal) are shown to illustrate the good matching of the vessel features.
4. DISCUSSION
We presented a method to obtain 3D volume of blood vessel segments. Vessels were snap frozen almost in the same position that they were during imaging with MRI, minimizing mis-registration between the two modalities. Using episcopic images of bright field and autofluorescence, we could identify the main tissue components present in atheromateous lesions. The alternative widely used method is to obtain thin sections (2 µm) and to perform standard histology staining. The two methods have different advantages and drawbacks.
The level of details provided by our episcopic imaging system is much less than that obtained with regular histopathology. The best resolution we could achieve with the full vessel diameter in the field of view (FOV) was 30µm. We thus could not resolve cells or extracellular structures. We are planning to automate our imaging system to be able to tile images. Potentially, a pixel resolution down to 1.2µm could be achieved using the full 90x magnification of the microscope.
Resolution is not as important as contrast to differentiate tissue types. Standard stainings such as H&E, Oil- red-O, Mallory Trichrome, etc… are far superior to achieve strong contrast and have been studied and characterized for many years. Our system could only achieve gross differentiation of tissues: fibro-fatty plaque, calcification, media, adventitia, fibrous tissue, and hemorrhage. For the task of studying MR signals, this level of differentiation is good enough and can be an efficient and valuable validation tool. We are exploring other techniques such as staining of the specimen on-block and imaging with multi-spectral filter camera with up 16 bands that could provide much more information and possibly resolve more tissue types. More work needs to be done on the tissue classification method. We found that the modified FCM algorithm presented here can achieve very good tissue typing. We are currently validating more thoroughly those results and improving our prior probability model. By using multi-spectral imaging with more bands than tissue types, other methods could be used such as spectral unmixing. Another issue that we are investigating is the blurring due to diffusion of light within the frozen block. The method we used here allows reducing significantly this problem, and others in our laboratory are working towards a more sophisticated model.
Registration becomes much easier because we acquire 3D volumes whose morphologies are almost identical to the data acquire with MRI. Matching a histological section to a MRI image is a very tedious procedure where one needs to mark the cuts and keeps track at which position the sectioning has been done. With our method we are able to register the two 3D volumes using intensity based registration (Figure 9). We are exploring non-rigid registration to account for the slight deformation that could occur during the handling and freezing of the specimen. It is still not clear that this would be necessary. Furthermore, standard histopathological slides are notoriously prone to tearing, shrinkage and deformation. Using our method the images of the vessel are free of such issues, and present the same morphology in both modalities.
With the method that we presented it takes about 2 hours to section and image a 15 mm vessel segment in 3D. It does not require chemical staining, and the imaging could be performed very quickly after imaging. We expect to decrease the imaging time significantly when our imaging system is fully automatic. Therefore, it is possible to obtain 3D rendering of tissue specimens relatively quickly and cheaply. For our application, we can study interactively the 3D morphology of plaque with computerized rendering display (Figure 5 and Figure 6). Such task might provide valuable information of the extent and formation of vulnerable plaque. Finally the method can be applied to other types of specimen. In particular we are very much interested in imaging whole mouse body.
ACKNOWLEDGEMENT
This work was supported by Ohio Wright Center of Innovation and Biomedical Research and Technology Transfer award: “The Biomedical Structure, Functional and Molecular Imaging Enterprise” and the Research Facilities Improvement Program Grant No. C06RR12463-01, NIH. We are very grateful to Dr. Robert Hoffman from the pathology department at University Hospitals of Cleveland who helped us with the histopathology analysis.
REFERENCES
- 1.Minino AM, Arias E, Kochanek KD, Murphy SL, Smith BL. Deaths: final data for 2000. National Vital Statistics Reports. 2002 Sep 16;50(15):1–119. [PubMed] [Google Scholar]
- 2.Kannel WB. Overview of atherosclerosis. Clinical Therapeutics 20 Suppl B. 1998:B2–B17. doi: 10.1016/s0149-2918(98)80027-1. [DOI] [PubMed] [Google Scholar]
- 3.Glagov S, Weisenberg E, Zarins CK, Stankunavicius R, Kolettis GJ. Compensatory enlargement of human atherosclerotic coronary arteries. New England Journal of Medicine. 1987 May 28;316(22):1371–1375. doi: 10.1056/NEJM198705283162204. [DOI] [PubMed] [Google Scholar]
- 4.Toussaint Jean Francois, LaMuraglia Glenn M, Southern James F, Fuster Valentin, Kantor Howard L. Magnetic Resonance Images Lipid, Fibrous, Calcified, Hemorrhagic, and Thrombotic Components of Human Atherosclerosis In Vivo. Circulation. 1996 Sep 1;94(5):932–938. doi: 10.1161/01.cir.94.5.932. [DOI] [PubMed] [Google Scholar]
- 5.Shinnar Meir, Fallon John T, Wehrli Suzanne, Levin Michael, Dalmacy Dolcine, Fayad ZA, Badimon Juan J, Harrington Martin, Harrington Elizabeth, Fuster Valentin. The Diagnostic Accuracy of Ex Vivo MRI for Human Atherosclerotic Plaque Characterization. Arteriosclerosis, Thrombosis, and Vascular Biology. 1999 Nov 1;19(11):2756–2761. doi: 10.1161/01.atv.19.11.2756. [DOI] [PubMed] [Google Scholar]
- 6.Fayad ZA, Fuster Valentin. Characterization of Atherosclerotic Plaques by Magnetic Resonance Imaging. Annals of the New York Academy of Sciences. 2000 May 1;902(1):173–186. doi: 10.1111/j.1749-6632.2000.tb06312.x. [DOI] [PubMed] [Google Scholar]
- 7.von Ingersleben G, Schmiedl UP, Hatsukami TS, Nelson JA, Subramaniam DS, Ferguson MS, Yuan C. Characterization of atherosclerotic plaques at the carotid bifurcation: correlation of high-resolution MR imaging with histologic analysis–preliminary study. Radiographics. 1997;17(6):1417–1423. doi: 10.1148/radiographics.17.6.9397455. [DOI] [PubMed] [Google Scholar]
- 8.Yuan Chun, Zhang Shao xiong, Polissar Nayak L, Echelard Denise, Ortiz Geraldo, Davis Joseph W, Ellington Elizabeth, Ferguson Marina S, Hatsukami Thomas S. Identification of Fibrous Cap Rupture With Magnetic Resonance Imaging Is Highly Associated With Recent Transient Ischemic Attack or Stroke. Circulation. 2002 Jan 15;105(2):181–185. doi: 10.1161/hc0202.102121. [DOI] [PubMed] [Google Scholar]
- 9.Yuan Chun, Mitsumori Lee M, Ferguson Marina S, Polissar Nayak L, Echelard Denise, Ortiz Geraldo, Small Randy, Davies Joseph W, Kerwin William S, Hatsukami Thomas S. In vivo accuracy of multispectral magnetic resonance imaging for identifying lipid-rich necrotic cores and intraplaque hemorrhage in advanced human carotid plaques. Circulation. 2001 Oct 23;104(17):2051–2056. doi: 10.1161/hc4201.097839. [DOI] [PubMed] [Google Scholar]
- 10.Cai Jian Ming, Hatsukami Thomas S, Ferguson Marina S, Small Randy, Polissar Nayak L, Yuan Chun. Classification of Human Carotid Atherosclerotic Lesions With In Vivo Multicontrast Magnetic Resonance Imaging. Circulation. 2002 Sep 10;106(11):1368–1373. doi: 10.1161/01.cir.0000028591.44554.f9. [DOI] [PubMed] [Google Scholar]
- 11.Fayad ZA, Nahar T, Fallon JT, Goldman M, Aguinaldo JG, Badimon JJ, Shinnar M, Chesebro JH, Fuster Valentin. In vivo magnetic resonance evaluation of atherosclerotic plaques in the human thoracic aorta: a comparison with transesophageal echocardiography. Circulation. 2000;101(21):2503. doi: 10.1161/01.cir.101.21.2503. [DOI] [PubMed] [Google Scholar]
- 12.Zhang S, Hatsukami TS, Polissar NL, Han C, Yuan C. Comparison of carotid vessel wall area measurements using three different contrast-weighted black blood MR imaging techniques. Magn Reson.Imaging. 2001;19(6):795–802. doi: 10.1016/s0730-725x(01)00408-8. [DOI] [PubMed] [Google Scholar]
- 13.Yuan C, Beach KW, Smith LH, Jr, Hatsukami TS. Measurement of atherosclerotic carotid plaque size in vivo using high resolution magnetic resonance imaging. Circulation. 1998 Dec 15;98(24):2666–2671. doi: 10.1161/01.cir.98.24.2666. [DOI] [PubMed] [Google Scholar]
- 14.Yuan C, Lin E, Millard J, Hwang JN. Closed contour edge detection of blood vessel lumen and outer wall boundaries in black-blood MR images. Magn Reson.Imaging. 1999;17(2):257–266. doi: 10.1016/s0730-725x(98)00162-3. [DOI] [PubMed] [Google Scholar]
- 15.Cappendijk VC, Cleutjens KB, Heeneman S, Schurink GW, Welten RJ, Kessels AG, van Suylen RJ, Daemen MJ, van Engelshoven JM, Kooi ME. In vivo detection of hemorrhage in human atherosclerotic plaques with magnetic resonance imaging. J.Magn Reson.Imaging. 2004;20(1):105–110. doi: 10.1002/jmri.20060. [DOI] [PubMed] [Google Scholar]
- 16.Clarke Sharon E, Hammond Robert R, Mitchell J Ross, Rutt Brian K. Quantitative assessment of carotid plaque composition using multicontrast MRI and registered histology. Magnetic Resonance in Medicine. 2003;50(6):1199–1208. doi: 10.1002/mrm.10618. [DOI] [PubMed] [Google Scholar]
- 17.Kampschulte A, Ferguson MS, Kerwin WS, Polissar NL, Chu B, Saam T, Hatsukami TS, Yuan C. Differentiation of intraplaque versus juxtaluminal hemorrhage/thrombus in advanced human carotid atherosclerotic lesions by in vivo magnetic resonance imaging. Circulation. 2004 Nov 16;110(20):3239–3244. doi: 10.1161/01.CIR.0000147287.23741.9A. [DOI] [PubMed] [Google Scholar]
- 18.Saam T, Ferguson MS, Yarnykh VL, Takaya N, Xu D, Polissar NL, Hatsukami TS, Yuan C. Quantitative evaluation of carotid plaque composition by in vivo MRI. Arterioscler.Thromb.Vasc.Biol. 2005;25(1):234–239. doi: 10.1161/01.ATV.0000149867.61851.31. [DOI] [PubMed] [Google Scholar]
- 19.Ahmed MN, Yamany SM, Mohamed N, Farag AA, Moriarty T. A modified fuzzy c-means algorithm for bias field estimation and segmentation of MRI data. IEEE Transactions on Medical Imaging. 2002;21(3):193–199. doi: 10.1109/42.996338. [DOI] [PubMed] [Google Scholar]
- 20.Pham DL. Fuzzy clustering with spatial constraints. 2002;2:II–65. [Google Scholar]
- 21.Held K, Kops ER, Krause BJ, Wells WM, III Kikinis, R, Muller-Gartner H-W. Markov random field segmentation of brain MR images. Medical Imaging, IEEE Transactions on. 1997;16(6):878–886. doi: 10.1109/42.650883. [DOI] [PubMed] [Google Scholar]
- 22.Van Leemput K, Maes F, Vandermeulen D, Suetens P. Automated model-based tissue classification of MR images of the brain. Medical Imaging, IEEE Transactions on. 1999;18(10):897–908. doi: 10.1109/42.811270. [DOI] [PubMed] [Google Scholar]


