

Abstract
Angiotensin converting enzyme (ACE) 2 activity and angiotensin-(1-7) [Ang-(1-7)] levels are increased in experimental cirrhosis; however, the pathways of hepatic Ang-(1-7) production have not been studied. This study investigated the role of ACE2, ACE, and neutral endopeptidase (NEP) in the hepatic formation of Ang-(1-7) from angiotensin I (Ang I) and Ang II and their effects on portal resistance. Ang I or Ang II were administered to rat bile duct ligated (BDL) and control livers alone and in combination with the ACE inhibitor lisinopril, the ACE and NEP inhibitor omapatrilat, or the ACE2 inhibitor MLN4760 (n = 5 per group). BDL markedly upregulated ACE, ACE2, and NEP. Ang-(1-7) was produced from Ang II in healthy and in BDL livers and was increased following ACE inhibition and decreased by ACE2 inhibition. In contrast, Ang-(1-7) production from Ang I was minimal and not affected by ACE or NEP inhibition. Surprisingly, ACE2 inhibition in BDLs dramatically increased Ang-(1-7) production from Ang I, an effect abolished by ACE2/NEP inhibition. Ang II and Ang I induced greater portal pressure increases in BDL livers than controls. The effects of Ang I were closely correlated with Ang II production and were strongly attenuated by both ACE and ACE/NEP inhibition. These findings show that the major substrate for hepatic production of Ang-(1-7) is Ang II and this is catalyzed by ACE2. Ang I is largely converted to Ang II by ACE, and net conversion of Ang I to Ang-(1-7) is small. NEP has the ability to generate large amounts of Ang-(1-7) in the BDL liver from Ang I only when ACE2 activity is greatly decreased or inhibited.
Keywords: hepatic fibrosis, neutral endopeptidase, hepatic resistance, angiotensin peptide metabolism, angiotensin converting enzyme
traditionally, the renin angiotensin system (RAS) has been viewed as a simple enzymatic pathway that plays a central role in cardiovascular homeostasis via the formation of the potent vasoconstrictor angiotensin II (Ang II). The discovery of angiotensin 1-7 [Ang-(1-7)], a peptide with opposing actions to Ang II, made it clear that the system is more complex than previously thought (10, 36). Early studies by Ferrario and colleagues (6, 28) demonstrated that Ang-(1-7) increased vasopressin release. Since then, a large body of evidence indicates that this peptide also has important direct vasodilatory and antifibrotic effects which counteract the effects of Ang II in a number of tissues including the heart and kidney (20, 29, 33).
Early studies showed that Ang-(1-7) can be generated from Ang I by the actions of endopeptidases such as prolyl oligopeptidase (27) and thimet oligopeptidase (7) in tissue, and in the circulation by neutral endopeptidase (NEP) (38). Although the various endopeptidases have been shown to produce Ang-(1-7) depending on their tissue localization and access to substrates, emerging evidence suggests that angiotensin converting enzyme (ACE) 2, a homologue of ACE, but with distinct enzyme activity (37), plays a key role in Ang-(1-7) production in several tissues. ACE2 is able to generate Ang-(1-7) from Ang I indirectly through biologically inactive intermediary peptide Ang-(1-9); however, in comparison, ACE2 has an ∼400-fold higher substrate preference for Ang II (35), which suggests that ACE2 is important not only for production of Ang-(1-7) but also in degrading Ang II (Fig. 1).
Fig. 1.

Schematic representation of the pathways responsible for the generation of antifibrotic peptide angiotensin-(1-7) [Ang-(1-7)] in rat liver. The thickness of the arrows represents the relative contribution of each pathway for ex vivo formation of Ang-(1-7) from the substrates angiotensin I (Ang I) and angiotensin II (Ang II). The dashed line indicates an efficient pathway to generate Ang-(1-7) directly from Ang I by the action of neutral endopeptidase (NEP), but it appears that this pathway is masked by ACE2. Ang-(1-9), angiotensin-(1-9); Ang-(1-5), angiotensin-(1-5); ACE, angiotensin converting enzyme; ACE2, angiotensin converting enzyme 2.
Several in vivo and in vitro studies have shown Ang-(1-7) has vasodilatory effects in a number of vascular beds and is antifibrotic in the heart and kidney (4, 14, 21). However, the predominant biochemical pathways responsible for the generation of Ang-(1-7) and modulating local generation of Ang II and Ang-(1-7) vary in different tissues (11, 19, 32, 34). All of the key components of the RAS including ACE and ACE2 are present in the normal liver and are upregulated in response to chronic liver injury with growing evidence that the intrahepatic RAS plays important roles in both the pathophysiology of portal hypertension and liver fibrosis. We have also shown that the circulating Ang-(1-7) is elevated in rats with experimental liver fibrosis (12). However, the major pathways responsible for the generation of Ang-(1-7) in healthy and diseased rat liver have not been determined.
We have therefore used the in situ perfused rat liver preparation to elucidate the major pathway(s) that might be responsible for Ang-(1-7) production in both healthy and fibrotic rat liver. These studies also enabled us to examine the effects of inhibition of enzymes involved in the formation of angiotensin peptides on intrahepatic resistance.
MATERIALS AND METHODS
Chemicals and drugs.
Aprotinin, N-ethylmaleimide, and protease inhibitor cocktail were purchased from Sigma-Aldrich, Sydney, Australia. MLN4760 was provided by Millennium Pharmaceuticals, Cambridge, MA. Omapatrilat was provided by Bristol-Myers Squibb, Princeton, NJ. Angiotensin peptides were purchased from Auspep, Parkville, Victoria, Australia.
Animal model of hepatic fibrosis.
Experimental procedures were approved by the Animal Ethics Committee of Austin Health and performed according to the National Health and Medical Research Council of Australia Guidelines for animal experimentation and the principles of the Helsinki declaration. Eight-week-old male Sprague-Dawley rats (300–350 g) were housed in a controlled environment (12-h light-dark, temperature 22°C to 24°C), and fed standard rat chow (Norco, Lismore, NSW, Australia) and water ad libitum. After 1 wk of acclimatization, the rats were anesthetized with an intraperitoneal injection of ketamine-xylazine mixture (75 and 5 mg/kg body wt, respectively; Therapon, Victoria, Australia) and given a single dose of carprofen (5 mg/kg, Lyppard Victoria, Victoria, Australia) subcutaneously prior to surgery to limit postoperative discomfort. Bile duct ligation (BDL) was performed as previously described (12). Briefly, a midline abdominal incision was made, and the common bile duct was doubly ligated with 4-0 silk and transected between the two ligations. The abdominal wall was closed in two layers. After 4 wk of bile duct obstruction, rats were prepared for liver perfusion experiments as described below. We have previously shown that the livers of BDL rats 4 wk after surgery displayed extensive liver fibrosis accompanied by significantly elevated plasma γ-glutamyl transpeptidase, alanine aminotransaminase, alkaline phosphatase, and bilirubin levels (12).
Histological assessment of liver injury and fibrosis.
We used hematoxylin and eosin (HE) and picrosirius red (Polysciences, Warrington, PA) to stain 4-μm sections of liver mounted on silane-coated glass slides. HE-stained liver sections were assessed for Ishak fibrosis score to determine the extent of liver injury as described previously (13). Briefly, a score of 0–1 was assigned for no fibrosis to occasional fibrous tissue and a score of 5–6 for incomplete cirrhosis to definite cirrhosis. Collagen content of the liver was quantified by a computerized quantification of picrosirius red staining as described previously (16). Picrosirius staining was assessed at ×100 magnification in a total of 10 fields per animal by using computerized image capture (MCID, Imaging Research, St. Catharines, Ontario, ON, Canada) and averaged to yield a single observation. Results are expressed as percentage stained in the given area.
In situ perfused rat liver preparation.
In situ rat liver perfusion was performed as previously described (12). Briefly, the rat was anesthetized with intraperitoneal administration of pentobarbital (60 mg/kg body wt, Boehringer Ingelheim, Artarmon, NSW, Australia). The abdominal and thoracic cavities were opened and the portal vein and supradiaphragmatic inferior vena cava (IVC) were cannulated following occlusion of the IVC above the right renal vein. During portal vein cannulation, the liver was flushed with heparinized (400 IU) saline. Following surgery, the rat was transferred to a thermostatically controlled cabinet and kept at 37.5 ± 0.5°C. Livers were perfused through the portal vein with oxygenated (95% O2-5% CO2) Krebs-Henseleit solution with 1% bovine serum albumin (BSA) and 0.1% dextrose in a nonrecirculating system, and this was continued for 15 min until pressures had stabilized. Portal flow was kept constant at 28 ml per min.
Experimental protocol.
The experiments were performed in BDL rats 4 wk after surgery and in age-matched healthy rats that served as controls. At the completion of the 15-min stabilization period, each liver preparation was given two bolus injections, the first at time zero and the second after 15 min. The first group of rat livers received an Ang II bolus without an inhibitor and then a second Ang II bolus with the addition of the ACE inhibitor lisinopril (1 × 10⁻⁶ mol/l). In experiments with Ang I, the first group received an Ang I bolus without an inhibitor and then a second with the ACE inhibitor lisinopril. Each of the third, fourth, and fifth groups received Ang I at time zero and an Ang II bolus at 15 min in the presence of the ACE and NEP inhibitor omapatrilat (1 × 10⁻⁶ mol/l) or the ACE2 inhibitor MLN4760 (1 × 10⁻⁶ mol/l) or with omapatrilat + MLN4760 (each at 1 × 10⁻⁶ mol/l), respectively. In the third, fourth, and fifth groups, treatment with the respective inhibitor started 5 min before the first bolus injection and continued throughout. The liver preparation was thoroughly flushed out with Krebs-Henseleit solution during the 15-min gap between the two bolus injections. Our previous data indicated that angiotensin peptide levels return to baseline within 1 min of the bolus injection (12). The total experimental period with 15-min initial pressure stabilizing period was 40 min. Each group consisted of BDL rats (n = 5) and healthy rats (n = 5) except the fifth group, which contained BDL animals only. Data are presented for both Ang I- and Ang II-related pressure changes and peptide production as group 1 (no inhibition), group 2 (ACE inhibition), group 3 (ACE+NEP inhibition), group 4 (ACE2 inhibition), and group 5 (ACE+ACE2+NEP inhibition). The doses of lisinopril, omapatrilat, and MLN4760 were based on the concentrations needed to achieve maximal inhibition of their target enzymes in previous studies (15, 24, 30).
Pressure recording and sampling of effluent and tissue.
Portal pressures were measured every 2 min during the 15-min stabilization period and every 30 s thereafter by using a vertically positioned graduated fluid-filled column open to atmospheric pressure. Four effluent samples were collected at 15-s intervals after the bolus dose of each of the angiotensin peptides, Ang I (99 pmol), and Ang II (60 pmol). The dose of Ang I was chosen on the basis that ∼65% more Ang I was necessary to produce a comparable portal pressure change to that obtained with Ang II bolus injections (22). The bolus was administered into the portal vein cannula in 0.2 ml over 10 s. One control sample of venous effluent was taken prior to each bolus injection in an identical fashion to the posttreatment samples. All effluent samples were collected onto tubes containing an endopeptidase inhibitor mix (20 μl/ml effluent, 50 mmol/l Na2EDTA, 0.2 mol/l N-ethylmaleimide, and 1–2 trypsin inhibitor unit/ml aprotinin) for measurement of angiotensin peptide levels. The samples were mixed and stored at −20°C until assayed for Ang II and Ang-(1-7) by radioimmunoassay. Tissue samples were snap frozen in liquid nitrogen and stored at −80°C until used for RNA extraction for quantitative real-time polymerase chain reaction (QPCR), and membrane preparation for ACE2 activity assay. Viability of the preparation was determined by macroscopic and histological appearance of the liver, together with oxygen consumption and stability of portal pressure.
QPCR analyses.
Immediately after the completion of experiments, wet liver weight was measured and a sample was snap-frozen in liquid nitrogen and stored at −80°C until extracted for RNA. Total RNA was extracted using TRI reagent (Sigma-Aldrich, Sydney, Australia) and reverse transcribed to cDNA by use of a protocol previously described (12). All QPCR reactions were carried out by using multiplexing in which both the target gene and endogenous reference gene were amplified in a single well. The details of dual-fluorescent-labeled oligonucleotide probes and primers are given in Table 1. The probes and primers were designed by using the Primer Express software program (PE Applied Biosystems, CA). Predeveloped TaqMan 18S ribosomal RNA kit was used as endogenous reference gene (PE Biosystems). Each sample was run and analyzed in duplicate. The normalized values from healthy liver tissues were used as the calibrator with a given value of 1, and the BDL groups were compared with this calibrator. Gene expression data, irrespective of the group, were analyzed for healthy livers and BDL livers.
Table 1.
Primer and probe sequences used for real time QPCR analysis
| Gene Name | Probe/Primer | Sequence |
|---|---|---|
| ACE2 | Probe | 5′-FAM-TTGTCTGCCACCCCACA-3′ |
| Forward | 5′-GCCAGGAGATGACCGGAAA-3′ | |
| Reverse | 5′-CTGAAGTCTCCATGTCCCAGATC-3′ | |
| Mas | Probe | 5′-FAM-CGGGATCCTCCTCTGG-3′ |
| Forward | 5′-CATCTCTCCTCTCGGCTTTGTG-3′ | |
| Reverse | 5′-CCTCATCCGGAAGCAAAGG-3′ | |
| ACE | Probe | 5′-FAM-CAACAAGACTGCCACCTGCTGGTCC-3′ |
| Forward | 5′-CACCGGCAAGGTCTGCTT-3′ | |
| Reverse | 5′-CTTGGCATAGTTTCGTGAGGAA-3′ | |
| AT1R | Probe | 5′-FAM-CTCATCGGCCAAAAAGCCTGCGT-3′ |
| Forward | 5′-CGGCCTTCGGATAACATGA-3′ | |
| Reverse | 5′-CCTGTCACTCCACCTCAAAACA-3′ | |
| NEP | Probe | 5′-FAM-ATGGATCTTGTAAGCAGCCTCAGCCGA-3′ |
| Forward | 5′-TCCCAGAGATCTTCAAAATTTAATGTC-3′ | |
| Reverse | 5′-GAAAGCATTTCTGGACTCCTTGTAGT-3′ |
Liver membrane preparation.
Frozen rat liver tissue samples (∼0.2 g) were placed in a 5-ml vial with 1 ml of ice-cold Tris-buffered saline (TBS, 25 mmol/l Tris·HCl, 125 mmol/l NaCl pH 7.4) and 10 μl of protease inhibitor cocktail containing aprotinin, bestatin, leupeptin, pepstatin, and 4-(2-aminoethyl)benzenesulfonyl fluoride. Samples were homogenized (Polytron, Kinematica) for 5 min and then centrifuged at 45,000 rpm for 1 h at 4°C with a Beckman Optima LE-80K ultracentrifuge. The resultant supernatant was discarded and the pellet resuspended in 1 ml TBS. The sample was again centrifuged by using the settings described above. After the second centrifugation step, the supernatant was discarded and the pellets were resuspended in 0.5 ml of TBS. The samples were snap frozen and stored at −80°C until required. The protein concentration of each sample was determined by BCA protein assay (Pierce) using BSA as standard.
Tissue ACE2 activity.
Enzyme activity for ACE2 was measured by using specific quenched fluorogenic substrates (QFS, Auspep, Parkville, Australia) as described previously with minor modifications (5, 12). Briefly, the QFS comprised a fluorophore, 7-methoxycoumarin-4-acetyl (MCA), and a quencher, N-2,4-dinitrophenyl separated by a short peptide chain (alanine, proline, and lysine). The proline-lysine bond is cleaved by ACE2, allowing the quencher to separate from the fluorophore, resulting in increased fluorescence emission of MCA. The assay was performed with 50 μM QFS in a final volume of 200 μl of ACE2 assay buffer (100 mM Tris·HCl, 1 M NaCl, pH 6.5).
The fluorescence of the samples was measured at 37°C by using a FLUOstar Optima plate reader (BMG LABTECH, Offenburg, Germany) with excitation and emission wavelengths of 320 and 405 nm, respectively. The test samples were analyzed in the absence and presence of 100 μM EDTA, a known inhibitor of ACE2; the difference in fluorescence represented the enzyme activity within the test sample. Samples were tested in triplicate. Results were expressed as nanomoles of substrate cleaved per milligram of tissue per hour.
Radioimmunoassay for angiotensin peptides.
Effluent concentrations of Ang II and Ang-(1-7) were measured by radioimmunoassay as previously described (12) (ProSearch International Australia P/l, Melbourne, Australia). Briefly, antibodies to Ang II and Ang-(1-7) were raised in rabbit and guinea pig, respectively, by immunizing animals against the natural peptide sequences, NH2-terminally conjugated to either porcine thyroglobulin [Ang-(1-7)] or BSA (Ang II). The intra- and interassay coefficients of variation were 7.6 and 8.3% and 4.5 and 10% for Ang II and Ang-(1-7), respectively.
Statistics.
Statistical significance between the means of treatment groups in the perfusion studies was determined by ANOVA designed to account for repeated measures. The baseline-corrected mean values and baseline-corrected total area under the curves (AUC) were determined for angiotensin peptides and portal pressure. ANOVA was used for comparison of means of ACE2 activity data. Student's t-test was used to compare the means of gene expression data, Ishak score, and picrosirius red staining data. Data are presented as means ± SE. A P value of less than 0.05 was considered statistically significant. All statistical analyses were carried out by use of the SAS computer package (SAS Statistics, version 9.1.3, Cary, NC).
RESULTS
Liver injury and fibrosis.
BDL resulted in significant histological changes including expansion of portal tracts with extensive bile duct proliferation. There were also numerous regions of biliary infarction and extensive fibrosis with bridging and nodule formation. Ishak scoring yielded 5.2 ± 0.2 in BDL livers compared with healthy livers, which had a score of 0.6 ± 0.2 (P < 0.0005). Percentage area stained for picrosirius red was significantly higher (P < 0.005) in the BDL (24 ± 3%) than healthy (1.03 ± 0.4%) livers.
Hepatic production of angiotensin-(1-7) from angiotensin II.
Hepatic Ang-(1-7) production from Ang II in the various groups is shown in Fig. 2, A and B. As previously reported, Ang-(1-7) production from an Ang II bolus was increased in effluent from BDL livers treated with the ACE inhibitor lisinopril compared with healthy livers (12). However, in healthy livers, ACE inhibition with lisinopril had no effect on Ang-(1-7) production from Ang II. Combined ACE and NEP inhibition with omapatrilat caused a significant reduction in Ang-(1-7) output in both BDL (P < 0.005) and healthy (P < 0.05) livers compared with ACE inhibition alone.
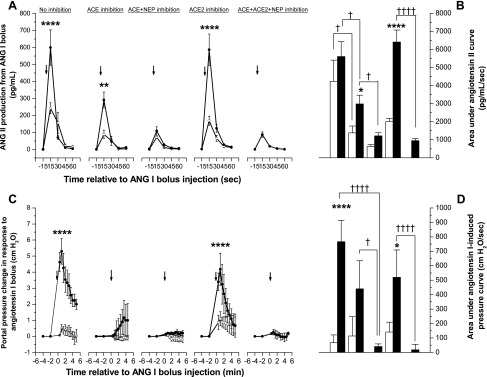
Fig. 2.

Angiotensin-(1-7) production in rat liver. Ang I (99 pmol) or Ang II (60 pmol) bolus was injected into the portal vein of in situ perfused healthy (○ and open bars) and fibrotic (• and solid bars) rat liver preparations with or without the ACE inhibitor lisinopril (10−6 mol/l), ACE and NEP inhibitor omapatrilat (10−6 mol/l), ACE2 inhibitor MLN4760 (10−6 mol/l), or a combination of MLN4760 and omapatrilat. Angiotensin-(1-7) production from Ang II (A) and the baseline-corrected total area under the respective curves (B), and angiotensin-(1-7) production from Ang I (C) and the baseline-corrected total area under the respective curves (D), and Ang II-induced portal pressure responses (E) and the area under pressure response curve (F) are shown. Each symbol represents the mean ± SE profile from 4–5 rats per treatment group. Note that y-axis scale is different between A and C and between B and D. Arrow indicates the time of bolus injection. ****P < 0.0005, **P < 0.01, *P < 0.05, vs. respective healthy livers. ††††P < 0.0005, between the 2 groups indicated by brackets. In E and F, *P < 0.05 vs. other groups except bile duct ligation (BDL)/ACE inhibition group (P = 0.059).
Pretreatment with the ACE2 inhibitor MLN4760 reduced Ang-(1-7) peak levels by 57% (P < 0.05) and 59% (P = 0.09) compared with those without inhibition in BDL and healthy livers, respectively. ACE2 inhibition also resulted in an approximately fourfold reduction in the Ang-(1-7) AUC in BDL as well as in healthy livers compared with no inhibition (P < 0.05 for both). Ang-(1-7) production was lower in MLN4760-treated than in omapatrilat-treated BDL livers (P = 0.10). In BDL livers, when combined with MLN4760, omapatrilat restored Ang-(1-7) peak levels to those with omapatrilat alone.
Hepatic production of angiotensin-(1-7) from angiotensin I.
Hepatic Ang-(1-7) production from Ang I in the various groups is shown in Fig. 2, C and D. Ang-(1-7) was produced from Ang I in both healthy and BDL livers. In the absence of inhibition, peak Ang-(1-7) levels were increased (P < 0.05) in effluent from BDL livers compared with healthy livers. Importantly, the bolus injections of Ang I produced only 10 and 21% of the Ang-(1-7) AUC in normal and BDL livers, respectively, compared with those with Ang II bolus injections. The difference between normal and BDL livers in Ang-(1-7) production from Ang I disappeared when the livers were pretreated with lisinopril or omapatrilat. Moreover, in both control and BDL livers far less Ang-(1-7) was produced from Ang I than Ang II (11 and 16% of Ang II production, respectively; P < 0.005) (Figs. 2, C and D and 3, A and B).
Fig. 3.
Ang II production and portal pressure changes in response to Ang I in rat liver. Ang I bolus (99 pmol) was injected into the portal vein of in situ perfused healthy (○ and open bars) and fibrotic (• and solid bars) rat liver preparations with or without the ACE inhibitor lisinopril (10−6 mol/l), ACE and NEP inhibitor omapatrilat (10−6 mol/l), ACE2 inhibitor MLN4760 (10−6 mol/l), or a combination of MLN4760 and omapatrilat. Ang II production (A) and the area under the Ang II curve (B) and Ang I-induced portal pressure responses (C) and the area under pressure-response curve (D) are shown. Each symbol represents the mean ± SE profile from 4–5 rats per treatment group. Arrows indicate the time of bolus injection. ****P < 0.0005, **P < 0.01, *P < 0.05, vs. respective healthy livers. ††††P < 0.0005, †P < 0.05, between the 2 groups indicated by brackets.
Unexpectedly, pretreatment with the ACE2 inhibitor MLN4760 caused a dramatic increase in Ang-(1-7) (P < 0.0005) production by BDL livers, resulting in a significant (P < 0.005) increase in baseline-corrected total AUC for BDL group compared with control group. Pretreatment of BDL livers with both MLN4760 and omapatrilat reduced (P < 0.005) the peak levels of Ang-(1-7) to ∼20% of those achieved with MLN4760 alone.
Hepatic production of angiotensin II from angiotensin I.
Hepatic Ang II production from Ang I is shown in Fig. 3, A and B. Ang II was produced from Ang I in both healthy and BDL livers. However, in the absence of enzyme inhibition, peak Ang II levels were more than twofold higher in effluent from BDL livers than healthy livers (P < 0.0005), although the total area under the curve was not different (P = 0.11), possibly due to rapid degradation of Ang II by ACE2. As expected, ACE inhibition with lisinopril significantly attenuated Ang II production from Ang I in both groups (P < 0.01). However, peak production of Ang II was still significantly higher in effluent from BDL than healthy livers (P < 0.01). Inhibition of both ACE and NEP with omapatrilat reduced Ang II production to low levels in both healthy and BDL livers and abolished the difference in the AUC between the two groups.
ACE2 inhibition with MLN4760 did not affect Ang II production in either group. However, the combination of omapatrilat with MLN4760 reduced Ang II production by BDL livers to the minimum levels achieved with omapatrilat alone.
Angiotensin II-induced portal pressure changes.
The portal pressure responses to Ang II in the various groups are shown in Fig. 2, E and F. In both healthy and BDL livers, Ang II at a dose of 60 pmol bolus induced portal pressure changes that were comparable to those of Ang I at the bolus dose of 99 pmol (Fig. 3, C and D). Peak portal pressure increases in BDL liver in response to Ang II were more than twice those seen in healthy liver, although the difference in baseline-corrected total AUC did not reach significance.
The portal pressure response was not affected by pretreatment with lisinopril or omapatrilat. However, pretreatment of both healthy and BDL livers with the ACE2 inhibitor MLN4760 significantly (P < 0.05) increased the AUC compared with all other groups, presumably as a result of inhibition of ACE2-mediated catabolism of Ang II to Ang-(1-7). When MLN4760 was combined with omapatrilat, BDL livers responded to Ang II bolus with a significantly (P < 0.05) reduced area under the response curve than that of BDL livers treated with MLN4760 alone.
Angiotensin I-induced portal pressure changes.
Ang I bolus-induced portal pressure responses in the various groups are shown in Fig. 3, C and D. Bolus Ang I injection increased portal pressure in both healthy and BDL livers. However, compared with a small pressure rise in healthy livers, Ang I caused more than 10-fold increase (P < 0.0005) in portal pressure in the BDL livers, in keeping with the greater production of Ang II (Fig. 3, A and B). The pressure started to decline 1 min after the bolus injection. The increased response by the BDL liver resulted in significantly (P < 0.0005) higher baseline-corrected total AUC in the BDL than in the healthy livers.
In BDL livers, inhibition of ACE with lisinopril caused a large drop (>80%, P < 0.0005) in the peak portal pressure following Ang I bolus injection compared with nontreated BDL livers, resulting in a significant reduction (P < 0.05) in the AUC. The addition of omapatrilat, a potent inhibitor of both ACE and NEP, completely abolished the Ang I-induced portal pressure response in both healthy and BDL livers. This resulted in an even greater reduction (>95%) in the portal pressure response, and led to a significantly reduced baseline-corrected total area under the pressure response curve compared with BDL livers treated with lisinopril (P < 0.05) or without ACE inhibition (P < 0.0005). The ACE2 inhibitor MLN4760 did not affect the portal pressure response evoked by Ang I bolus in either BDL or healthy livers. As with omapatrilat alone, inhibition with a combination of omapatrilat and MLN4760 completely abolished (P < 0.0005) the Ang I-induced pressure change. Thus the reductions in Ang II production after lisinopril and omapatrilat treatments seen in Fig. 3, A and B corresponded closely with the effects of these drugs on the portal pressure response to Ang I.
Gene expression of the renin angiotensin system.
We investigated gene expression of key RAS enzymes and receptors that regulate angiotensin peptide metabolism and action, respectively, in healthy and fibrotic rat livers. Expression of all genes studied was detectable in healthy livers but at low levels. The genes that represented the classic arm of the RAS such as ACE and AT1R were significantly (P < 0.0005) upregulated in BDL compared with healthy livers (Fig. 4). Similarly, the genes that represented the alternative arm of the RAS such as ACE2 and the Ang-(1-7) receptor Mas were also significantly (P < 0.0005) upregulated in BDL compared with healthy livers. In addition, BDL livers had very high (P < 0.0005) levels of NEP expression compared with healthy livers (Fig. 4).
Fig. 4.

Gene expression profiles of the components of the classic and alternative arms of the renin angiotensin system in the perfused livers from healthy (open bars) and fibrotic (solid bars) rats. Quantitative real-time polymerase reaction (QPCR) was performed by Taqman multiplexing assay with dual-labeled probes and primers. Gene expression values were normalized to ribosomal 18S, and the healthy livers were given a value of 1. Each bar represents the mean ± SE expression from 4–5 rats per treatment group. ****P < 0.0005 vs. healthy livers.
Tissue ACE2 activity.
Each sample of liver tissue collected at the end of each experiment had been treated with at least one of the three enzyme inhibitors. Therefore the present study did not have a group of livers perfused without an inhibitor. Additionally since ACE2 activity was not different between each group of the healthy livers treated with inhibitors, they were pooled together to represent a control healthy group. The ACE2 activity in the various groups is shown in Fig. 5. Hepatic ACE2 activity was significantly (P < 0.0005) higher in the lisinopril-treated BDL livers than in the healthy livers. It is unlikely that this increase in ACE2 activity is related to the presence of lisinopril since ACE inhibitors including lisinopril have no effect on proteolytic activity of ACE2 (1, 31). Furthermore, this increase in ACE2 activity is consistent with the gene expression data (Fig. 5) and previous studies that have shown that ACE2 activity and expression are increased in the BDL liver (12). The ACE2 inhibitor MLN4760 significantly reduced (P < 0.0005) ACE2 activity in the BDL liver. Moreover, omapatrilat alone or in combination with MLN4760 also caused a significant (P < 0.05) reduction in ACE2 activity in BDL livers compared with those treated with lisinopril.
Fig. 5.

ACE2 activity of the perfused rat liver. In situ perfused healthy (open bars) and fibrotic (solid bars) rat livers, incubated with or without the ACE inhibitor lisinopril (10−6 mol/l), ACE and NEP inhibitor omapatrilat (10−6 mol/l), ACE2 inhibitor MLN4760 (10−6 mol/l), or a combination of MLN4760 and omapatrilat were used for cell membrane preparations for measurement of ACE2 activity. ACE2 activity was determined by measuring nanomoles of ACE2 substrate [Mca-APK-(Dnp)-OH] cleaved by solubilized membrane fractions. Each bar represents the mean ± SE activity from 4–5 rats per treatment group. ACE2 activity was not different between different groups of healthy livers so that the mean value from all groups is shown. ****P < 0.0005, ***P < 0.005, **P < 0.01, *P < 0.05 vs. group indicated by brackets.
DISCUSSION
In the present study, we examined the production of Ang-(1-7) and hepatic vascular resistance in response to Ang I and Ang II by inhibiting three key enzymes of the RAS in in situ perfused healthy and fibrotic rat livers. Our main focus was on Ang-(1-7) production in BDL livers since it has only recently been shown that the concentrations of this peptide are elevated in experimental biliary fibrosis and that ACE2 is upregulated in human liver disease (12, 23). We show for the first time that, in the fibrotic rat liver, Ang II is rapidly converted to Ang-(1-7) and is the preferred substrate for Ang-(1-7) production compared with Ang I. Moreover, our study provided evidence that the Ang-(1-7) could be generated in large amounts, directly from Ang I by the action of NEP, but it appears that this effect of NEP is masked or blocked by ACE2.
In this study, to produce comparable effects on portal resistance, Ang II was administered into the portal vein in doses that were 60% (in molar mass) of those used for Ang I. Despite this, Ang II bolus injections resulted in approximately five times more Ang-(1-7) production than Ang I in both the normal and BDL liver. The present findings and previous reports (12) showed marked upregulation of ACE in BDL livers. ACE inhibition resulted in an approximately twofold increase in Ang-(1-7) production from Ang II in BDL livers, presumably by blocking ACE-mediated conversion of Ang-(1-7) to Ang-(1-5) (Fig. 2). However, lisinopril had no significant impact on Ang-(1-7) levels in the normal liver, which has much lower levels of ACE expression and activity (12). Furthermore, in both control and BDL livers, ∼10 times more Ang II than Ang-(1-7) was produced from Ang I. These findings suggest that conversion of Ang II to Ang-(1-7) is likely to be the major source of hepatic Ang-(1-7) production in both the normal and fibrotic liver with less direct contribution from Ang I, which is largely converted to Ang II.
ACE2 blockade with MLN4760 greatly reduced Ang-(1-7) production from Ang II with total Ang-(1-7) production falling by more than threefold in both healthy and BDL livers. Only a few studies have attempted in vivo and in vitro inhibition of ACE2 using MLN4760 (9, 11, 30). Our findings confirm that ACE2 plays a key role in converting Ang II into Ang-(1-7) in rat liver (Fig. 2). Furthermore upregulation of ACE2 in the BDL livers resulted in greater generation of Ang-(1-7) than in the normal liver but this effect is counterbalanced by increased ACE-mediated Ang-(1-7) hydrolysis. This agrees with findings of a recent enzyme kinetic study showing that the catalytic efficiency of ACE2 for Ang II hydrolysis into Ang-(1-7) was the highest observed for any of the angiotensin peptides with ACE, ACE2, and NEP (25). On the other hand, omapatrilat greatly reduced Ang-(1-7) generation from Ang II in the BDL and healthy livers compared with ACE inhibition alone. We have previously shown that omapatrilat is a potent inhibitor of ACE in rat liver and thus the findings are not likely to reflect a failure to block ACE (18). This suggests that omapatrilat may have a direct inhibitory effect on ACE2 activity in rat liver and this was supported by measurements of reduced ACE2 activity in liver tissue in vitro in the presence of omapatrilat (Fig. 5).
Little is known about NEP expression and activity in liver disease, and in particular, its role in Ang-(1-7) production by the liver has not been studied. The present study found that the NEP gene is markedly upregulated in the BDL liver and provides evidence that this enzyme plays a role in production of Ang-(1-7) in diseased liver. This was suggested by the surprising finding that ACE2 inhibition greatly increased the conversion of Ang I to Ang-(1-7) in the BDL liver despite the fact that ACE2 inhibition would be expected to block Ang-(1-7) formation (Fig. 2, C and D). Moreover, we found that the ACE2 blockade-associated rise in Ang-(1-7) production from Ang I in BDL livers was completely abolished by the NEP inhibitor omapatrilat. This suggests that NEP activity is masked or blocked by ACE2. The existence of this type of protein-protein interaction on the cell membrane has been reported for other peptidases and membrane receptors (8). It should also be noted that the catalytic efficiency of NEP in converting Ang I into Ang-(1-7) is only three to four times less than that of ACE2 catalyzing Ang II into Ang-(1-7) (25).
The interaction between ACE2 and NEP is interesting and may have some physiological implications in the regulation of RAS peptide production, particularly in the diseased liver. Of the enzymes involved in Ang-(1-7) production, ACE2 and NEP possess the highest affinity toward Ang II and Ang I, respectively (25). The hepatic RAS may have adapted to restrict NEP activity when this enzyme is upregulated, thus preventing the generation of excessive Ang-(1-7) directly from Ang I so that generation of both Ang II and Ang-(1-7) remain in balance with their levels of production primarily controlled by the relative activity of ACE and ACE2 (20).
This study also provided insights into the generation of Ang II from Ang I and how this affects intrahepatic resistance. There has been conflicting evidence regarding the importance of Ang II as a mediator of sinusoidal resistance in portal hypertension (2, 26). Early rat liver perfusion studies suggested that Ang II responses in cirrhotic rat liver were smaller with decreased sensitivity than those observed in healthy rat liver (2, 26). However, this was not supported by our present findings. The peak portal pressure and AUC of the portal pressure response curve with Ang II were increased by more than twofold in the BDL liver compared with healthy liver. This may reflect increased activation of myofibroblastic cell populations and/or increased Ang II type I receptor expression in the BDL liver (3, 39). The only inhibitor of angiotensin metabolism that affected the portal pressure response to an Ang II bolus was the ACE2 inhibitor MLN4760, which caused a more than twofold increase in the AUC in both normal and BDL livers (Fig. 2F). This was presumably caused by reduced ACE2-mediated Ang II breakdown and Ang-(1-7) formation.
As expected, portal pressure responses to Ang I were closely related to the net production of Ang II (Fig. 3). As with Ang II, the portal pressure response to Ang I administration was greater in BDL livers probably reflecting both increased production of Ang II as a result of increased ACE expression and a greater vasoconstriction response of the BDL liver to this peptide. ACE inhibition reduced Ang II production from Ang I, and this resulted in a reduction in the portal pressure response that was further reduced by omapatrilat, a potent ACE inhibitor (17).
In conclusion, the present study demonstrates that key enzymes involved in Ang-(1-7) and Ang II generation are present in the liver and markedly upregulated by chronic cholestatic liver injury. Ang II is the major substrate for hepatic production of Ang-(1-7) and ACE2 is the major enzyme that catalyzes the conversion of Ang II to Ang-(1-7). We suggest that ACE2 and ACE function in an opposing manner to counterbalance the net effects of the RAS activation in the diseased liver. NEP has the ability to generate large amounts of Ang-(1-7) in the BDL liver from Ang I only when ACE2 activity is greatly decreased or inhibited, but this probably rarely occurs since Ang II is the preferred substrate for Ang-(1-7) formation and not Ang I.
GRANTS
This work was supported by the National Health and Medical Research Council of Australia.
REFERENCES
- 1.Acharya KR, Sturrock ED, Riordan JF, Ehlers MR. Ace revisited: a new target for structure-based drug design. Nat Rev Drug Discov 2: 891–902, 2003. [DOI] [PMC free article] [PubMed] [Google Scholar]
- 2.Ballet F, Chretien Y, Rey C, Poupon R. Differential response of normal and cirrhotic liver to vasoactive agents. A study in the isolated perfused rat liver. J Pharmacol Exp Ther 244: 283–289, 1988. [PubMed] [Google Scholar]
- 3.Bataller R, Gabele E, Schoonhoven R, Morris T, Lehnert M, Yang L, Brenner DA, Rippe RA. Prolonged infusion of angiotensin II into normal rats induces stellate cell activation and proinflammatory events in liver. Am J Physiol Gastrointest Liver Physiol 285: G642–G651, 2003. [DOI] [PubMed] [Google Scholar]
- 4.Benter IF, Yousif MH, Anim JT, Cojocel C, Diz DI. Angiotensin-(1-7) prevents development of severe hypertension and end-organ damage in spontaneously hypertensive rats treated with l-NAME. Am J Physiol Heart Circ Physiol 290: H684–H691, 2006. [DOI] [PubMed] [Google Scholar]
- 5.Burchill L, Velkoska E, Dean RG, Lew RA, Smith AI, Levidiotis V, Burrell LM. Acute kidney injury in the rat causes cardiac remodelling and increases angiotensin-converting enzyme 2 expression. Exp Physiol 93: 622–630, 2008. [DOI] [PubMed] [Google Scholar]
- 6.Campagnole-Santos MJ, Diz DI, Santos RA, Khosla MC, Brosnihan KB, Ferrario CM. Cardiovascular effects of angiotensin-(1-7) injected into the dorsal medulla of rats. Am J Physiol Heart Circ Physiol 257: H324–H329, 1989. [DOI] [PubMed] [Google Scholar]
- 7.Chappell MC, Gomez MN, Pirro NT, Ferrario CM. Release of angiotensin-(1-7) from the rat hindlimb: influence of angiotensin-converting enzyme inhibition. Hypertension 35: 348–352, 2000. [DOI] [PubMed] [Google Scholar]
- 8.Deddish PA, Marcic BM, Tan F, Jackman HL, Chen Z, Erdos EG. Neprilysin inhibitors potentiate effects of bradykinin on b2 receptor. Hypertension 39: 619–623, 2002. [DOI] [PubMed] [Google Scholar]
- 9.Diz DI, Garcia-Espinosa MA, Gegick S, Tommasi EN, Ferrario CM, Tallant EA, Chappell MC, Gallagher PE. Injections of angiotensin-converting enzyme 2 inhibitor MLN4760 into nucleus tractus solitarii reduce baroreceptor reflex sensitivity for heart rate control in rats. Exp Physiol 93: 694–700, 2008. [DOI] [PMC free article] [PubMed] [Google Scholar]
- 10.Ferrario CM, Trask AJ, Jessup JA. Advances in biochemical and functional roles of angiotensin-converting enzyme 2 and angiotensin-(1-7) in regulation of cardiovascular function. Am J Physiol Heart Circ Physiol 289: H2281–H2290, 2005. [DOI] [PMC free article] [PubMed] [Google Scholar]
- 11.Garabelli PJ, Modrall JG, Penninger JM, Ferrario CM, Chappell MC. Distinct roles for angiotensin-converting enzyme 2 and carboxypeptidase A in the processing of angiotensins within the murine heart. Exp Physiol 93: 613–621, 2008. [DOI] [PMC free article] [PubMed] [Google Scholar]
- 12.Herath CB, Warner FJ, Lubel JS, Dean RG, Jia Z, Lew RA, Smith AI, Burrell LM, Angus PW. Upregulation of hepatic angiotensin-converting enzyme 2 (ACE2) and angiotensin-(1-7) levels in experimental biliary fibrosis. J Hepatol 47: 387–395, 2007. [DOI] [PMC free article] [PubMed] [Google Scholar]
- 13.Ishak K, Baptista A, Bianchi L, Callea F, De Groote J, Gudat F, Denk H, Desmet V, Korb G, MacSween RN, Phillips MJ, Portmann BG, Poulsen H, Scheuer PJ, Schmid M, Thaler H. Histological grading and staging of chronic hepatitis. J Hepatol 22: 696–699, 1995. [DOI] [PubMed] [Google Scholar]
- 14.Iwata M, Cowling RT, Gurantz D, Moore C, Zhang S, Yuan JX, Greenberg BH. Angiotensin-(1-7) binds to specific receptors on cardiac fibroblasts to initiate antifibrotic and antitrophic effects. Am J Physiol Heart Circ Physiol 289: H2356–H2363, 2005. [DOI] [PubMed] [Google Scholar]
- 15.Jackson B, Cubela RB, Conway EL, Johnston CI. Lisinopril pharmacokinetics in chronic renal failure. Br J Clin Pharmacol 25: 719–724, 1988. [DOI] [PMC free article] [PubMed] [Google Scholar]
- 16.James J, Bosch KS, Aronson DC, Houtkooper JM. Sirius red histophotometry and spectrophotometry of sections in the assessment of the collagen content of liver tissue and its application in growing rat liver. Liver 10: 1–5, 1990. [DOI] [PubMed] [Google Scholar]
- 17.Jandeleit-Dahm K, Lassila M, Davis BJ, Candido R, Johnston CI, Allen TJ, Burrell LM, Cooper ME. Anti-atherosclerotic and renoprotective effects of combined angiotensin-converting enzyme and neutral endopeptidase inhibition in diabetic apolipoprotein E-knockout mice. J Hypertens 23: 2071–2082, 2005. [DOI] [PubMed] [Google Scholar]
- 18.Kubota E, Dean RG, Hubner RA, Casley DJ, Johnston CI, Burrell LM. Differential tissue and enzyme inhibitory effects of the vasopeptidase inhibitor omapatrilat in the rat. Clin Sci (Lond) 105: 339–345, 2003. [DOI] [PubMed] [Google Scholar]
- 19.Li N, Zimpelmann J, Cheng K, Wilkins JA, Burns KD. The role of angiotensin converting enzyme 2 in the generation of angiotensin 1-7 by rat proximal tubules. Am J Physiol Renal Physiol 288: F353–F362, 2005. [DOI] [PubMed] [Google Scholar]
- 20.Lubel JS, Herath CB, Burrell LM, Angus PW. Liver disease and the renin-angiotensin system: recent discoveries and clinical implications. J Gastroenterol Hepatol 23: 1327–1338, 2008. [DOI] [PMC free article] [PubMed] [Google Scholar]
- 21.Mendes AC, Ferreira AJ, Pinheiro SV, Santos RA. Chronic infusion of angiotensin-(1-7) reduces heart angiotensin II levels in rats. Regul Pept 125: 29–34, 2005. [DOI] [PubMed] [Google Scholar]
- 22.Nascimento EA, Gioli-Pereira L, Carvalho LT, Santos EL, Pesquero JB, Kouyoumdjian M, Borges DR. Hemodynamic and metabolic effects of angiotensin II on the liver. Peptides 26: 315–322, 2005. [DOI] [PubMed] [Google Scholar]
- 23.Paizis G, Tikellis C, Cooper ME, Schembri JM, Lew RA, Smith AI, Shaw T, Warner FJ, Zuilli A, Burrell LM, Angus PW. Chronic liver injury in rats and humans upregulates the novel enzyme angiotensin converting enzyme 2. Gut 54: 1790–1796, 2005. [DOI] [PMC free article] [PubMed] [Google Scholar]
- 24.Raasch W, Dominiak P, Dendorfer A. Angiotensin I-converting enzyme-dependent and neutral endopeptidase-dependent generation and degradation of angiotensin II contrarily modulate noradrenaline release: implications for vasopeptidase-inhibitor therapy? J Hypertens 23: 1597–1604, 2005. [DOI] [PubMed] [Google Scholar]
- 25.Rice GI, Thomas DA, Grant PJ, Turner AJ, Hooper NM. Evaluation of angiotensin-converting enzyme (ACE), its homologue ACE2 and neprilysin in angiotensin peptide metabolism. Biochem J 383: 45–51, 2004. [DOI] [PMC free article] [PubMed] [Google Scholar]
- 26.Rockey DC Vasoactive agents in intrahepatic portal hypertension and fibrogenesis: implications for therapy. Gastroenterology 118: 1261–1265, 2000. [DOI] [PubMed] [Google Scholar]
- 27.Santos RA, Brosnihan KB, Jacobsen DW, DiCorleto PE, Ferrario CM. Production of angiotensin-(1-7) by human vascular endothelium. Hypertension 19: II56–II61, 1992. [DOI] [PubMed] [Google Scholar]
- 28.Schiavone MT, Santos RA, Brosnihan KB, Khosla MC, Ferrario CM. Release of vasopressin from the rat hypothalamo-neurohypophysial system by angiotensin-(1-7) heptapeptide. Proc Natl Acad Sci USA 85: 4095–4098, 1988. [DOI] [PMC free article] [PubMed] [Google Scholar]
- 29.Schindler C, Bramlage P, Kirch W, Ferrario CM. Role of the vasodilator peptide angiotensin-(1-7) in cardiovascular drug therapy. Vasc Health Risk Manag 3: 125–137, 2007. [PMC free article] [PubMed] [Google Scholar]
- 30.Soler MJ, Wysocki J, Ye M, Lloveras J, Kanwar Y, Batlle D. ACE2 inhibition worsens glomerular injury in association with increased ACE expression in streptozotocin-induced diabetic mice. Kidney Int 72: 614–623, 2007. [DOI] [PubMed] [Google Scholar]
- 31.Tipnis SR, Hooper NM, Hyde R, Karran E, Christie G, Turner AJ. A human homolog of angiotensin-converting enzyme. Cloning and functional expression as a captopril-insensitive carboxypeptidase. J Biol Chem 275: 33238–33243, 2000. [DOI] [PubMed] [Google Scholar]
- 32.Trask AJ, Averill DB, Ganten D, Chappell MC, Ferrario CM. Primary role of angiotensin-converting enzyme-2 in cardiac production of angiotensin-(1-7) in transgenic Ren-2 hypertensive rats. Am J Physiol Heart Circ Physiol 292: H3019–H3024, 2007. [DOI] [PubMed] [Google Scholar]
- 33.Trask AJ, Ferrario CM. Angiotensin-(1-7): pharmacology and new perspectives in cardiovascular treatments. Cardiovasc Drug Rev 25: 162–174, 2007. [DOI] [PubMed] [Google Scholar]
- 34.Trask AJ, Jessup JA, Chappell MC, Ferrario CM. Angiotensin-(1-12) is an alternate substrate for angiotensin peptide production in the heart. Am J Physiol Heart Circ Physiol 294: H2242–H2247, 2008. [DOI] [PMC free article] [PubMed] [Google Scholar]
- 35.Vickers C, Hales P, Kaushik V, Dick L, Gavin J, Tang J, Godbout K, Parsons T, Baronas E, Hsieh F, Acton S, Patane M, Nichols A, Tummino P. Hydrolysis of biological peptides by human angiotensin-converting enzyme-related carboxypeptidase. J Biol Chem 277: 14838–14843, 2002. [DOI] [PubMed] [Google Scholar]
- 36.Warner FJ, Lubel JS, McCaughan GW, Angus PW. Liver fibrosis: a balance of ACEs? Clin Sci (Lond) 113: 109–118, 2007. [DOI] [PubMed] [Google Scholar]
- 37.Warner FJ, Smith AI, Hooper NM, Turner AJ. Angiotensin-converting enzyme-2: a molecular and cellular perspective. Cell Mol Life Sci 61: 2704–2713, 2004. [DOI] [PMC free article] [PubMed] [Google Scholar]
- 38.Yamamoto K, Chappell MC, Brosnihan KB, Ferrario CM. In vivo metabolism of angiotensin I by neutral endopeptidase (EC 3.42411) in spontaneously hypertensive rats. Hypertension 19: 692–696, 1992. [DOI] [PubMed] [Google Scholar]
- 39.Yang YY, Lin HC, Huang YT, Lee TY, Hou MC, Lee FY, Liu RS, Chang FY, Lee SD. Effect of 1-week losartan administration on bile duct-ligated cirrhotic rats with portal hypertension. J Hepatol 36: 600–606, 2002. [DOI] [PubMed] [Google Scholar]