Abstract
Obstructive sleep apnea is characterized by repetitive nocturnal upper airway obstructions that are associated with sleep disruption and cyclic intermittent hypoxia (CIH) The cyclic oscillations in O2 saturation are thought to contribute to cardiovascular and other morbidity, but animal and patient studies of the pathogenic link between CIH and these diseases have been complicated by species differences and by the effects of confounding factors such as obesity, hypertension, and impaired glucose metabolism. To minimize these limitations, we set up a model of nocturnal CIH in healthy humans. We delivered O2 for 15 s every 2 min during sleep while subjects breathed 13% O2 in a hypoxic tent to create 30 cycles/h of cyclic desaturation-reoxygenation [saturation of peripheral O2 (SpO2) range: 95–85%]. We exposed subjects overnight for 8–9 h/day for 2 wk (10 subjects) and 4 wk (8 subjects). CIH exposure induced respiratory disturbances (central apnea hypopnea index: 3.0 ± 1.9 to 31.1 ± 9.6 events/h of sleep at 2 wk). Exposure to CIH for 14 days induced an increase in slopes of hypoxic and hypercapnic ventilatory responses (1.5 ± 0.6 to 3.1 ± 1.2 l·min−1·% drop in SpO2 and 2.2 ± 1.0 to 3.3 ± 0.9 l·min−1·mmHg CO2−1, respectively), consistent with hypoxic acclimatization. Waking normoxic arterial pressure increased significantly at 2 wk at systolic (114 ± 2 to 122 ± 2 mmHg) and for diastolic at 4 wk (71 ± 1.3 to 74 ± 1.7 mmHg). We propose this model as a new technique to study the cardiovascular and metabolic consequences of CIH in human volunteers.
Keywords: sleep apnea, pathophysiology, cardiovascular
obstructive sleep apnea syndrome (OSA) is common in Western countries, with prevalence estimates ranging from 5% to 15% of working age individuals (26). OSA is characterized by episodes of upper airway collapse during sleep, resulting in the obstruction of air flow despite increased respiratory efforts during the events, associated with clinical symptoms. Termination of these events is accompanied by O2 desaturation and arousal from sleep. OSA, defined as >5 events/h of sleep, is characterized clinically by symptoms such as excessive daytime sleepiness and impaired daytime function. Apart from daytime sleepiness, the major health consequence of OSA is cardiovascular morbidity, with OSA independently associated with hypertension (16) and an increased risk of fatal and nonfatal cardiovascular events (9, 12, 25).
The mechanisms by which OSA and nocturnal hypoxia contribute to cardiovascular disease are thus a major topic of interest. To study these mechanisms, cyclic intermittent hypoxia (CIH) has been applied to intact animals (6). Fletcher et al. (8) were the first to build a device that allowed small animal exposure to CIH. Brooks et al. (4) later created an interesting model in dogs that combined the three stimuli that characterize OSA (i.e., augmented respiratory effort, asphyxia, and arousal from sleep). Both models have been shown, in elegant studies, to produce elevations of arterial blood pressure that persist after termination of the hypoxic exposure. Different pathways inducing blood pressure elevation have been studied. Fletcher et al.'s model is now used extensively with rodents to explore the mechanisms that link OSA to cardiovascular and other morbidity.
Although considerable progress has been made using these models, human studies of the independent consequences of CIH remain incompletely explored. Population studies (12, 16) have suggested a relationship between sleep apnea and cardiovascular morbidity. However, the mechanisms by which OSA and cardiovascular disease are linked remain obscure. Moreover, species differences make questionable the applicability of animal studies to human disease states. Patient studies are complicated by the confounding effects of disease duration and the many comorbidities present in OSA patients. Our aims in the present study were to 1) develop a model of nocturnal CIH that could be applied to healthy humans for several weeks and 2) characterize changes in arterial pressure, ventilatory control, and sleep quality experienced by subjects undergoing CIH exposure for 2 wk (Grenoble, France) to 4 wk (Boston, MA).
METHODS
Experimental Protocol
Healthy subjects were exposed to 14 nights (Grenoble) or 28 nights (Boston) of intermittent hypoxia and were investigated before and after completing the exposures.
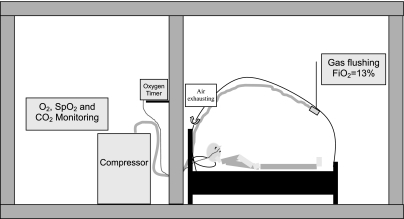
To achieve the exposures, we used commercially available altitude tents (Colorado Altitude in Boston and Hypoxico in Grenoble; Fig. 1). The tents created a hypoxic environment, with the fraction of inspired O2 (FiO2) = 0.13 in the enclosure. This FiO2 induced saturation of peripheral O2 (SpO2) values ranging from 82% to 85%. To create cyclic reoxygenation, subjects wore nasal cannula through which we administered a 15-s bolus of O2 at a flow rate ranging from 1.5 to 2 l/min. O2 administration was repeated every 120 s, thus allowing 30 cyclic desaturation-resaturation sequences/h. A macromatic time delay relay (TR-63128, Milwaukee, WI) connected to a Festo valve (CPE14) was used to regulate O2 administration. The O2 flow rate was adjusted between 1.5 to 2 l/min for each individual using a flowmeter (Ohio Medical Products, Madison, WI) to ensure a 10% desaturation-resaturation difference (95–85%).
Fig. 1.
Representation of the model. In a hospital room, a hypoxic tent was set on a standard bed. The tent was flushed with gas with a fraction of inspired O2 (FiO2) of 0.13 generated by an oxygen extractor (Hypoxico), bringing the subject's saturation of peripheral O2 SpO2 to ∼85%. Using a nasal cannula, an O2 bolus (1.5–2 l/min) was delivered for 15 s every 2 min, allowing the subject's SpO2 to rise to ∼95%.
The protocol timeline is shown in Fig. 2. Subjects were exposed for 9 h each night between 10 PM and 7 AM for 28 consecutive nights (Boston) or for 8 h between 10 PM and 6 AM for 14 consecutive nights (Grenoble). Before the initiation of the hypoxic exposure, subjects underwent a two-night adaptation to the tent, sleeping in room air. This was followed by two nights (Boston) or one night (Grenoble) of adaptation to CIH as the tent FiO2 was progressively decreased to the target (FiO2 = 0.13). Subjects slept in a standard bed while in the tent. The FiO2 was set and continuously monitored using an O2 sensor in Boston (Colorado Altitude Systems) and Grenoble (Maxtec OM-25MEI). In each system, a continuous flow of gas through the tent minimized CO2 build up. The Colorado Altitude system further provides an additional CO2 removal system. Transcutaneous CO2 pressure (Tina Radiometer) was monitored during the first 4 h of three nights of the protocol (one night during normoxic conditions and during the first and last nights of CIH) to confirm that CO2 accumulation was insignificant. O2 saturation was monitored continuously and recorded for each subject overnight throughout the exposure (Biox model 3740, Ohmeda, Louisville, KY, and BleueNight, SleepInnov Technology, Moirans, France, for Boston and Grenoble, respectively). This allowed real-time monitoring of the exposure by the technician.
Fig. 2.
Protocol timeline. PSG, polysomnogram; N, night.
Subjects
Enrollment criteria and exclusions were similar in Boston and Grenoble. All subjects underwent a screening history and physical examination to assure that they were free of significant cardiac, pulmonary, or neurological disease before they provided written informed consent. Subjects who had journeyed to or lived at an altitude of 2,500 m or more in the prior 6 mo were excluded from participating. We also excluded subjects with a history of smoking, diabetes, or other chronic conditions requiring regular medication. All women completed testing during the first week after menses to minimize the possible confounding effects of hormonal changes on vascular function, and all tested negative for pregnancy (plasma β-human chorionic gonadotropin test) at three time points (i.e., before exposure, after one night of CIH, and at the end of the protocol).
The 4-wk study was conducted in Boston, and the 2-wk protocol was conducted in Grenoble. Fifteen subjects and nine subjects were enrolled for the 2- and 4-wk protocols, respectively. Eight (4 men and 4 women) and twelve (10 men and 2 women) subjects completed the 4- and 2-wk protocols, respectively. The 4- and 2-wk subjects had mean ages of 27 ± 1.5 and 23 ± 6.4 yr and body mass indexes of 23 ± 0.9 and 21.7 ± 1.87 kg/m2, respectively.
Protocols were reviewed and approved by the local ethical committee at each institution, and all experiments conformed to the provisions of the Declaration of Helsinki.
Measurements
Sleep experiments.
Over the time of exposure, three full night polysomnograms were performed. These were the second night of room air breathing in the tent and the first and last nights of CIH. Polysomnograms were performed with an ambulatory system (Cidelec, Sainte-Gemmes sur Loire, France) and analyzed manually with the proprietary software package (Cidelec). Physiological signals included two electroencephalogram channels (CZ O1 and C3-A2), submental electromyogram, and electrooculogram. Sleep stages were analyzed manually using the standard criteria of Rechtschaffen and Kales (19). Microarousals were scored manually using American Sleep Disorders Association criteria (22a). Chest wall and abdominal movements were assessed by noncalibrated inductive plethysmography and O2 saturation by pulse oximetry. Airflow was monitored with a nasal cannula connected to a pressure transducer. Respiratory efforts were assessed according to the occurrence of flow limitation on nasal pressure trace and phase decay or opposite movement on thoracic and abdominal captors. Respiratory events were scored manually using American Academy of Sleep Medicine guidelines (1); however, because of the design of the study, subjects exhibited oscillations in O2 saturation that interfered with the identification of hypopneas. As a consequence, the 3% drop in O2 saturation specified in the scoring criteria could not be used to identify respiratory events. Hypopneas were scored as either central or obstructive according to the following criteria: a central hypopnea was scored when flow exhibited a decrease of >30% during at least 10 s, with a visually assessed proportional decrease in thoracic and abdominal movement without flow limitation and/or phase decay; if none of the preceding could be applied to the event, an obstructive hypopnea was scored.
Ventilatory drive during wakefulness.
We measured ventilatory responses to isocapnic hypoxia and to CO2 at three time points during the 2-wk protocol (before exposure and after 1 and 2 wk of exposure). Subjects breathed from a closed circuit connected to a 10-liter bag. For isocapnic hypoxia, CO2 was removed as necessary from the circuit by directing a selected amount of air flow through a CO2 scrubber to maintain isocapnia according to the end-tidal CO2 (ETco2) level. The respiratory circuit was connected to a pulmonary function testing device (M'Vmax 229, SensoMedics, Yorha Linda, CA). This system allowed us to measure minute ventilation and O2 and CO2 fractions in exhaled gas. Exhaled CO2 and O2 were recorded continuously. O2 saturation was monitored using a pulse oximeter (Biox model 3740, Ohmeda) with its analog output connected to the M'Vmax 229. Before the ventilatory challenge, to acclimatize to the device, subjects were allowed to breathe room air for >1 min through a mouthpiece while wearing nose clips. Next, subjects were switched to the rebreathing circuit, which was filled with calibrated gas made up of either 24% O2-6% CO2-balance N2 for the isocapnic hypoxia ventilatory response (IHVR) or 93% O2-7% CO2 for the CO2 ventilatory response.
IHVR.
After the subject breathed on the circuit for 1 min, N2 was added to decrease the bag FiO2 to 14% to hasten the decrease in O2 saturation. When arterial O2 saturation (SaO2) decreased to 92%, O2 was added to the circuit at 0.1–0.2 l/min through a pediatric flowmeter to allow precise control of the rate of fall of saturation. The O2 flow was adjusted so that the SaO2 fell ∼4% every 2 min. A linear correlation was used to obtain the slope of the SaO2 and minute ventilation relationship.
Ventilatory response to progressive hypercapnia.
As the subject breathed on the circuit, the fraction of inspired CO2 increased progressively due to declining bag volume. The test was stopped when the subject achieved a 20-mmHg increase in ETco2. The ventilatory response to progressive hypercapnia was characterized by a two-part response: an initial slow increase in ventilation until the subject reached a threshold and then a brisk linear ventilatory response above the threshold. We present both the threshold and slope of the response above this threshold. A linear correlation was used to obtain the slope of the ETco2 and minute ventilation relationship.
Data Analysis
One subject in Boston did not complete the 4-wk exposure due to a viral illness, and his data were excluded from analysis. Three subjects in Grenoble also did not complete the exposure: two subjects had an apnea hypopnea index of >10 events/h and the third subject had an abnormally high plasma creatinine value. Data from the 12 individuals who completed the exposure were analyzed. For technical reasons, 1 of these 12 individuals did not receive intermittent hypoxia but instead received sustained hypoxia during the sleep recording of the last night; therefore, his data were not included in the sleep analysis.
Statistics
Baseline values were compared from pre- to postexposure with a two-tail distribution paired t-test. Differences among multiples means were evaluated by ANOVA corrected for multiple measures. When significant differences were detected, individual means were tested with the Bonferroni test for multiple comparisons. Except where otherwise noted, data are reported as means ± SD in the text, tables, and figures. P values of <0.05 were considered statistically significant. When changes approached significance, the sample size calculation necessary to accept the null hypothesis with 80% confidence is reported as an illustration of the trend.
RESULTS
Acute Effects on Gas Exchange
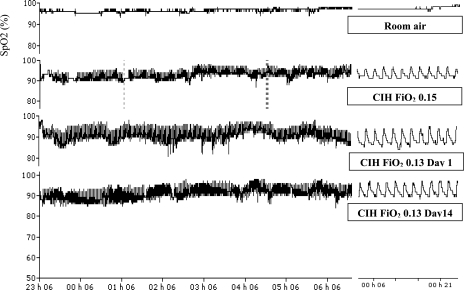
Mean O2 saturation, numbers of O2 desaturations per hour (>3%), and lowest O2 saturation are reported in Table 1, and, as designed, all were significantly different compared with room air breathing. Interestingly, these values did not change between the first night and the end of the 2-wk exposure. Representative SpO2 traces from a single subject breathing room air (baseline), adaptation night (15% O2 in the tent), and during the first and last nights of CIH (with the tent at FiO2 = 0.13) are shown in Fig. 3.
Table 1.
Oxygen saturation during the 2-wk exposure to CIH
| Preexposure | CIH Exposure |
P Value | ||
|---|---|---|---|---|
| Day 1 | Day 14 | |||
| Awake SpO2, % | 96.3±1 | 96.6±0.8 | 96.7±1.1 | NS |
| Mean SpO2, % | 95.2±0.4 | 85.9±2* | 86.6±2.4* | <0.01 |
| Lowest SpO2, % | 91.3±2.3 | 75.5±4.1* | 78.0±4.9* | <0.01 |
| Number of SpO2 decreases/h | 0.4±0.9 | 37.2±7.7* | 35.4±7.5* | <0.001 |
| Time spent <90% SpO2, %TST | 0.2±0.6 | 80.3±13.3* | 79.2±14.5* | <0.001 |
Data are means ± SD. CIH, cyclic intermittent hypoxia; preexposure, room air breathing; SpO2, saturation of peripheral O2; TST, total sleep time; NS, not significant.
Significant post hoc analyses by ANOVA or Friedman test compared with baseline.
Fig. 3.
SpO2 traces from a representative subject taken four times during the study: 1) at baseline during room air breathing, 2) with cyclic intermittent hypoxia (CIH) during adaptation with chamber FiO2 = 0.15, 3) with CIH during exposure on day 1 with chamber FiO2 = 0.13, and 4) with CIH during exposure on day 14 with chamber FiO2 = 0.13.
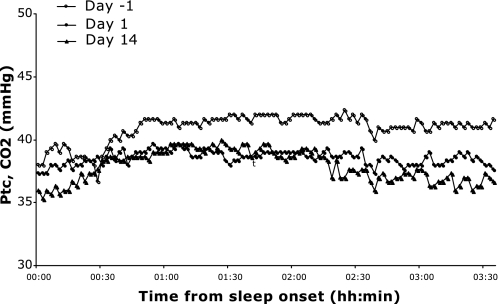
The level of CO2 during intermittent hypoxia was assessed using transcutaneous measurements in three nonselected subjects (Fig. 4). The transcutaneous CO2 pressure was 41.0 ± 1.0 mmHg when subjects breathed room air, 38.6 ± 0.5 mmHg during the first night of CIH, and 37.9 ± 1.3 mmHg during the last night of CIH.
Fig. 4.
Representative tracings from an individual subject of transcutaneous CO2 pressure (Ptc CO2) levels from three time points during the study: 1) with CIH during adaptation on day −1 with chamber FiO2 = 0.15, 2) with CIH during exposure on day 1 with chamber FiO2 = 0.13, and 3) with CIH during exposure on day 14 with chamber FiO2 = 0.13.
Changes in Ventilatory Patterns During Sleep (Analysis of the 2-wk Protocol)
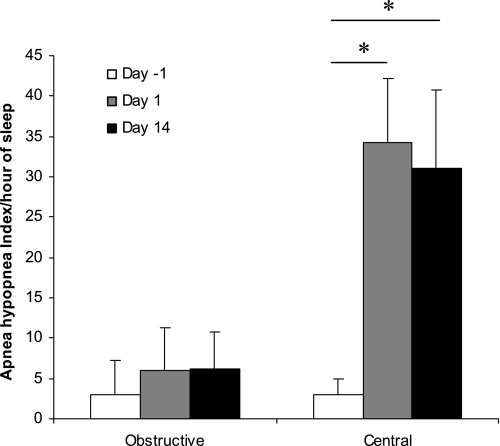
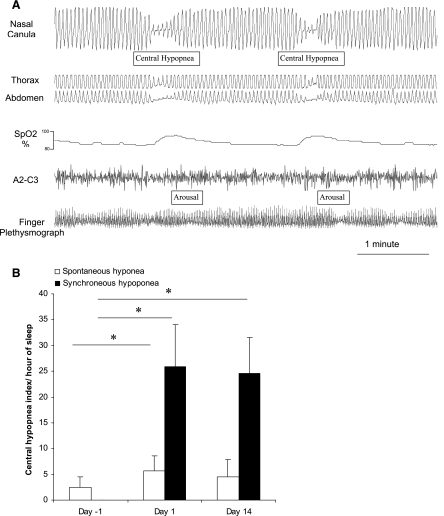
By design, none of the subjects exhibited sleep-disordered breathing during room air breathing (apnea-hypopnea index = 5.9 ± 5.3). With acute CIH, subjects significantly increased the number of respiratory events starting on the first night of CIH, and this persisted at the 14th night of CIH (Table 2). These events were predominantly central and were hypopneas rather than apneas (Fig. 5). These central hypopneas occurred with the return to normoxia (named synchronous central hypopnea) or spontaneous central hypopnea; the following sequence was encountered: progressive desaturation and the resaturation with a synchronous central hypopnea or apnea ended by a microarousal (Fig. 6A). Most central hypopneas were scored as synchronous hypopneas (Fig. 6B).
Table 2.
Respiratory disturbance during the 2-wk exposure to CIH
| Preexposure | CIH Exposure |
P Value | ||
|---|---|---|---|---|
| Day 1 | Day 14 | |||
| AHI, events/h of sleep | 5.9±5.3 | 36.9±14.9* | 34.2±15.8* | <0.001 |
| Obstructive AHI, events/h of sleep | 3.0±4.3 | 5.9±5.4 | 6.2±4.6 | 0.07 |
| Central AHI, events/h of sleep | 3.0±1.9 | 34.3±7.8* | 31.1±9.6*† | <0.001 |
Data are means ± SD. AHI, apnea-hypopnea index.
Significant post hoc analyses by ANOVA or Friedman test compared with baseline; †significant post hoc analyses by ANOVA or Friedman test compared with acute exposure.
Fig. 5.
Obstructive and central apnea-hypopnea indexes across the 14-day exposure. Note the predominance of central rather than obstructive events.
Fig. 6.
A: central events occurring synchronously with the return to normoxia in a representative tracing from an individual subject. B: the vast majority of central hypopneas were such synchronous events, occurring at the return to normoxia rather than occurring spontaneously at other points in the deoxygenation-reoxygenation cycle. Values represent means ± SD of the number of synchroneous and spontaneous central hypopneas during acclimatization on room air (day −1), during the first night of CIH (day 1 CIH), and during the 14th night of CIH (day 14 CIH). P values are represented with * when significant (P < 0.05).
Changes in Sleep Architecture
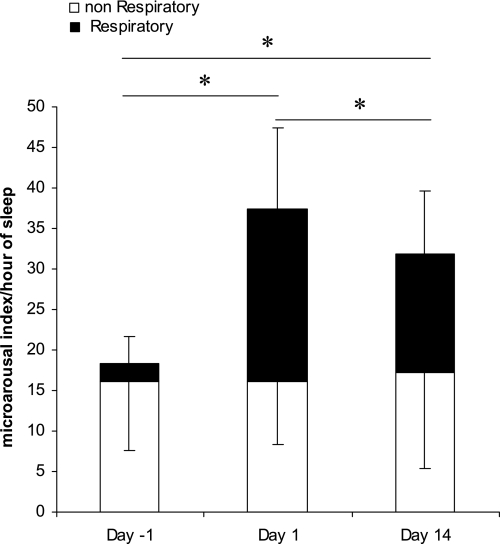
As previously stated, these respiratory events induced arousals with significant sleep fragmentation as assessed by an increase in respiratory microarousals from room air to CIH (Fig. 7). The sleep fragmentation remained constant in severity throughout the 14-day exposure (Table 3). After 4 wk, however, there were no significant changes in sleep macrostructure, and the increase in microarousals was no longer significant.
Fig. 7.
Frequency of arousals across the 14-day exposure to CIH. Day −1 is the acclimatization night where subjects breathed room air, day 1 is the first night of CIH exposure, and day 14 is the 14th night of CIH exposure. Bars represent means ± SD of numbers of arousals per hour of sleep (11 subjects). Shaded bars indicates the number of arousals occurring in association with respiratory events; the remaining arousals (open bars) occurred spontaneously, without association with respiration. P values are represented with * when significant between respiratory microarousal from sleep (P < 0.05).
Table 3.
Sleep architecture during the 2-wk exposure to CIH
| Preexposure | CIH Exposure |
||
|---|---|---|---|
| Day 1 | Day 14 | ||
| TSP, min | 461.8±38.6 | 437.4±29.1 | 444.8±38.0 |
| TST, min | 430.6±50.9 | 391.2±37.9 | 383.8±85.7 |
| Time spent in stage I 8/sleep, %TST | 6.8 ±3.7 | 11.9±5.3 | 9.3±3.5 |
| Time spent in stage II sleep, %TST | 49.8±9.5 | 54.4±5.2 | 52.6±8.4 |
| Time spent in stage III/IV sleep, %TST | 17.7±10.9 | 11.0±5.0 | 12.7±5.8 |
| Time spent in REM sleep, %TST | 25.6±5.5 | 22.7±4.1 | 30.8±6.1 |
| Sleep efficiency, % | 92.5±6.6 | 89.1±7.3 | 85.6±16.9 |
Data are means ± SD. TSP, total sleep period; REM, rapid eye movement. There were no statistically significant differences in all conventional sleep measures before, on day 1 (the first night), and at the end of the 2-wk CIH exposure period.
Changes in Ventilatory Drive During Wakefulness
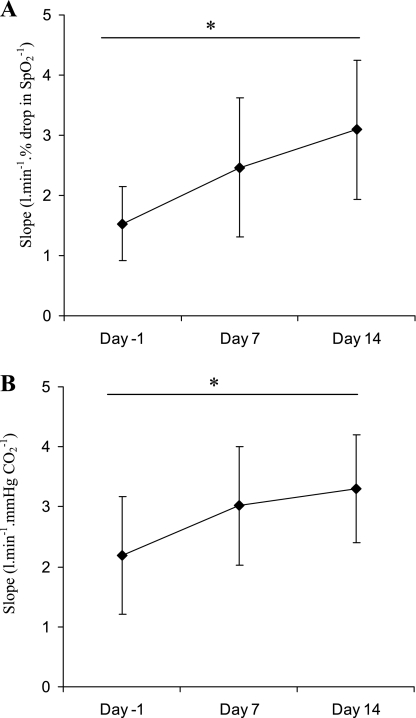
Control of breathing at baseline and on days 7 and 14 was assessed by progressive IHVR and progressive hyperoxic hypercapnic ventilatory responses (HHVR) in six subjects. Both O2 and CO2 chemosensitivity were altered over the course of the exposure. Indeed, subjects exhibited a significant increase in the slope of both progressive IHVR and HHVR (Friedman test: P < 0.01 and P < 0.05, respectively). A significant increase was shown from baseline to day 14 in the slope of both progressive IHVR and HHVR (Wilcoxon test: P < 0.05). This demonstrates a change in both hypoxic and hypercapnic chemosensitivity (Fig. 8).
Fig. 8.
A: slopes of the ventilatory response to progressive isocapnic hypoxia increased across the CIH exposure (Friedman test: P < 0.01). This demonstrates a change in hypoxic chemosensitivity. *Significant difference by Wilcoxon test (P < 0.05). Values represent means ± SD of 6 subjects. B: slopes of the response to progressive hyperoxic hypercapnic increased across the CIH exposure (Friedman test: P < 0.05). This demonstrates a change in hypercapnic chemosensitivity. *Significant difference by Wilcoxon test (P < 0.05). Values represent means ± SD of 6 subjects.
No changes were found in the HHVR threshold (45.1 ± 1.6, 45.9 ± 2.9, and 44.1 ± 1.1 mmHg at baseline, day 7, and day 14, respectively). Nor did we find a significant change in resting ETco2 (36.4 ± 3.0, 34.8 ± 4.4, and 34.2 ± 3.9 mmHg at baseline, day 7, and day 14 of the exposure, respectively), although there was a trend toward a decrease across the exposure.
Further evidence supporting the development of acclimatization in our subjects was the change in blood count demonstrated by the subjects at 2 wk. From baseline to day 14, both the hematocrit (baseline: 0.40 ± 0.01% and day 14: 0.42 ± 0.01%, P < 0.01) and hemoglobin (baseline: 138.0 ± 3.9 g/l and day 14: 143.3 ± 2.6 g/l, P < 0.05) increased significantly.
Changes in Arterial Pressure During Wakefulness
Morning resting blood pressure increased across the exposure in both protocols (Table 4). Although the increase reached significance only for diastolic pressure in the 4-wk protocol and for systolic and mean pressure in the 2-wk protocol, taken together, CIH had a significant effect on arterial pressure in these normal volunteers.
Table 4.
Cardiovascular variables for subjects during CIH
| Baseline | 2 wk | 4 wk | |
|---|---|---|---|
| 4-wk protocol | |||
| SBP, mmHg | 117±3 | 115±4 | 115±2 |
| DBP, mmHg | 71±1 | 71±2 | 74±2†‡ |
| MBP, mmHg | 87±2 | 87±2 | 88±2 |
| 2-wk protocol | |||
| SBP, mmHg | 114±2 | 122±2† | |
| DBP, mmHg | 61±2 | 65±3 | |
| MBP, mmHg | 79±2 | 84±2* |
Values are means ± SE. SBP, systolic blood pressure; DBP, diastolic blood pressure; MBP, mean blood pressure.
P < 0.05 and
P < 0.01, significantly different from baseline;
P < 0.05, significantly different from 2 wk.
DISCUSSION
There are four major findings from this study: 1) healthy human volunteers can be exposed safely to CIH at night for up to 4 wk in commercial altitude tents; 2) this CIH exposure induced changes in ventilatory control with increased responses to hypoxia and hypercarbia and a trend toward decreased ETco2 suggesting ventilatory acclimatization; 3) nocturnal exposure to CIH for 2 wk induces an increase in systolic and mean arterial pressure and diastolic arterial pressure for 4 wk of exposure; and 4) CIH produces respiratory disturbances during sleep that persist for 1 mo of exposure, although sleep fragmentation is significantly increased only during the first 14 days of the exposure. These data provide the first description of a new model of CIH to study in humans the mechanisms by which CIH contributes to diurnal morbidity.
Patients with OSA experience fluctuations of O2 levels during sleep. This CIH is thought to be the main cause of the cardiovascular morbidity associated with sleep apnea. In the early 1990s, Fletcher and coworkers (8) created a rodent model that has yielded important insights into the pathophysiology of OSA and served as the inspiration for our present study. In that model, rats' cages were flushed sequentially with nitrogen and then air, creating oscillations in FiO2 and hence cyclic oscillations in O2 saturation. Using this model, these investigators were the first to convincingly demonstrate a causal connection between CIH and elevations in systemic arterial pressure (8). Later, using a more complicated canine model in which tracheal obstructions were created during sleep and released with arousal, Brooks et al. (4) demonstrated that respiratory events with associated desaturations resulted in elevations in waking arterial pressure, whereas simple acoustic arousals induced at the same frequency failed to produce a sustained hemodynamic effect.
Sympathetic outflow activation through peripheral chemostimulation is one of the main mechanisms proposed to explain the association of CIH with increased arterial pressure. Indeed, carotid sinus denervation prevents blood pressure elevation after CIH exposure (7). Moreover, the blood pressure elevation induced by CIH has been attributed to an increased sympathetic outflow due to the repetitive hypoxic carotid body chemostimulation (14, 20). Fletcher et al. (8) originally described the elevation of arterial pressure to occur in rats over 35 days of CIH exposure. However, Sica et al. (22) and Peng et al. (15) later demonstrated that systolic arterial pressure increases in rats after 7 days of CIH. Data from our laboratory (11) also support this. These studies demonstrated the particular importance of the chemostimulation and plasticity of the peripheral chemoreflex in the pathophysiology of chronic intermittent hypoxia. Enhanced peripheral chemostimulation increasing sympathetic outflow and has been demonstrated in sleep apnea patients by Narkiewicz et al. (13), providing supportive evidence that this mechanism plays a role in the hemodynamic consequences of OSA.
Despite the considerable information gleaned from these models, species differences in arterial pressure control during hypoxia and during sleep mandate that these and other findings be confirmed in humans to better understand the pathophysiology of sleep apnea. Patient studies certainly lend credibility to the animal findings, but the common occurrence of comorbidities and issues of disease duration limit the conclusions that can be made from clinical research. We therefore believe that the model described here provides an important additional tool for the study of the consequences of sleep apnea. Several aspects of the model are particularly worthy of comment.
First, our subjects demonstrated an increase in peripheral chemosensitivity during wakefulness after CIH exposure. This increased chemosensitivity is similar to what occurs in subjects exposed to sustained hypoxia, namely, ventilatory acclimatization (3, 10, 17, 24). Ventilatory acclimatization to hypoxia, however, is further defined by an increase in resting ventilation upon return to normoxia with a lower arterial Pco2 due to the increase in peripheral chemosensitivity. Our subjects demonstrated a trend toward reduced ETco2, but the change did not reach significance. Another notable aspect of the ventilatory changes we observed after CIH exposure is the increased sensitivity to hyperoxic hypercapnia. A change in CO2 chemosensitivity is not consistently described after poikilocapnic hypoxic exposure but is after isocapnic hypoxic exposures (5, 24). In summary, our CIH model induced plasticity of ventilatory control in the normal volunteers who completed the 14-day exposure. Further studies are needed to define the impact of the 4-wk exposure on chemosensitivity.
Second, both 2- and 4-wk exposure to CIH induced an increase in arterial pressure in our healthy subjects. The increase of ∼5 mmHg is less that that described by Fletcher and colleagues (8) in rats exposed for 6 wk, who displayed increases of mean arterial pressure of >20 mmHg. The lesser magnitude of the changes seen in our subjects may be attributed to the shorter durations of CIH experienced by our volunteers, the more modest decreases in FiO2 and presumably SaO2 induced by our model, and possibly by species differences in the susceptibility of rats and humans to the effects of CIH exposure. In addition, we report blood pressure only in the morning, after awakening, at a single time point. Additional measurements might demonstrate a further increase. Nevertheless, the increases in arterial pressure induced by our model further support the hypothesis that CIH provides the causal connection between OSA and hypertension suggested in a clinical and epidemiological study (16).
Third, arousals characterize the cycle of nocturnal upper airway obstruction in OSA. In our model, respiratory arousals occurred with half of respiratory events and produced significant sleep fragmentation. Interestingly, that sleep fragmentation did not decrease after 14 days of CIH. After 4 wk, however, there were no significant changes in sleep macrostructure, and the increase in microarousals was no longer significant. This suggests that there may be adaptation over time to the sleep disruption induced by respiratory events. Adaptation has previously been described in models of sleep fragmentation induced by acoustic stimulation. In such models, the acoustic stimulus must either increase in intensity or the tone must change to maintain the same effect (21).
Limitations and Technical Aspects
Hypoxic tents are commercially available and relatively easy to use. In this study, we used two commercial brands that were both able to reach the desired FiO2. One system uses a rebreathing circuit and includes a CO2 absorber. The second one does not need a CO2 absorber because hypoxic gas was continuously flushed into the tent, providing for continuous removal of accumulated CO2. The absence of significant hypercapnia was confirmed by transcutaneous measurement of CO2 during the exposure. In our model, the cyclic nature of the hypoxic exposure was accomplished by the intermittent administration of O2 with flow regulated using electromagnetic pneumatic valves manipulated by a time-controlled switch. With this system, cyclic desaturations of between 8% and 10% are created during sleep. These changes are comparable with values that occur clinically in OSA patients in whom O2 drops of 4% or more have been suggested to have cardiovascular consequences (18). However, the time course of 2 min for the sequence of O2 desaturation-resaturation in our model is longer compared with the typical cycle duration of <1 min in sleep apnea patients, and the pattern of intermittent reoxygenation in our model produces a SpO2 tracing that differs slightly from the typical pattern of intermittent desaturation experienced by patients.
We should note other ways in which our model does not mimic the respiratory events of OSA. In our model, desaturations were poikilocapnic, not asphyxic, like spontaneous obstructions during sleep. In addition, the desaturations experienced by our subjects were not accompanied by the extreme swings in pleural pressure or the changes in upper airway pressure experienced by OSA patients. Like Fletcher et al.'s rodent model, which induces sleep fragmentation in rats and mice (23), our model induced sleep fragmentation. This may induce some sleep debt. We did not monitor sleep apart from the polysomnograms noted above and do not know if subjects obtained recovery sleep at other times.
In general, subjects subjectively tolerated the exposure well. Some subjects experienced mild morning headache, particularly at the beginning of the exposure in Grenoble. Some subjects complained of discomfort from the pulse oximeter probe. In summer months in Grenoble, the tent became warm, making exposure problematic. In Boston, the tent was in an air-conditioned room and was better tolerated. In both locations, noise from the compressor unit necessitated placing it in a separate room.
A final limitation of our study is the lack of a control group exposed to similar sleeping conditions but room air rather than CIH. Animal studies with such controls have failed to show any change in ventilatory control or arterial pressure, but this preliminary investigation cannot definitively exclude some contribution of sleep disruption to the physiological changes demonstrated.
Conclusions
In the present study, we describe a model of CIH in healthy human volunteers that can be maintained for up to 28 nights. This model allows us to expose human subjects without comorbidities to defined durations of CIH. Subjects exposed to this model for 2 wk displayed changes in chemosensitivity. Both 2- and 4-wk exposures to CIH induced elevations of arterial pressure. We believe that this model has substantial potential for the study of the consequences of OSA.
GRANTS
This work was supported by National Institutes of Health (NIH) Grants HL-072648 and HL-074972 and by grants from AGIRà Dom, the Association Nationale pour les Traitements A Domicile, les Innovations et la Recherche, and the Grenoble University Hospital Research Clinic Administration. The project described was also supported by National Institutes of Health Grant M01-RR-01032 (to the Harvard Clinical and Translational Science Center).
The content is solely the responsibility of the authors and does not necessarily represent the official views of the NIH.
REFERENCES
- 1.American Academy of Sleep Medicine Task Force. Sleep-related breathing disorders in adults: recommendations for syndrome definition, and measurement techniques in clinical research. The report of an American Academy of Sleep Medicine Task Force. Sleep 22: 667–689, 1999. [PubMed] [Google Scholar]
- 3.Bisgard GE Carotid body mechanisms in acclimatization to hypoxia. Respir Physiol 121: 237–246, 2000. [DOI] [PubMed] [Google Scholar]
- 4.Brooks D, Horner RL, Kozar LF, Render-Teixeira CL, Phillipson EA. Obstructive sleep apnea as a cause of systemic hypertension. Evidence from a canine model. J Clin Invest 99: 106–109, 1997. [DOI] [PMC free article] [PubMed] [Google Scholar]
- 5.Engwall MJ, Bisgard GE. Ventilatory responses to chemoreceptor stimulation after hypoxic acclimatization in awake goats. J Appl Physiol 69: 1236–1243, 1990. [DOI] [PubMed] [Google Scholar]
- 6.Fletcher EC Physiological consequences of intermittent hypoxia: systemic blood pressure. J Appl Physiol 90: 1600–1605, 2001. [DOI] [PubMed] [Google Scholar]
- 7.Fletcher EC, Lesske J, Behm R, Miller CC, 3rd Stauss H, Unger T. Carotid chemoreceptors, systemic blood pressure, and chronic episodic hypoxia mimicking sleep apnea. J Appl Physiol 72: 1978–1984, 1992. [DOI] [PubMed] [Google Scholar]
- 8.Fletcher EC, Lesske J, Qian W, Miller CC, 3rd, Unger T. Repetitive, episodic hypoxia causes diurnal elevation of blood pressure in rats. Hypertension 19: 555–561, 1992. [DOI] [PubMed] [Google Scholar]
- 9.Gami AS, Howard DE, Olson EJ, Somers VK. Day-night pattern of sudden death in obstructive sleep apnea. N Engl J Med 352: 1206–1214, 2005. [DOI] [PubMed] [Google Scholar]
- 10.Gilmartin GS, Tamisier R, Curley M, Weiss JW. Ventilatory, hemodynamic, sympathetic nervous system, and vascular reactivity changes after recurrent nocturnal sustained hypoxia in humans. Am J Physiol Heart Circ Physiol 295: H778–H785, 2008. [DOI] [PMC free article] [PubMed] [Google Scholar]
- 11.Huang J, Tamisier R, Ji E, Tong J, Weiss WJ. Chronic intermittent hypoxia modulates nNOS mRNA and protein expression in the rat hypothalamus. Respir Physiol Neurobiol 158: 30–38, 2007. [DOI] [PubMed] [Google Scholar]
- 12.Marin JM, Carrizo SJ, Vicente E, Agusti AG. Long-term cardiovascular outcomes in men with obstructive sleep apnoea-hypopnoea with or without treatment with continuous positive airway pressure: an observational study. Lancet 365: 1046–1053, 2005. [DOI] [PubMed] [Google Scholar]
- 13.Narkiewicz K, van de Borne PJ, Montano N, Dyken ME, Phillips BG, Somers VK. Contribution of tonic chemoreflex activation to sympathetic activity and blood pressure in patients with obstructive sleep apnea. Circulation 97: 943–945, 1998. [DOI] [PubMed] [Google Scholar]
- 14.Peng YJ, Overholt JL, Kline D, Kumar GK, Prabhakar NR. Induction of sensory long-term facilitation in the carotid body by intermittent hypoxia: implications for recurrent apneas. Proc Natl Acad Sci USA 100: 10073–10078, 2003. [DOI] [PMC free article] [PubMed] [Google Scholar]
- 15.Peng YJ, Prabhakar NR. Reactive oxygen species in the plasticity of respiratory behavior elicited by chronic intermittent hypoxia. J Appl Physiol 94: 2342–2349, 2003. [DOI] [PubMed] [Google Scholar]
- 16.Peppard PE, Young T, Palta M, Skatrud J. Prospective study of the association between sleep-disordered breathing and hypertension. N Engl J Med 342: 1378–1384, 2000. [DOI] [PubMed] [Google Scholar]
- 17.Powell FL, Milsom WK, Mitchell GS. Time domains of the hypoxic ventilatory response. Respir Physiol 112: 123–134, 1998. [DOI] [PubMed] [Google Scholar]
- 18.Punjabi NM, Newman AB, Young TB, Resnick HE, Sanders MH. Sleep-disordered breathing and cardiovascular disease: an outcome-based definition of hypopneas. Am J Respir Crit Care Med 177: 1150–1155, 2008. [DOI] [PMC free article] [PubMed] [Google Scholar]
- 19.Rechtshaffen A, Kales A. A Manual of Standardized Terminology, Technique and Scoring System for Sleep Stages of Human Sleep. Los Angeles, CA: Univ. of California, 1968.
- 20.Rey S, Del Rio R, Alcayaga J, Iturriaga R. Chronic intermittent hypoxia enhances cat chemosensory and ventilatory responses to hypoxia. J Physiol 560: 577–586, 2004. [DOI] [PMC free article] [PubMed] [Google Scholar]
- 21.Roehrs T, Merlotti L, Petrucelli N, Stepanski E, Roth T. Experimental sleep fragmentation. Sleep 17: 438–443, 1994. [DOI] [PubMed] [Google Scholar]
- 22.Sica AL, Greenberg HE, Ruggiero DA, Scharf SM. Chronic-intermittent hypoxia: a model of sympathetic activation in the rat. Respir Physiol 121: 173–184, 2000. [DOI] [PubMed] [Google Scholar]
- 22a.Sleep Disorders Atlas Task Force of the American Sleep Disorders Association. EEG arousals: scoring rules and examples: a preliminary report from the Sleep Disorders Atlas Task Force of the American Sleep Disorders Association. Sleep 15: 173–184, 1992. [PubMed] [Google Scholar]
- 23.Tagaito Y, Polotsky VY, Campen MJ, Wilson JA, Balbir A, Smith PL, Schwartz AR, O'Donnell CP. A model of sleep-disordered breathing in the C57BL/6J mouse. J Appl Physiol 91: 2758–2766, 2001. [DOI] [PubMed] [Google Scholar]
- 24.Tansley JG, Fatemian M, Howard LS, Poulin MJ, Robbins PA. Changes in respiratory control during and after 48 h of isocapnic and poikilocapnic hypoxia in humans. J Appl Physiol 85: 2125–2134, 1998. [DOI] [PubMed] [Google Scholar]
- 25.Yaggi HK, Concato J, Kernan WN, Lichtman JH, Brass LM, Mohsenin V. Obstructive sleep apnea as a risk factor for stroke and death. N Engl J Med 353: 2034–2041, 2005. [DOI] [PubMed] [Google Scholar]
- 26.Young T, Palta M, Dempsey J, Skatrud J, Weber S, Badr S. The occurrence of sleep-disordered breathing among middle-aged adults. N Engl J Med 328: 1230–1235, 1993. [DOI] [PubMed] [Google Scholar]


