Abstract
Mitochondrial Ca2+ ([Ca2+]m) regulates oxidative phosphorylation and thus contributes to energy supply and demand matching in cardiac myocytes. Mitochondria take up Ca2+ via the Ca2+ uniporter (MCU) and extrude it through the mitochondrial Na+/Ca2+ exchanger (mNCE). It is controversial whether mitochondria take up Ca2+ rapidly, on a beat-to-beat basis, or slowly, by temporally integrating cytosolic Ca2+ ([Ca2+]c) transients. Furthermore, although mitochondrial Ca2+ efflux is governed by mNCE, it is unknown whether elevated intracellular Na+ ([Na+]i) affects mitochondrial Ca2+ uptake and bioenergetics. To monitor [Ca2+]m, mitochondria of guinea pig cardiac myocytes were loaded with rhod-2-acetoxymethyl ester (rhod-2 AM), and [Ca2+]c was monitored with indo-1 after dialyzing rhod-2 out of the cytoplasm. [Ca2+]c transients, elicited by voltage-clamp depolarizations, were accompanied by fast [Ca2+]m transients, whose amplitude (Δ) correlated linearly with Δ[Ca2+]c. Under β-adrenergic stimulation, [Ca2+]m decay was ≈2.5-fold slower than that of [Ca2+]c, leading to diastolic accumulation of [Ca2+]m when amplitude or frequency of Δ[Ca2+]c increased. The MCU blocker Ru360 reduced Δ[Ca2+]m and increased Δ[Ca2+]c, whereas the mNCE inhibitor CGP-37157 potentiated diastolic [Ca2+]m accumulation. Elevating [Na+]i from 5 to 15 mmol/L accelerated mitochondrial Ca2+ decay, thus decreasing systolic and diastolic [Ca2+]m. In response to gradual or abrupt changes of workload, reduced nicotinamide-adenine dinucleotide (NADH) levels were maintained at 5 mmol/L [Na+]i, but at 15 mmol/L, the NADH pool was partially oxidized. The results indicate that (1) mitochondria take up Ca2+ rapidly and contribute to fast buffering during a [Ca2+]c transient; and (2) elevated [Na+]i impairs mitochondrial Ca2+ uptake, with consequent effects on energy supply and demand matching. The latter effect may have implications for cardiac diseases with elevated [Na+]i.
Keywords: calcium uniporter, Na+/Ca2+ exchange, calcium buffer, energy metabolism, oxidative phosphorylation, Krebs cycle
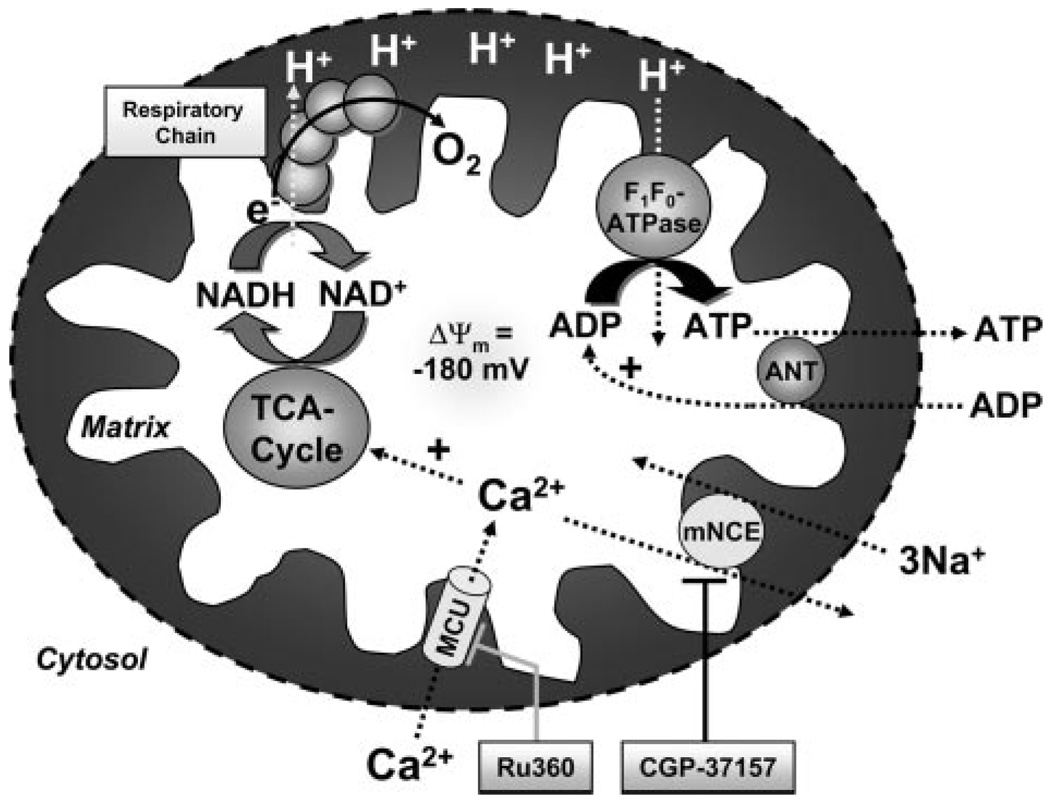
Cardiac excitation–contraction (EC) coupling requires enormous amounts of ATP.1 Mitochondria, which are spatially interleaved with myofibrils and the sarcoplasmic reticulum (SR),2 are the primary site of ATP production. Two main regulatory factors match mitochondrial ATP production to the constantly varying energy demand of the cell, ADP and Ca2+.1–6 With increasing workload, ADP and Pi stimulate the F1F0-ATPase to produce ATP and consume the proton motive force (ΔµH), leading to stimulation of the electron transport chain and oxidation of reduced nicotinamide-adenine dinucleotide (NADH)5 (Figure 1). On the other hand, an increase of workload is associated with an increase of time-averaged cytosolic [Ca2+] ([Ca2+]c). Facilitated by the strong electrochemical driving force for Ca2+ influx, Ca2+ enters mitochondria via the Ca2+ uniporter (MCU) and activates 3 key dehydrogenases of the tricarboxylic acid (TCA) cycle.1,5,7,8 This accelerates the production of NADH, providing a driving force for electrons in the respiratory chain to increase ΔµH and maintain ATP production.5 Thus, in response to changes of workload, the complementary regulation of oxidative phosphorylation by ADP and Ca2+ maintains cellular ATP and the NADH redox potential.3–5
Figure 1.
Key processes of mitochondrial energetics including NADH production by the TCA cycle, oxidative phosphorylation, and their regulation by Ca2+ and ADP. ANT indicates adeninenucleotide translocator.
The kinetics of mitochondrial Ca2+ uptake in intact cardiac myocytes, however, are not fully resolved.9 Experiments on isolated mitochondria revealed a relatively low affinity of the MCU for Ca2+ (Km≈10 to 20 µmol/L).8,10 Because, in cardiac myocytes, bulk [Ca2+]c peaks between 0.5 and ≈3 µmol/L, it was proposed that mitochondria do not take up Ca2+ rapidly 8,10–12 This view is supported by experimental data from isolated cardiac myocytes13–16 and ventricular trabeculae,4,17 where no beat-to-beat changes, but rather a slow increase of mitochondrial [Ca2+] ([Ca2+]m) in response to an increase of the frequency and/or amplitude of [Ca2+]c transients, was observed. In contrast, other studies18–22 reported rapid [Ca2+]m transients that closely followed [Ca2+]c with similar kinetics.
In this context, the spatiotemporal organization of Ca2+-handling proteins in “microdomains” may be of relevance for mitochondrial Ca2+ uptake. In the junctional cleft between L-type Ca2+ channels and ryanodine receptors (RyRs) of the SR, [Ca2+] peaks 10 to 20 ms after the onset of the action potential at concentrations of ≈50 to 100 µmol/L.12,23 This brief “junctional Ca2+” pulse is shaped by the diffusion of Ca2+ to the cytosolic bulk space.23 Experiments on permeabilized myocytes24 and H9c2 myotubes25–27 suggested that mitochondria are located ≈40 to 300 nm from the dyadic junction24 and exposed to [Ca2+] of ≈30 to 50 µmol/L, clearly exceeding bulk [Ca2+]c.25,27 This concept of a “mitochondrial microdomain” with high [Ca2+] is already well established in various noncardiac cell types, where the close vicinity of mitochondria to inositol 1,4,5-triphosphate (IP3) receptors of the endoplasmic reticulum allows spatially and temporally organized Ca2+ signal transmission and enables mitochondria to shape [Ca2+]c.28 Conversely, in cardiac myocytes, it is still widely believed that the flux of Ca2+ leaving the cytosol by entering mitochondria is inconsequential with respect to EC coupling.12,14,23 However, the quantitative impact of [Ca2+]c buffering by mitochondria has neither been fully resolved14,27 nor has it been assessed in concert with its effects on bioenergetics. Thus, in the present study, we use a novel technique to monitor both [Ca2+]c and [Ca2+]m within the same cell to elucidate the kinetics of mitochondrial Ca2+ uptake and its consequences for EC coupling.
Furthermore, because mitochondrial Ca2+ efflux is governed by the mitochondrial Na+/Ca2+ exchanger (mNCE), we hypothesized that elevated [Na+]i may reduce steady-state [Ca2+]m and consequently affect the regulation of oxidative phosphorylation. Hence, we tested whether elevated [Na+]i adversely affects energy supply and demand matching in cardiac cells, with potential implications for cardiac diseases such as hypertrophy and failure,29–31 in which intracellular [Na+] ([Na+]i) is elevated.
Materials and Methods
An expanded Materials and Methods section is in the online data supplement, available at http://circres.ahajournals.org.
Briefly, isolated guinea pig cardiomyocytes were incubated with rhod-2-acetoxymethyl ester (rhod-2 AM) (3 µmol/L) to monitor [Ca2+]m. Using the patch-clamp technique, cytosolic traces of rhod-2 were eliminated by whole-cell dialysis with a pipette solution containing indo-1 (75 µmol/L) to monitor [Ca2+]c. To measure NADH autofluorescence together with [Ca2+]m, myocytes were dialyzed with dye-free pipette solution. To determine ΔΨm, cells were incubated with tetramethyl rhodamine methyl ester (TMRM) (50 nmol/L). [Ca2+]c transients were elicited by voltage steps from −80 mV to +10 mV at 1 to 4 Hz, in the absence and presence of isoproterenol (1 to 100 nmol/L).
Results
Rapid Kinetics of Mitochondrial Ca2+ Uptake
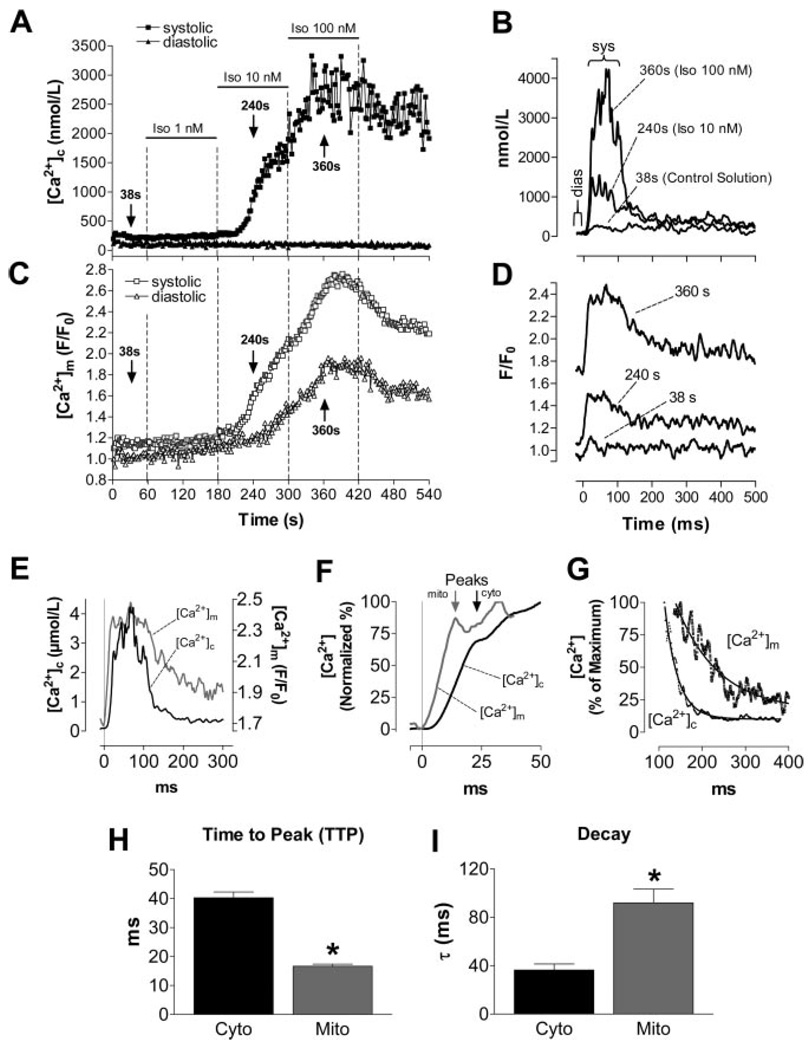
[Ca2+]c and [Ca2+]m were recorded in the same cell using the dual dye loading of rhod-2 and indo-1. After pulsing at 1 Hz for 1 minute under control conditions, isoproterenol increased [Ca2+]c transients (Figure 2A). Notably, even before isoproterenol application, a rapid [Ca2+]m transient was observed during the [Ca2+]c transient (Figure 2A through 2D), with an amplitude (Δ) that correlated linearly with Δ[Ca2+]c (Figure 3C). Similarly, raising extracellular [Ca2+] from 2 to 8 mmol/L also increased Δ[Ca2+]c and Δ[Ca2+]m (supplemental Figure VIII). When comparing the kinetics of [Ca2+]c and [Ca2+]m transients in the presence of isoproterenol (100 nmol/L; Figure 2E through 2I), the upstroke of the [Ca2+]m transient preceded that of [Ca2+]c, resulting in a shorter time-to-peak (TTP) of [Ca2+]m than of [Ca2+]c (Figure 2F and 2H). In contrast, the decay of [Ca2+]m was ≈2.5-fold slower than the [Ca2+]c decay (Figure 2G and 2I). This slower decay of [Ca2+]m resulted in a stepwise accumulation of diastolic [Ca2+]m in response to increasing Δ[Ca2+]c (Figure 2C), even though diastolic [Ca2+]c remained constant over the course of the experiment (Figures 2A and 3A).
Figure 2.
Representative experiment determining [Ca2+]c and [Ca2+]m in the same cell. [Ca2+]c transients were elicited at 1 Hz in the absence and presence of isoproterenol (Iso; 1 to 100 nmol/L) (A and C). The [Ca2+] transients in B and D were recorded at the indicated time points of the protocol (arrows in A and C). E through G, [Ca2+]c and [Ca2+]m transients at 100 nmol/L isoproterenol. H and I, Aggregate data for TTP and the exponential time constant, τ, for the decay of [Ca2+]c and [Ca2+]m, respectively. *P<0.0001 vs [Ca2+]c (n=10).
Figure 3.
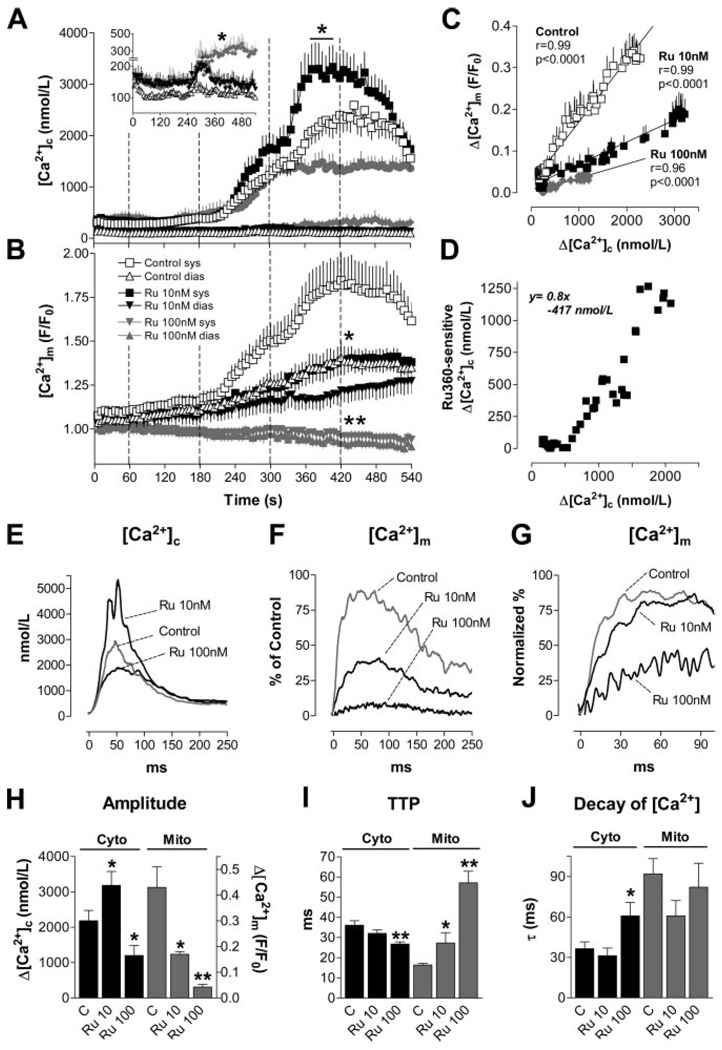
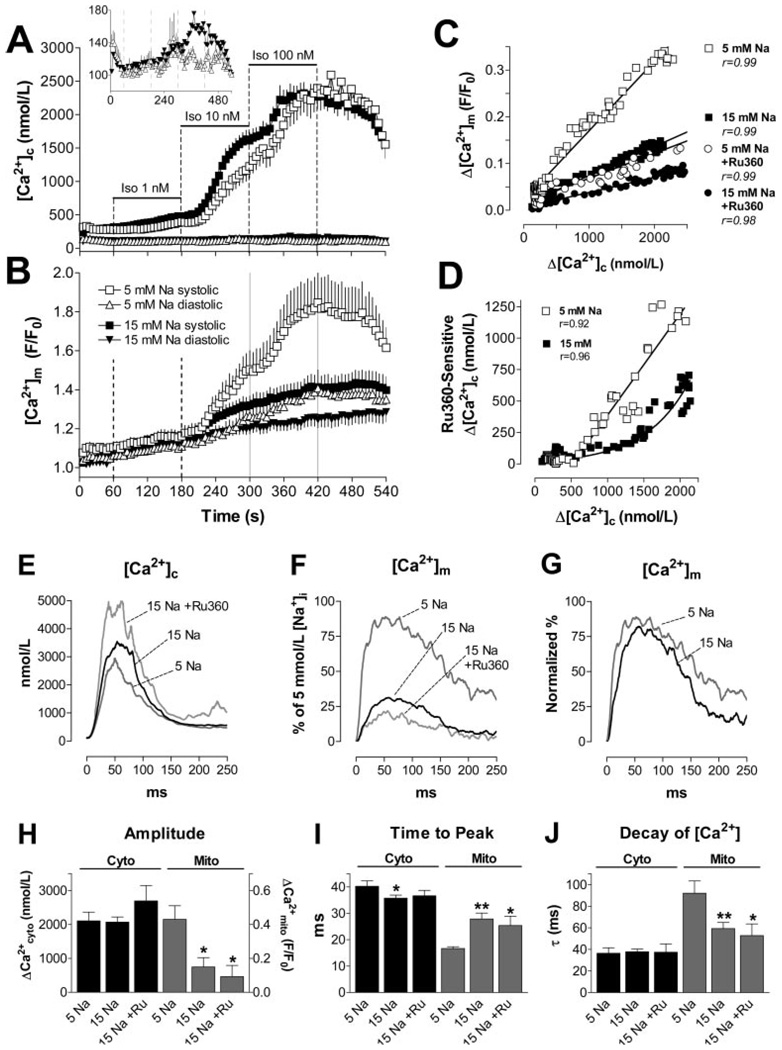
A and B, [Ca2+]c and [Ca2+]m in the absence (Control; A, cytosolic, n=20; B, mitochondrial, n=10) or presence of Ru360 (10 nmol/L, n=15/8; 100 nmol/L, n=7/7). Dotted lines indicate the switch of superfusing solutions (isoproterenol, 1 to 100 nmol/L) as indicated in Figure 2A. Inset in A, Diastolic [Ca2+]c at higher resolution. C and D, Δ[Ca2+]m (C) or Ru360-sensitive Δ[Ca2+]c (D; =Δ[Ca2+]c/Ru360(10 nmol/L)–Δ[Ca2+]c/Control), plotted against Δ[Ca2+]c, respectively. E through J, Aggregate results for [Ca2+] transient kinetics in the absence (Control, n=10) or presence of Ru360 (10 nmol/L, n=8; 100 nmol/L, n=7). E and F, Amplitudes of [Ca2+]c and [Ca2+]m transients. G, Normalized values for [Ca2+]m transients. SEM omitted for clarity. H through J, Amplitude, TTP, and τ for decay of [Ca2+]c and [Ca2+]m transients, respectively. *P<0.05, **P<0.01 vs control.
Inhibiting Mitochondrial Ca2+ Uptake
When Ru360, a specific inhibitor of the MCU,32,33 was added to the pipette solution (10 or 100 nmol/L), Δ[Ca2+]m was concentration-dependently decreased (Figure 3B, 3F and 3H), and diastolic accumulation of [Ca2+]m was blunted (Figure 3B). This was associated with a prolonged TTP, but unchanged rate of decay of [Ca2+]m (Figure 3G, 3I and 3J). Conversely, the amplitude of [Ca2+]c transients was enhanced at 10 nmol/L but reduced at 100 nmol/L of Ru360 (Figure 3A, 3E and 3H). The TTP of [Ca2+]c slightly shortened (Figure 3I), whereas the decay of [Ca2+]c was prolonged at 100 nmol/L Ru360 (Figure 3E and 3J). At 10 nmol/L Ru360, diastolic [Ca2+]c was increased by ≈50 nmol/L throughout the experiment (inset in Figure 3A). When Δ[Ca2+]c increased in response to isoproterenol, a transient occurrence of extrasystoles induced a reversible increase of diastolic [Ca2+]c (between 240 and 360 seconds). At 100 nmol/L Ru360, however, these extrasystoles persisted throughout the rest of the experiment in 3 of 7 cells (not shown), resulting in an increase of diastolic [Ca2+]c by up to ≈200 nmol/L (P<0.05; inset in Figure 3A).
In the presence of Ru360, the slope of the linear relationship between Δ[Ca2+]m and Δ[Ca2+]c was reduced by 64% and 77% for 10 and 100 nmol/L, respectively (Figure 3C). As an estimate of the effects of Ru360 on the steady-state [Ca2+]c transient amplitude, the Ru360-sensitive component of Δ[Ca2+]c was calculated as the difference between Δ[Ca2+]c measured in the presence and absence of 10 nmol/L Ru360 (=Δ[Ca2+]c/Ru360(10 nmol/L)–Δ[Ca2+]c/Control) and plotted as a function of Δ[Ca2+]c/Control (Figure 3D). Above a threshold of Δ[Ca2+]c=519 nmol/L, the Ru360-sensitive component of Δ[Ca2+]c was well fit by the linear function y=0.8×–417 nmol/L.
Inhibiting Mitochondrial Ca2+ Efflux
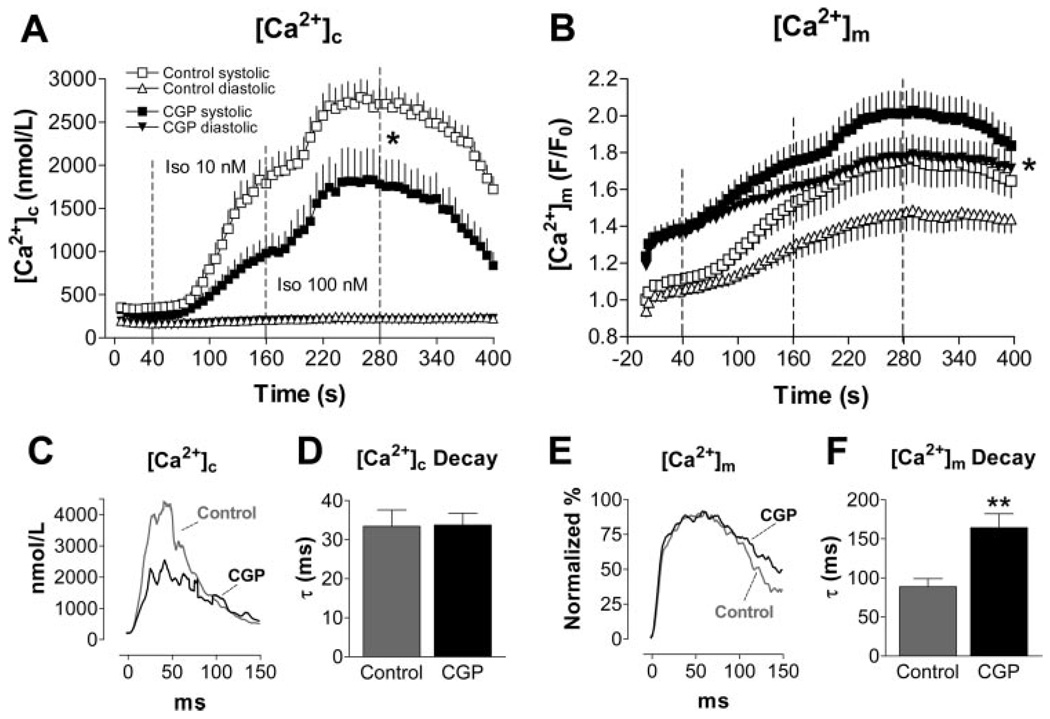
[Ca2+]m efflux in cardiac cells is governed by the mNCE.8,10 Intracellular application of CGP-37157 (1 µmol/L), an inhibitor of the mNCE,34 enhanced [Ca2+]m accumulation at 3-Hz stimulation frequency (Figure 4B). It is of note that already before initiation of the pulse protocol (after equilibrating the cytosol with CGP-37157 for ≈10 minutes), resting [Ca2+]m was elevated by 24% compared with control conditions (at time=0, Figure 4B; signals normalized to fluorescence before cell dialysis). Consistent with enhanced buffering of Ca2+ in the mitochondrial compartment, Δ[Ca2+]c transients were reduced in the presence of CGP-37157 (Figure 4A and 4C). Whereas [Ca2+]c decay was unaffected by CGP-37157, the [Ca2+]m decay was prolonged (Figure 4E and 4F).
Figure 4.
[Ca2+]c and [Ca2+]m at 3-Hz stimulation frequency in the absence (Control; n = 16) or presence of CGP-37157 (intracellular application, 1 µmol/L; n = 15), respectively. Average [Ca2+]c or [Ca2+]m plotted against the time of the whole experiment (A and B) or the time of a single transient at 100 nmol/L isoproterenol (C and E; SEM omitted for clarity). Average time constant (τ) of the rate of decay of [Ca2+]c (D) or [Ca2+]m (F), respectively. *P<0.05, **P<0.0001 vs control.
Increasing Stimulation Frequency
Because [Ca2+]m decay was ≈2.5-fold slower than [Ca2+]c decay during β-adrenergic stimulation (Figure 2G and 2I), the stimulation frequency would be expected to have an important impact on diastolic accumulation of [Ca2+]m. In fact, at 3 Hz, diastolic accumulation of [Ca2+]m was substantially more pronounced than at 1 Hz (at comparable [Ca2+]c; supplemental Figure IX).
Elevating [Na+]i
Because the mNCE governs mitochondrial Ca2+ efflux8,10 (Figure 4), and [Na+]i is increased in various cardiac disease states,29–31 we tested whether elevating [Na+]i would affect [Ca2+]c and [Ca2+]m. Increasing [Na+]i from 5 to 15 mmol/L in the pipette solution increased Δ[Ca2+]c ≈1.4- to 1.5-fold in control conditions or in the presence of low concentrations of isoproterenol. At 100 nmol/L isoproterenol, the enhancement of Δ[Ca2+]c by [Na+]i was less evident, as expected because the SR Ca2+ load would be high with maximal β-adrenergic stimulation (supplemental Figure X; Figure 5A, 5E and 5H). In contrast to the effect on Δ[Ca2+]c, elevated [Na+]i decreased the amplitude of the [Ca2+]m transients (Figure 5B, 5F and 5H). This was associated with a longer TTP but a faster decay of [Ca2+]m at higher [Na+]i (Figure 5G, 5I and 5J). Consequently, diastolic accumulation of [Ca2+]m was blunted (Figure 5B). Both the slope of the correlation between Δ[Ca2+]m and Δ[Ca2+]c (Figure 5C) and the Ru360-sensitive component of Δ[Ca2+]c and [Ca2+]c were reduced (Figure 5D), indicating that for any given [Ca2+]c transient, less Ca2+ entered the mitochondria at higher [Na+]i.
Figure 5.
A and B, [Ca2+]c (A: 5 mmol/L [Na+]i, n=20; 15 mmol/L [Na+]i, n=46) and [Ca2+]m transients (B: n = 10/24) at 1 Hz. Inset in A, Diastolic [Ca2+]c at higher resolution. C, Δ[Ca2+]m plotted against Δ[Ca2+]c at 5 and 15 mmol/L [Na+]i in the absence and presence of Ru360 (10 nmol/L), respectively. D, Ru360-sensitive Δ[Ca2+]c (as in Figure 3D) plotted against Δ[Ca2+]c at 5 and 15 mmol/L [Na+]i. E through J, Kinetics of [Ca2+]c and [Ca2+]m transients at 5 mmol/L [Na+]i (n=10) and 15 mmol/L [Na+]i in the absence (n=21) or presence of Ru360 (10 nmol/L; n=9). H through J, Amplitude, TTP, and τ for decay of [Ca2+]c and [Ca2+]m, respectively. *P<0.05; **P<0.01 vs 5 mmol/L [Na+]i.
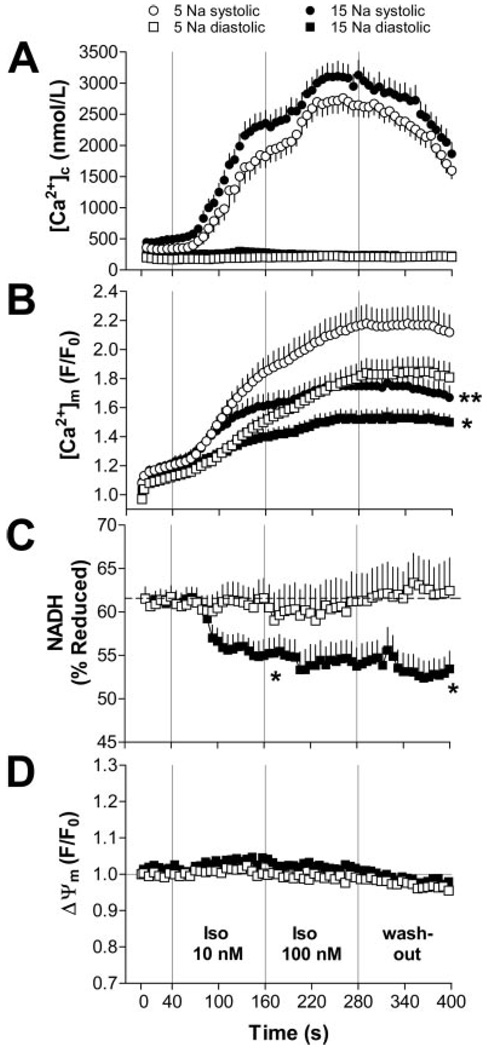
Similar results were obtained when 5 and 15 mmol/L [Na+]i were compared at a higher stimulation frequency (3 Hz; Figure 6A and 6B; supplemental Figure XI). The relative decrease in Δ[Ca2+]m by higher [Na+]i was less pronounced at 3 Hz (−35%; supplemental Figure XIE and XIG) compared with 1-Hz stimulation (−66%; Figure 5F and 5H). Again, inhibiting the mNCE with CGP-37157 (1 µmol/L) increased resting [Ca2+]m and potentiated accumulation of diastolic [Ca2+]m (supplemental Figure XII).
Figure 6.
[Ca2+]c (A: 5 mmol/L [Na+]i, n=29; 15 mmol/L [Na+]i, n=38), [Ca2+]m (B: n=32/45), NADH (C: n=13/14), and Δψm (D: n=8/7) in myocytes paced at 3 Hz. Note that data were not collected in the same cells, but as combinations of either [Ca2+]c/ [Ca2+]m, [Ca2+]m/NADH, or Δψm/[Ca2+]c (see Materials and Methods). *P<0.05, **P<0.01 vs 5 mmol/L [Na+]i.
Implications for Mitochondrial Energetics
To estimate the consequences of reduced [Ca2+]m for mitochondrial energetics, we determined the redox state of NADH/NAD+ (Figure 6C) and ΔΨm (Figure 6D) using the same protocol as used for [Ca2+]c and [Ca2+]m (3 Hz; Figure 6A and 6B). At 5 mmol/L [Na+]i, NADH was well maintained during the protocol (Figure 6C). In contrast, at 15 mmol/L [Na+]i, net oxidation of NADH occurred when workload increased in response to isoproterenol. NADH remained partially oxidized throughout the rest of the experiment at 15 mmol/L [Na+]i. In contrast, ΔΨm was unaffected by β-adrenergic stimulation at either 5 or 15 mmol/L [Na+]i (Figure 6D).
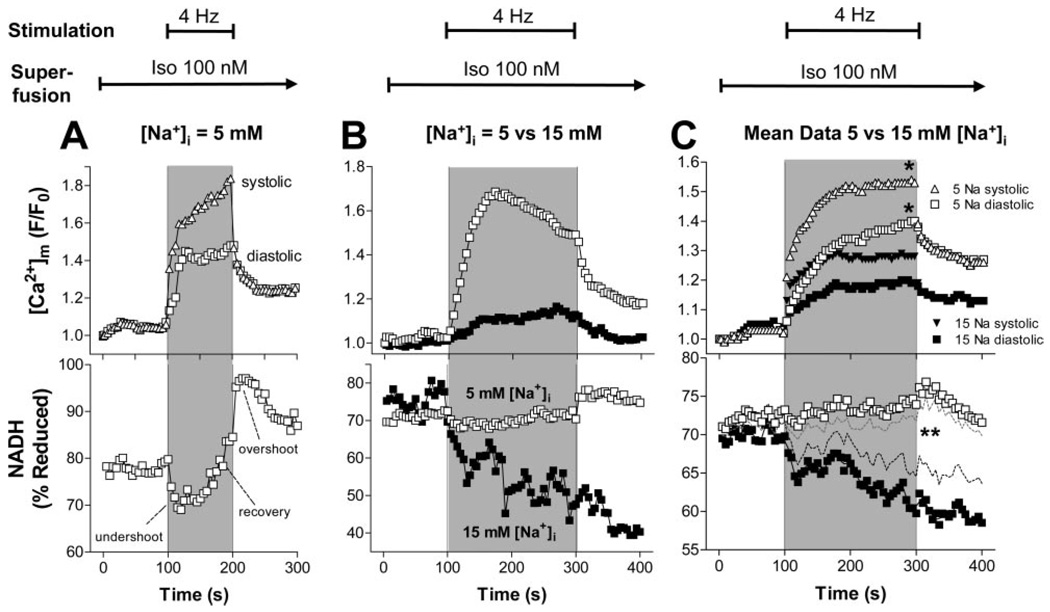
To induce a more abrupt change in workload, we superfused resting myocytes with isoproterenol (100 nmol/L) and then paced cells at 4 Hz for 100 seconds (Figure 7A) or 200 seconds (Figure 7B and 7C). At 5 mmol/L [Na+]i, pacing increased both systolic and diastolic [Ca2+]m (Figure 7A, top). At the onset of stimulation, rapid oxidation of NADH occurred (“undershoot”), followed by recovery of NADH in parallel with increasing [Ca2+]m (Figure 7A). After cessation of stimulation, an “overshoot” of NADH was observed, followed by a gradual recovery toward the initial resting level. The recovery was preceded by a decline of [Ca2+]m.
Figure 7.
[Ca2+]m (upper panels) and NADH (lower panels) in representative cells (A and B) or as aggregate data (C) at 5 or 15 mmol/L [Na+]i, respectively (C: 5 mmol/L [Na+]i, n = 16; 15 mmol/L [Na+]i, n=13). Resting myocytes were held at EH=−80 mV, and after recording the first data point, were superfused with 100 nmol/L isoproterenol. After 100 seconds, myocytes were pulsed at 4 Hz for 100 seconds (A) or 200 seconds (B and C), respectively. After pacing, cells were held at −80 mV for another 100 seconds. In C, SEM are omitted for clarity (top) or indicated by dashed lines (bottom). *P<0.05, 5 vs 15 mmol/L [Na+]i.
The stimulation protocol was extended to 200 seconds to allow more time for NADH recovery. At 15 mmol/L [Na+]i, mitochondrial Ca2+ uptake was blunted (Figure 7B and 7C, upper panels). The initial oxidation of NADH was potentiated, and the recovery of NADH was blunted or absent at higher [Na+]i (Figure 7B and 7C, lower panels). In contrast, at 5 mmol/L [Na+]i, NADH was maintained, which was related to a less pronounced undershoot and a more prominent recovery of NADH after the onset of work.
Discussion
The key findings of the present study are that (1) mitochondria take up Ca2+ rapidly and buffer [Ca2+]c during EC coupling; (2) the kinetics of mitochondrial Ca2+ uptake are compatible with the concept of a “mitochondrial microdomain”24–28; and (3) elevating [Na+]i reduces mitochondrial Ca2+ uptake, which impairs the matching process of energy supply and demand by oxidizing the NADH/NAD+ redox potential.
Rapid Mitochondrial Ca2+ Transients
During each [Ca2+]c transient, a rapid [Ca2+]m transient occurred. Contamination of the mitochondrial signal by cytosolic traces of rhod-2 was eliminated by equilibrating the cytoplasm with rhod-2–free pipette solution (see the online data supplement). The amplitude of the [Ca2+]m transient was linearly correlated with Δ[Ca2+]c, indicating a close association between mitochondrial Ca2+ uptake and SR Ca2+ release. The MCU inhibitor Ru360 (10 nmol/L) reduced Δ[Ca2+]m and prolonged its TTP, whereas it increased Δ[Ca2+]c (Figure 3). Conversely, the mNCE inhibitor CGP-37157 prolonged the decay of [Ca2+]m, but not of [Ca2+]c, and elevated diastolic [Ca2+]m (Figure 4). These findings strongly support the contention that rhod-2 selectively reported changes in mitochondrial matrix Ca2+, the net effect of Ca2+ uptake via the MCU and Ca2+ efflux through the mNCE. Concerning the rapid beat-to-beat changes of [Ca2+]m during EC coupling, the results differ from some previous studies13–17 but are in general agreement with others.18–22
Mitochondrial Ca2+-Uptake Kinetics
In the present study, the peak of [Ca2+]m preceded the peak of [Ca2+]c by ≈20 ms during β-adrenergic stimulation. It is rather unlikely that this observation is related to differential dye kinetics or buffering capacities of the mitochondrial matrix compared with the cytosol (as discussed in the online data supplement). Although previous studies reported rapid [Ca2+]m transients during EC coupling,18–22 none of them observed [Ca2+]m transients preceding [Ca2+]c transients. In contrast, [Ca2+]m transients typically followed the [Ca2+]c transients with a lag of ≈20 to 50 ms. The reasons for this discrepancy are unclear, but in all but one22 of these studies, [Ca2+]c and [Ca2+]m were not collected at the same time or in the same cell, and the temporal resolution of the signals was low, making it difficult to compare kinetics directly.
Other studies did not observe beat-to-beat changes of [Ca2+]m during [Ca2+]c transients at all.13–17 In most of those studies,13–16 [Ca2+]m was reported by indo-1 AM, and cytosolic indo-1 was quenched with MnCl2. However, Mn2+ competes with Ca2+ for the MCU and may be taken up into mitochondria as well.4,10 This could quench mitochondrial indo-1 and possibly inhibit the MCU. Because the mNCE is also inhibited by Mn2+,10 mitochondrial Ca2+-transport kinetics may have been perturbed under these conditions. Moreover, in 1 study16 using the Mn2+-quench method, [Ca2+]c was raised by reverse-mode Na+/Ca2+ exchange, which is unlikely to increase Ca2+ in the vicinity of the mitochondria as much, or as quickly, as SR Ca2+ release.12,16,23
Mitochondrial Ca2+-Decay Kinetics
The decay of [Ca2+]m was ≈2.5-fold slower than the decay of [Ca2+]c (in the presence of isoproterenol). An increase of amplitude (Figures 2 through 6) or frequency (supplemental Figure IX) of [Ca2+]c transients led to a stepwise accumulation of diastolic [Ca2+]m. In response to β-adrenergic stimulation, SR Ca2+-ATPase velocity is substantially accelerated by protein kinase A (PKA)-mediated phosphorylation of phospholamban,12 whereas acceleration of mNCE activity has not been reported.8,10 Accordingly, in our experiments, decay of [Ca2+]c, but not [Ca2+]m, was accelerated by isoproterenol (supplemental Figure VII). This differential regulation of SR Ca2+-ATPase and mNCE may be of physiological importance, because in vivo, β-adrenergic stimulation increases both the amplitude and frequency of [Ca2+]c transients. Under these conditions, shortening of the [Ca2+]c transient, but not the [Ca2+]m transient, facilitates a stepwise increase of diastolic [Ca2+]m with important bioenergetic consequences (see below), whereas diastolic [Ca2+]c, and thus diastolic (and systolic) function of the heart, is maintained.
Differences in the decay kinetics for [Ca2+]c and [Ca2+]m transients have not been reported in previous studies. 18–22 Only 1 study observed a short-term increase of diastolic [Ca2+]m, with no change in diastolic [Ca2+]c after the application of isoproterenol. In most other reports, an increase in diastolic [Ca2+]m was associated with a concordant increase in diastolic [Ca2+]c.13,15,21 In contrast, in studies reporting slow mitochondrial Ca2+-uptake kinetics, accumulation of [Ca2+]m during changes in Δ[Ca2+]c amplitude or frequency4,13,15 resembled the diastolic increase of [Ca2+]m in the present study.
Evidence for a Mitochondrial Ca2+ Microdomain
In cardiac myocytes, different subcellular microdomains display substantially different Ca2+ concentrations and kinetics.12,23 Ca2+ enters the cell through L-type Ca2+ channels (ICa,L), triggering SR Ca2+ release into the junctional cleft (Ca2+-induced Ca2+ release [CICR]) via the ryanodine receptor (RyR2 subtype).12 This induces a brief junctional Ca2+ transient that reaches ≈50 to 100 µmol/L.12,23 Junctional Ca2+ decays rapidly by diffusing into the bulk cytosol ([Ca2+]c), where it peaks later and at much lower concentrations than in the cleft.23 Because indo-1 reports [Ca2+]c primarily from the bulk phase, the earlier peak of [Ca2+]m compared with [Ca2+]c in our study indicates that mitochondria may sense an early increase of [Ca2+] in a microdomain that is closer to the SR Ca2+-release sites than the bulk cytosol. In fact, electron micrographs show that most mitochondria are located within 40 to 300 nm from the dyad and may be exposed to [Ca2+] in the range of 30 to 50 µmol/L,24,25,27 which would be sufficient to activate the MCU (Km for Ca2+≈10 to 20 µmol/L).8,10
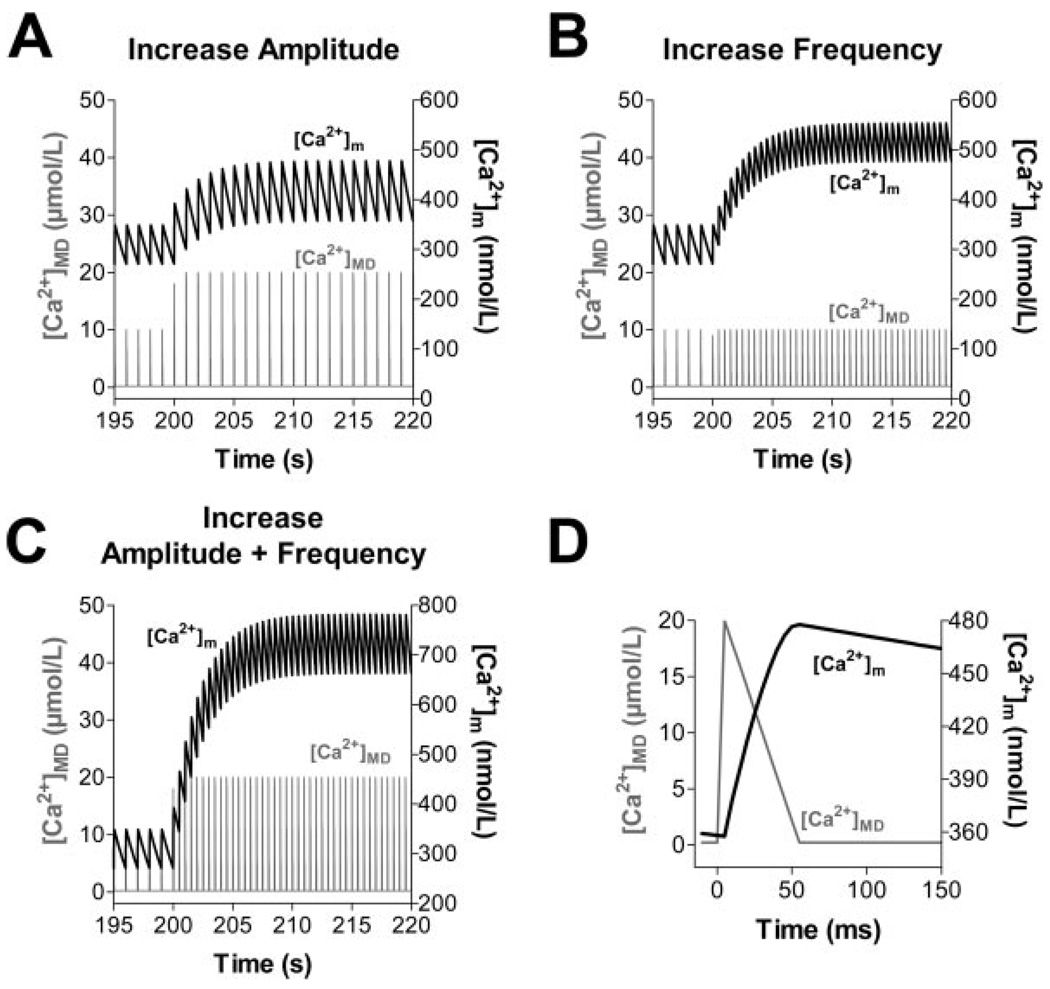
Although the molecular identity of the MCU is still unresolved, and other Ca2+-transporting systems in the inner mitochondrial membrane have been proposed (see the online data supplement for detailed discussion), we investigated whether our experimental results could be reproduced in a computer model of mitochondrial bioenergetics and Ca2+ handling5 without modifying the basic formulations of the MCU and mNCE. Pulses of Ca2+ resembling those expected to be encountered in a mitochondrial Ca2+ microdomain23–25 ([Ca2+]MD) were simulated with an exogenous Ca2+ spike function with peak [Ca2+] of either 10 or 20 µmol/L for a duration of 50 ms (Figure 8D). These pulses of [Ca2+]MD elicited rapid [Ca2+]m transients. An increase of either [Ca2+]MD amplitude (Figure 8A) or frequency (Figure 8B) independently increased diastolic [Ca2+]m. An increase in both amplitude and frequency of the pulses potentiated diastolic [Ca2+]m accumulation (Figure 8C). These simulations are in qualitative agreement with our experimental results and lend support to the hypothesis that mitochondria sense [Ca2+] in a microdomain, rather than the bulk [Ca2+]c. This interpretation is consistent with reports that caffeineinduced [Ca2+]m transients24,25 or mitochondrial Ca2+ sparks (“Ca2+ marks”)26 can be observed even when the diffusion of Ca2+ released from the SR is restricted by the presence of exogenous Ca2+ buffers.
Figure 8.
Computational modeling of [Ca2+]m, assuming a microdomain (MD) in which mitochondria are exposed to [Ca2+] pulses of 10 to 20 µmol/L for 50 ms (D) (representative pulse taken from t=215 s in A). Starting from steady-state conditions with [Ca2+]MD oscillating from 0.1 to 10 µmol/L at 1 Hz, an increase of amplitude (A, from 10 to 20 µmol/L), frequency (B, from 1 to 2 Hz) or both (C) of [Ca2+]MD transients were simulated.
Influence of Mitochondrial Ca2+ Uptake on EC Coupling
In the present study, partial inhibition of mitochondrial Ca2+ uptake by Ru360 increased the amplitude of [Ca2+]c transients and slightly elevated diastolic [Ca2+]c. Similar effects were observed in mouse myocytes treated with Ru36035 or shortly after dissipation of ΔΨm with mitochondrial uncouplers.18 In our experiments, above a threshold of Δ[Ca2+]c=519 nmol/L, the Ru360-sensitive component of Δ[Ca2+]c followed the equation y=0.8×–417 nmol/L (Figure 3D). If we consider that 10 nmol/L Ru360 inhibits Δ[Ca2+]m by 66% at a Δ[Ca2+]c of 1 µmol/L, we estimate that the beat-dependent rapid buffering effect of mitochondria decreases the steady-state [Ca2+]c transients by ≈36%. A previous report determined that mitochondria buffer ≈26% of the Ca2+ released from the SR in H9c2 myotubes.27 However, other studies,12,14,36 including our own,37 suggested that mitochondria contribute only ≈1% to the removal of [Ca2+]c. The latter studies focused on the removal of [Ca2+]c well after Ca2+ was released from the SR, perhaps not taking into account that mitochondria might already take up Ca2+ during the early phase of SR Ca2+ release.24–26
As a technical limitation, it should be noted that the indirect assessment of Ca2+ taken up by mitochondria (Figure 3D) based on the Ru360 effects relies on comparisons of [Ca2+]c in unpaired cells and under steady-state conditions. Furthermore, because rhod-2 as an indicator for [Ca2+]m was not calibrated, the current results do not allow a precise quantification of the magnitude of the fluxes across the inner mitochondrial membrane on each beat. Further studies will have to clarify these quantitative aspects in more detail.
Nevertheless, rapid buffering of [Ca2+]c by mitochondria is likely to play an important physiological role, because in a recent study, mitochondrial Ca2+ uptake preserved “local control” by preventing the propagation of SR Ca2+ release after caffeine application in mouse myocytes.35 In this context, our observation that the frequency of extrasystoles increased in the presence of isoproterenol and Ru360 (Figure 3A) warrants further investigation as to whether impaired mitochondrial Ca2+ uptake could contribute to arrhythmias.
Bioenergetic Consequences of Mitochondrial Ca2+ Uptake
To elucidate the bioenergetic consequences of mitochondrial Ca2+ uptake during EC coupling, we measured NADH together with [Ca2+]m. When [Ca2+]c transients were gradually increased by cumulatively increasing isoproterenol, the redox state of NADH was maintained at 5 mmol/L [Na+]i (Figure 6C). However, when an abrupt change of workload was simulated by pacing myocytes at 4 Hz in the presence of isoproterenol, NADH was initially oxidized, followed by a recovery phase that paralleled mitochondrial Ca2+ uptake (Figure 7). In previous studies, Brandes and Bers3,4 observed a similar phenomenon in rat cardiac trabeculae, which could be reproduced by computational modeling.5 These findings can be explained by the abrupt increase of work initiating ATP hydrolysis, which increases the availability of ADP and Pi to stimulate ATP production by the F1F0-ATPase at the expense of ΔµH (see also Figure 1). Consumption of ΔµH (rather than an increase of [Ca2+]m; see also the online data supplement) immediately stimulates electron transport, proton pumping, and the rate of NADH oxidation at the onset of work (Figure 7A, bottom). At the same time, the increase of amplitude and frequency of [Ca2+]c transients promotes mitochondrial Ca2+ uptake (Figure 7A, top), activating key dehydrogenases of the TCA cycle to facilitate (re-)reduction of oxidized NAD+.1,5,7,8 This explains the recovery of NADH in parallel with the [Ca2+]m increase3–5 (Figure 7A, bottom). When workload is withdrawn, the availability of ADP to the F1F0-ATPase abruptly decreases, and the rate of NADH oxidation decreases. Because [Ca2+]m is still elevated, the turnover of the TCA cycle remains increased, producing the typical overshoot of NADH (Figure 7A, bottom). NADH normalizes when [Ca2+]m decreases back to baseline.
Effect of Elevated [Na+]i on Cytosolic and Mitochondrial [Ca2+]
The physiological range of [Na+]i in resting cardiac myocytes is ≈5 to 15 mmol/L and is species dependent.31 Whereas in small animals with high heart rates (ie, mice and rats), [Na+]i is 10 to 15 mmol/L, larger animals (including guinea pigs) have [Na+]i between 5 and 10 mmol/L.31 Under physiological conditions, [Na+]i rises by several millimoles per liter in response to an increase of heart rate.30,38 Under pathological conditions, [Na+]i is elevated at all stimulation frequencies in cardiac hypertrophy and failure.29–31
An increase of [Na+]i increases SR Ca2+ load (and thus Δ[Ca2+]c) by decreasing forward-mode Ca2+ extrusion and enhancing reverse-mode Na+/Ca2+-exchange activity during the action potential.29,39,40 In our experiments, elevation of [Na+]i from 5 to 15 mmol/L increased Δ[Ca2+]c≈1.5-fold under basal conditions, or at low concentrations of isoproterenol (supplemental Figure X). This increase was similar to previous studies showing an approximate doubling of Δ[Ca2+]c in [Na+]i-loaded cells at 1 Hz.39,41 The effect of high [Na+]i on Δ[Ca2+]c was less pronounced during maximal β-adrenergic stimulation, because SR Ca2+ load is expected to be already near-maximally elevated (supplemental Figure X).
Increasing [Na+]i from 5 to 15 mmol/L accelerated the decay of [Ca2+]m, which is presumably related to an increased electrochemical gradient driving the exchange of cytosolic Na+ for intramitochondrial Ca2+ via the mNCE (Kd for [Na+]i≈5 to 12 mmol/L5,42,43) and is consistent with experiments on isolated mitochondria.43,44 Unexpectedly, the upstroke velocity and amplitude of [Ca2+]m transients were substantially decreased. In simulations of [Ca2+]m dynamics defined by fast uptake through the MCU and slower efflux through the mNCE (Figure 8), the effect of high [Na+]i on the rising phase of the [Ca2+]m transient could not be reproduced by acceleration of mNCE alone. Understanding this finding will require further investigation (several possibilities are discussed in the online data supplement).
The effects of elevated [Na+]i on the amplitude and decay velocity of [Ca2+]m transients resulted in decreased diastolic accumulation of [Ca2+]m (Figure 5B). Keeping in mind the frequency dependence of [Na+]i,30,38 a physiological implication of this observation in vivo may be that increased [Na+]i at higher heart rates prevents mitochondrial Ca2+ overload, potentially protecting mitochondria from a permeability transition and cell death.45 In this context, the higher resting [Na+]i in species with higher heart rates may play a similar role. For example, rapid [Ca2+]m transients have been observed in intact guinea pig, but not rat cardiac myocytes.46
Effect of Elevated [Na+]i on Mitochondrial Energetics
The basal redox state of mitochondrial NADH was not different at 5 versus 15 mmol/L [Na+]i. However, when workload was increased either continuously (Figure 6) or abruptly (Figure 7), NADH was partially oxidized at 15 mmol/L [Na+]i, whereas it was maintained at 5 mmol/L [Na+]i. The underlying mechanism is presumably a lack of Ca2+-induced stimulation of TCA cycle dehydrogenases attributable to less mitochondrial Ca2+ uptake at higher [Na+]i.
Conclusions
The results of our study suggest that during EC coupling, elevated [Na+]i reduces rapid mitochondrial Ca2+ uptake and oxidizes the NADH/NAD+ redox potential. In the failing heart, [Na+]i is elevated,29–31 and SR Ca2+ release is decreased. According to our results, both processes would diminish mitochondrial Ca2+ uptake and NADH production. On the other hand, elevated heart rate and increased preload may increase the energy demand of the failing heart. We propose that this energetic mismatch may contribute to energy starvation of the failing heart,47 which eventually leads to progressive myocardial injury and decompensation of cardiac function.
Supplementary Material
Acknowledgments
Sources of Funding
This work was supported by NIH grants R01 HL61711 and P50 HL-52307 (to B.O’R.). C.M. is supported by the Deutsche Forschungsgemeinschaft (Emmy Noether-Programm).
Footnotes
This manuscript was sent to Harry Fozzard, Consulting Editor, for review by expert referees, editorial decision, and final disposition.
Disclosures
None.
References
- 1.Balaban RS. Cardiac energy metabolism homeostasis: role of cytosolic calcium. J Mol Cell Cardiol. 2002;34:1259–1271. doi: 10.1006/jmcc.2002.2082. [DOI] [PubMed] [Google Scholar]
- 2.Territo PR, French SA, Dunleavy MC, Evans FJ, Balaban RS. Calcium activation of heart mitochondrial oxidative phosphorylation: rapid kinetics of mVO2, NADH, AND light scattering. J Biol Chem. 2001;276:2586–2599. doi: 10.1074/jbc.M002923200. [DOI] [PubMed] [Google Scholar]
- 3.Brandes R, Bers DM. Intracellular Ca2+ increases the mitochondrial NADH concentration during elevated work in intact cardiac muscle. Circ Res. 1997;80:82–87. doi: 10.1161/01.res.80.1.82. [DOI] [PubMed] [Google Scholar]
- 4.Brandes R, Bers DM. Simultaneous measurements of mitochondrial NADH and Ca(2 +) during increased work in intact rat heart trabeculae. Biophys J. 2002;83:587–604. doi: 10.1016/S0006-3495(02)75194-1. [DOI] [PMC free article] [PubMed] [Google Scholar]
- 5.Cortassa S, Aon MA, Marban E, Winslow RL, O’Rourke B. An integrated model of cardiac mitochondrial energy metabolism and calcium dynamics. Biophys J. 2003;84:2734–2755. doi: 10.1016/S0006-3495(03)75079-6. [DOI] [PMC free article] [PubMed] [Google Scholar]
- 6.Saks VA, Kuznetsov AV, Vendelin M, Guerrero K, Kay L, Seppet EK. Functional coupling as a basic mechanism of feedback regulation of cardiac energy metabolism. Mol Cell Biochem. 2004;256–257:185–199. doi: 10.1023/b:mcbi.0000009868.92189.fb. [DOI] [PubMed] [Google Scholar]
- 7.Gunter TE, Gunter KK, Sheu SS, Gavin CE. Mitochondrial calcium transport: physiological and pathological relevance. Am J Physiol. 1994;267:C313–C339. doi: 10.1152/ajpcell.1994.267.2.C313. [DOI] [PubMed] [Google Scholar]
- 8.Denton RM, McCormack JG. Ca2+ transport by mammalian mitochondria and its role in hormone action. Am J Physiol. 1985;249:E543–E554. doi: 10.1152/ajpendo.1985.249.6.E543. [DOI] [PubMed] [Google Scholar]
- 9.Huser J, Blatter LA, Sheu SS. Mitochondrial calcium in heart cells: beat-to-beat oscillations or slow integration of cytosolic transients? J Bioenerg Biomembr. 2000;32:27–33. doi: 10.1023/a:1005556227425. [DOI] [PubMed] [Google Scholar]
- 10.Gunter TE, Pfeiffer DR. Mechanisms by which mitochondria transport calcium. Am J Physiol. 1990;258:C755–C786. doi: 10.1152/ajpcell.1990.258.5.C755. [DOI] [PubMed] [Google Scholar]
- 11.Hansford RG. Relation between mitochondrial calcium transport and control of energy metabolism. Rev Physiol Biochem Pharmacol. 1985;102:1–72. doi: 10.1007/BFb0034084. [DOI] [PubMed] [Google Scholar]
- 12.Bers DM. Cardiac excitation-contraction coupling. Nature. 2002;415:198–205. doi: 10.1038/415198a. [DOI] [PubMed] [Google Scholar]
- 13.Miyata H, Silverman HS, Sollott SJ, Lakatta EG, Stern MD, Hansford RG. Measurement of mitochondrial free Ca2+ concentration in living single rat cardiac myocytes. Am J Physiol. 1991;261:H1123–H1134. doi: 10.1152/ajpheart.1991.261.4.H1123. [DOI] [PubMed] [Google Scholar]
- 14.Bassani RA, Bassani JW, Bers DM. Mitochondrial and sarcolemmal Ca2+ transport reduce [Ca2+]i during caffeine contractures in rabbit cardiac myocytes. J Physiol. 1992;453:591–608. doi: 10.1113/jphysiol.1992.sp019246. [DOI] [PMC free article] [PubMed] [Google Scholar]
- 15.Di Lisa F, Gambassi G, Spurgeon H, Hansford RG. Intramitochondrial free calcium in cardiac myocytes in relation to dehydrogenase activation. Cardiovasc Res. 1993;27:1840–1844. doi: 10.1093/cvr/27.10.1840. [DOI] [PubMed] [Google Scholar]
- 16.Zhou Z, Matlib MA, Bers DM. Cytosolic and mitochondrial Ca2+ signals in patch clamped mammalian ventricular myocytes. J Physiol. 1998;507(pt 2):379–403. doi: 10.1111/j.1469-7793.1998.379bt.x. [DOI] [PMC free article] [PubMed] [Google Scholar]
- 17.Moravec CS, Bond M. Effect of inotropic stimulation on mitochondrial calcium in cardiac muscle. J Biol Chem. 1992;267:5310–5316. [PubMed] [Google Scholar]
- 18.Isenberg G, Han S, Schiefer A, Wendt-Gallitelli MF. Changes in mitochondrial calcium concentration during the cardiac contraction cycle. Cardiovasc Res. 1993;27:1800–1809. doi: 10.1093/cvr/27.10.1800. [DOI] [PubMed] [Google Scholar]
- 19.Chacon E, Ohata H, Harper IS, Trollinger DR, Herman B, Lemasters JJ. Mitochondrial free calcium transients during excitation-contraction coupling in rabbit cardiac myocytes. FEBS Lett. 1996;382:31–36. doi: 10.1016/0014-5793(96)00138-x. [DOI] [PubMed] [Google Scholar]
- 20.Trollinger DR, Cascio WE, Lemasters JJ. Selective loading of Rhod 2 into mitochondria shows mitochondrial Ca2+ transients during the contractile cycle in adult rabbit cardiac myocytes. Biochem Biophys Res Commun. 1997;236:738–742. doi: 10.1006/bbrc.1997.7042. [DOI] [PubMed] [Google Scholar]
- 21.Ohata H, Chacon E, Tesfai SA, Harper IS, Herman B, Lemasters JJ. Mitochondrial Ca2+ transients in cardiac myocytes during the excitationcontraction cycle: effects of pacing and hormonal stimulation. J Bioenerg Biomembr. 1998;30:207–222. doi: 10.1023/a:1020588618496. [DOI] [PubMed] [Google Scholar]
- 22.Robert V, Gurlini P, Tosello V, Nagai T, Miyawaki A, Di Lisa F, Pozzan T. Beat-to-beat oscillations of mitochondrial [Ca2+] in cardiac cells. EMBO J. 2001;20:4998–5007. doi: 10.1093/emboj/20.17.4998. [DOI] [PMC free article] [PubMed] [Google Scholar]
- 23.Shannon TR, Wang F, Puglisi J, Weber C, Bers DM. A mathematical treatment of integrated Ca dynamics within the ventricular myocyte. Biophys J. 2004;87:3351–3371. doi: 10.1529/biophysj.104.047449. [DOI] [PMC free article] [PubMed] [Google Scholar]
- 24.Sharma VK, Ramesh V, Franzini-Armstrong C, Sheu SS. Transport of Ca2+ from sarcoplasmic reticulum to mitochondria in rat ventricular myocytes. J Bioenerg Biomembr. 2000;32:97–104. doi: 10.1023/a:1005520714221. [DOI] [PubMed] [Google Scholar]
- 25.Szalai G, Csordas G, Hantash BM, Thomas AP, Hajnoczky G. Calcium signal transmission between ryanodine receptors and mitochondria. J Biol Chem. 2000;275:15305–15313. doi: 10.1074/jbc.275.20.15305. [DOI] [PubMed] [Google Scholar]
- 26.Pacher P, Thomas AP, Hajnoczky G. Ca2+ marks: miniature calcium signals in single mitochondria driven by ryanodine receptors. Proc Natl Acad Sci USA. 2002;99:2380–2385. doi: 10.1073/pnas.032423699. [DOI] [PMC free article] [PubMed] [Google Scholar]
- 27.Pacher P, Csordas P, Schneider T, Hajnoczky G. Quantification of calcium signal transmission from sarco-endoplasmic reticulum to the mitochondria. J Physiol. 2000;529(pt 3):553–564. doi: 10.1111/j.1469-7793.2000.00553.x. [DOI] [PMC free article] [PubMed] [Google Scholar]
- 28.Rizzuto R, Duchen MR, Pozzan T. Flirting in little space: the ER/mitochondria Ca2+ liaison. Sci STKE. 2004;2004 doi: 10.1126/stke.2152004re1. re1. [DOI] [PubMed] [Google Scholar]
- 29.Despa S, Islam MA, Weber CR, Pogwizd SM, Bers DM. Intracellular Na(+) concentration is elevated in heart failure but Na/K pump function is unchanged. Circulation. 2002;105:2543–2548. doi: 10.1161/01.cir.0000016701.85760.97. [DOI] [PubMed] [Google Scholar]
- 30.Pieske B, Maier LS, Piacentino V, 3rd, Weisser J, Hasenfuss G, Houser S. Rate dependence of [Na+]i and contractility in nonfailing and failing human myocardium. Circulation. 2002;106:447–453. doi: 10.1161/01.cir.0000023042.50192.f4. [DOI] [PubMed] [Google Scholar]
- 31.Pieske B, Houser SR. [Na+]i handling in the failing human heart. Cardiovasc Res. 2003;57:874–886. doi: 10.1016/s0008-6363(02)00841-6. [DOI] [PubMed] [Google Scholar]
- 32.Matlib MA, Zhou Z, Knight S, Ahmed S, Choi KM, Krause-Bauer J, Phillips R, Altschuld R, Katsube Y, Sperelakis N, Bers DM. Oxygen-bridged dinuclear ruthenium amine complex specifically inhibits Ca2+ uptake into mitochondria in vitro and in situ in single cardiac myocytes. J Biol Chem. 1998;273:10223–10231. doi: 10.1074/jbc.273.17.10223. [DOI] [PubMed] [Google Scholar]
- 33.Kirichok Y, Krapivinsky G, Clapham DE. The mitochondrial calcium uniporter is a highly selective ion channel. Nature. 2004;427:360–364. doi: 10.1038/nature02246. [DOI] [PubMed] [Google Scholar]
- 34.Cox DA, Conforti L, Sperelakis N, Matlib MA. Selectivity of inhibition of Na(+)-Ca2+ exchange of heart mitochondria by benzothiazepine CGP-37157. J Cardiovasc Pharmacol. 1993;21:595–599. doi: 10.1097/00005344-199304000-00013. [DOI] [PubMed] [Google Scholar]
- 35.Seguchi H, Ritter M, Shizukuishi M, Ishida H, Chokoh G, Nakazawa H, Spitzer KW, Barry WH. Propagation of Ca2+ release in cardiac myocytes: role of mitochondria. Cell Calcium. 2005;38:1–9. doi: 10.1016/j.ceca.2005.03.004. [DOI] [PubMed] [Google Scholar]
- 36.Bassani JW, Bassani RA, Bers DM. Ca2+ cycling between sarcoplasmic reticulum and mitochondria in rabbit cardiac myocytes. J Physiol. 1993;460:603–621. doi: 10.1113/jphysiol.1993.sp019489. [DOI] [PMC free article] [PubMed] [Google Scholar]
- 37.Hobai IA, O’Rourke B. Enhanced Ca(2+)-activated Na(+)-Ca(2+) exchange activity in canine pacing-induced heart failure. Circ Res. 2000;87:690–698. doi: 10.1161/01.res.87.8.690. [DOI] [PubMed] [Google Scholar]
- 38.Cohen CJ, Fozzard HA, Sheu SS. Increase in intracellular sodium ion activity during stimulation in mammalian cardiac muscle. Circ Res. 1982;50:651–662. doi: 10.1161/01.res.50.5.651. [DOI] [PubMed] [Google Scholar]
- 39.Armoundas AA, Hobai IA, Tomaselli GF, Winslow RL, O’Rourke B. Role of sodium-calcium exchanger in modulating the action potential of ventricular myocytes from normal and failing hearts. Circ Res. 2003;93:46–53. doi: 10.1161/01.RES.0000080932.98903.D8. [DOI] [PMC free article] [PubMed] [Google Scholar]
- 40.Weber CR, Piacentino V, 3rd, Houser SR, Bers DM. Dynamic regulation of sodium/calcium exchange function in human heart failure. Circulation. 2003;108:2224–2229. doi: 10.1161/01.CIR.0000095274.72486.94. [DOI] [PubMed] [Google Scholar]
- 41.Mubagwa K, Lin W, Sipido K, Bosteels S, Flameng W. Monensin-induced reversal of positive force-frequency relationship in cardiac muscle: role of intracellular sodium in rest-dependent potentiation of contraction. J Mol Cell Cardiol. 1997;29:977–989. doi: 10.1006/jmcc.1996.0342. [DOI] [PubMed] [Google Scholar]
- 42.Bers DM, Barry WH, Despa S. Intracellular Na+ regulation in cardiac myocytes. Cardiovasc Res. 2003;57:897–912. doi: 10.1016/s0008-6363(02)00656-9. [DOI] [PubMed] [Google Scholar]
- 43.Paucek P, Jaburek M. Kinetics and ion specificity of Na(+)/Ca(2+) exchange mediated by the reconstituted beef heart mitochondrial Na(+)/Ca(2+) antiporter. Biochim Biophys Acta. 2004;1659:83–91. doi: 10.1016/j.bbabio.2004.03.019. [DOI] [PubMed] [Google Scholar]
- 44.Cox DA, Matlib MA. A role for the mitochondrial Na(+)-Ca2+ exchanger in the regulation of oxidative phosphorylation in isolated heart mitochondria. J Biol Chem. 1993;268:938–947. [PubMed] [Google Scholar]
- 45.Brookes PS, Yoon Y, Robotham JL, Anders MW, Sheu SS. Calcium, ATP, and ROS: a mitochondrial love-hate triangle. Am J Physiol Cell Physiol. 2004;287:C817–C833. doi: 10.1152/ajpcell.00139.2004. [DOI] [PubMed] [Google Scholar]
- 46.Griffiths EJ. Species dependence of mitochondrial calcium transients during excitation-contraction coupling in isolated cardiomyocytes. Biochem Biophys Res Commun. 1999;263:554–559. doi: 10.1006/bbrc.1999.1311. [DOI] [PubMed] [Google Scholar]
- 47.Ingwall JS, Weiss RG. Is the failing heart energy starved? On using chemical energy to support cardiac function. Circ Res. 2004;95:135–145. doi: 10.1161/01.RES.0000137170.41939.d9. [DOI] [PubMed] [Google Scholar]
Associated Data
This section collects any data citations, data availability statements, or supplementary materials included in this article.


