Abstract
We present a statistical-mechanical model for the positioning of nucleosomes along genomic DNA molecules as a function of the strength of the binding potential and the chemical potential of the nucleosomes. We show that a significant section of the DNA is composed of two-level nucleosome switching regions where the nucleosome distribution undergoes a localized, first-order transition. The location of the nucleosome switches shows a strong correlation with the location of gene-regulation regions.
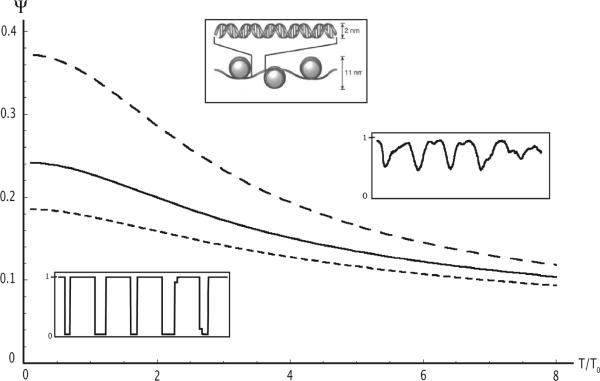
Genetic information in higher organisms is encoded in centimeters-long DNA molecules, which are compacted into chromosomes in the cell nucleus through a hierarchical series of folding steps. In the first level of compaction, short stretches of (negatively charged) DNA (147bp, 50 nm) are wrapped locally in ~2 turns around (positively charged) 3.5 nm radius protein spools, forming nucleosomes (see Fig.1, top inset) Nucleosomes are separated along the DNA by short stretches of unwrapped “linker” DNA, typically about 10-50bp in length. Thus, about 75-90% of each chromosomal DNA molecule is wrapped in nucleosomes. DNA that is wrapped in nucleosomes is less-easily accessible to many gene regulatory proteins, therefore the detailed locations of nucleosomes along the DNA have important biological consequences.
Figure 1.
Temperature dependence of the overlap parameter Ψ with temperature in units of the reference temperature. Short dash: μ = 62 with zero temperature occupancy of 89.6%. Solid line: μ = 24 with zero temperature occupancy of 83.3%. Long dash: μ = 0 with zero temperature occupancy of 51.5%. Insets: Plot of site occupancy probability between sites 9,000 and 10,000 at μ = 24 for T/T0 = 0.1 (bottom left) and T/T0 = 8.0 (top right).
In an early model, Kornberg and Stryeri (KS) treated the nucleosomes as a uniform one-dimensional(1D)liquid of hard rods with an excluded volume of the order of 147 bp's. They attributed regularities in nucleosome positioning observed in vivo to the decaying density oscillations near a boundary that are characteristic for the 1D liquid of hard rods at higher densitiesii. The “boundaries” would be provided here, for example, by the site-specific binding of Transcription Factors (TF's), that, when bound to DNA, prevent that stretch of DNA from being wrapped in a nucleosome. Recently, Segal et al.iii showed that nucleosomes in fact prefer certain DNA sequences over others, and that genomes utilize these sequence preferences to bias the preferred locations of nucleosomes. This sequence specificity of DNA/nucleosome binding is due to the sequence-dependent bending stiffness of DNA itself. Certain dinucleotides (one base pair followed by another) greatly enhance the ability of DNA to sharply bend in particular directions relative to the DNA helix axis, as required by the nucleosome. This sharp bending occurs every DNA helical repeat (~10 basepairs), when the major groove of the DNA faces inwards towards the center of curvature, and again, about 5 basepairs out of phase, and with opposite direction, when the major groove faces outward. Bends of each direction are facilitated by specific dinucleotides. Segal et al.iii used an alignment of natural nucleosome DNA sequences to create a statistical profile (a position-dependent Markov model) that represented the nucleosome's dinucleotide sequence preferences at each of the basepair steps within the nucleosome. The resulting Markov model assigns a log-likelihood for an isolated nucleosome starting at a given basepair in the genome, which amounts to an effective on-site potential for nucleosomes. They then used a dynamic programming algorithm to exactly solve the equilibrium distribution of hard rods on this potential landscape and the resulting equilibrium density profile of this 1D statistical mechanics model correctly predicted about half of the actual stable nucleosome positions of the yeast genome.
In many organisms, cells of different types or developmental states - all of which have the same genomic DNA sequences - organize their DNA into arrays of nucleosomes at quite different nucleosome densities (concentrations). For example, rat neuronal cells have an average nucleosome spacing of ~165 bp (~18 bp average linker DNA length) at birth, while 30 days later the same cells have increased the spacing to ~218 bp (~71 bp average linker DNA) iv. The chromatin repeat-length of brain cortex and cerebellar neurons changes concomitant with terminal differentiation. If slight changes in average density or nucleosome binding strength, would alter the nucleosome density profile in a drastic and chaotic manner, then the predicted nucleosome positions would not be “robust” and any functionality for nucleosome positioning would be in serious doubt. The aim of the present paper is to examine the thermodynamic stability of nucleosome positioning using the model of Segal et al.iii.
We work in the grand-canonical ensemble with the N-nucleosome Hamiltonian:
| (1.1) |
Here, ni is the location of the first base pair blocked by the i'th nucleosome. The nucleosome-nucleosome interaction potential U(m) is equal to zero if m exceeds the hard-core size a =157 v and infinite if m is less than or equal to a. Next, Vn ≡ -kBT0 log Pn is the nucleosome on-site potential energy with T0 the reference temperature vi - the characteristic energy scale of the on-site potential - and Pn the likelihood for nucleosome binding at site n as obtained from the Markov model analysis for the DNA sequence of yeast chromosme II vii. The probability ρn for site n to be the first site of a stretch of a sites occupied by a nucleosome is obtained from a discrete version of an exact recursion relation derived by Percus describing the statistical mechanics of a liquid of hard rods in an external potential viii. This recursion relation,
| (1.2) |
with , is expressed in terms of the set of quantities hn that we obtain
by numerical iteration of Eq.(1.2) from large to small n. The site probability ρn then follows from the relation while the thermodynamic properties follow from the grand partition function . Note that Eq. (1.2) reduces to the classical Langmuir Isotherm in the absence of the excluded volume interactions.
The level of correlation between the nucleosome site probabilities and the position dependence of the site potential Vn is characterized by the overlap parameter ψ:
| (1.3) |
Here, 〈V〉 is the mean on-site probability, L is the system size, and Vmin is the site potential with the largest (i.e. most attractive) binding energy of the sequence. If all nucleosomes are located at optimal binding sites, where Vn equals Vmin, then ψ equals one while ψ is zero if there are no correlations between site probability and site potential, which occurs as T / T0 → ∞. Figure 1 shows the dependence of the overlap parameter on the ratio T/T0 of the ambient and reference temperatures for different values of the chemical potential that correspond to densities in the biologically relevant range of 50% to 90% occupancy. In all cases, the overlap parameter decreases towards zero for T/T0 large compared to one. In this regime, the site occupation probability shows -approximately - sinusoidal density modulations with period equal to the hard rod length (right inset) that are related to the KS density oscillations i. The overlap parameter grows as T/T0 decreases and then saturates for T/T0 small compared to one. Note, from Fig.2, that the value of ψ for small T/T0 increases with decreasing density. Indeed, in the close-packing limit (i.e., 100% occupancy) the site occupancy probability must be constant, which - according to Eq.2 - means that the overlap parameter is zero. Nevertheless, ψ remains surprisingly large even at 90% occupancy. A typical occupancy plot in this regime, shown in the left inset of Fig.2, clearly indicates the preferred locations for the nucleosomes. It is only in this low-temperature regime that precise nucleosome locations can be predicted. The change between the two regimes, for T/T0 near one, can be viewed as a freezing transition, but Fig.1 does not provide evidence for a true thermodynamic phase transitionix.
Figure 2.
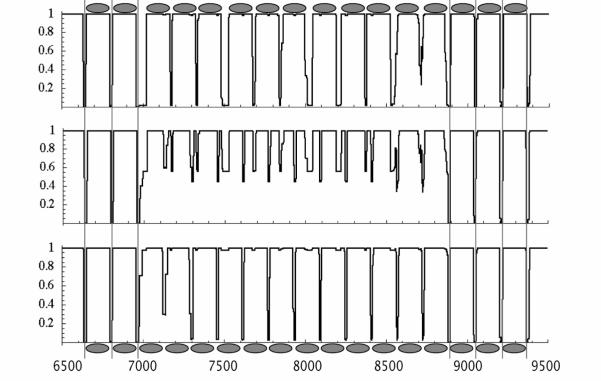
Site occupancy of an unstable section (bp 6,500-9,500) at T/T0 = 0.5 for different values of the chemical potential. The mean occupancies are 88.8, 89.3, and 90%. For higher, respectively, lower chemical potentials, the occupation pattern is stable with, respectively, 12 and 11 nucleosomes. The unstable sequence for intermediate chemical potential is the superposition of the two stable patterns.
Surprisingly, the occupancy profile for T/T0 = 0.5 contains both stable and unstable sequences. Most sequences exhibit well-defined density profiles of the form shown in Fig.1 that allow an unambiguous assignment of nucleosome positions and that are stable with respect to small changes in μ. These stable sequences are interspersed by shorter sequences having lengths of the order of 1,000 bp and poorly defined density profiles. The fraction of unstable sequences is about 15% at μ = 24 for T/T0 = 0.5 while it decreases to zero in the limit of small T/T0. The middle panel of Fig. 2 shows a typical example of such an unstable sequence with a length of 3,000 bp. If one slightly increases the chemical potential (from 89.3% to 90% mean occupancy) then the occupancy profile of this section evolves into a well-defined nucleosome configuration (with N = 12 nucleosomes, Fig.2, top panel). Similarly, after a very slight decrease in mean occupancy, to 88.8%, the section again transforms to a well-defined configuration (with N = 11 nucleosomes, Fig.2, bottom panel).
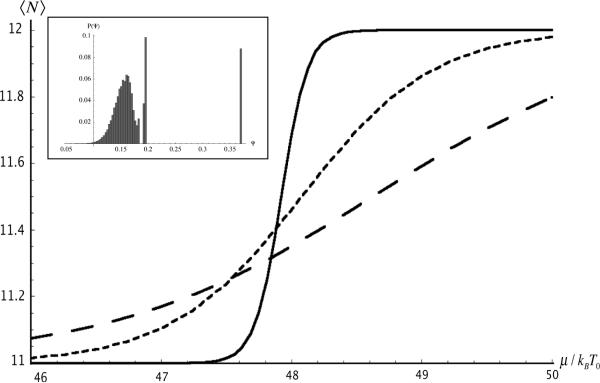
The physical meaning of the `disordered' occupancy profile of the middle panel Fig.2 becomes clear if one notes that it simply is the superposition of the stable N = 11 and N = 12 configurations. This suggests that the transition from the N = 11 to the N = 12 configuration as a function of the chemical potential can be viewed as a “micro” first-order phase transition with the free energies of the N = 11 and N=12 states degenerate at the transition point. The middle panel would represent a form of finite-size phase coexistence. Indeed, plots of the mean number of nucleosomes <N> of the section - which can be viewed as an order parameter - as a function of the chemical potential μ for different values of T/T0 (see Fig.3) are closely similar to M-H magnetization isotherms of a 1D Ising model with transition temperature T0. For T/T0 small compared to one, a well-defined, rapid switch takes place between the N = 11 and N = 12 states as a function of μ. We also performed Monte Carlo simulationsx to determine the distribution of ψ at μ / kBT0 ≈ 47.9, where the N=11 and N=12 states are degenerate at low temperatures (see Fig. 3(inset)). Indeed, we find a broad distribution at high temperatures and a sharply peaked, bimodal distribution at low temperatures, the hallmark of a first order transition. The appearance of micro first-order transitions is not an accidental specific of the DNA of yeast chromosome II. Indeed, if we replace Vn with a Gaussian random site potential having the same RMS width as the Vn then the fraction of unstable sequences remains comparable to that of yeast chromosome II. The transitions are in fact a generic consequence of the unavoidable competition at higher occupancy levels between arrangements with different density but the same free energy.
Figure 3.
Average number of nucleosomes between sites 6970 and 8730 of yeast chromosome II as a function of chemical potential. Solid line: T / T0 = .1 Short dash: T / T0 = .5. Long dash: T / T0 = 1. Inset: Histogram of the overlap (order) parameter Ψ in the same stretch of DNA from Monte Carlo simulations at μ ≈ 47.9 where the 11 and 12 nucleosome configurations are energetically degenerate. For high temperature, the overlap parameter has a broad distribution at a smaller (albeit non-zero) value. For low temperature, it is bimodal and sharply peaked at 0.197 (N=12) and 0.373 (N=11). Here we have shown an intermediate temperature T / T0 = 2, which exhibits both behaviors. Note that the Gaussian (disordered) part of the distribution is not peaked around zero because the average overlap parameter decays slowly to zero as T → ∞ (see Figure 1).
For lower values of T/T0, the nucleosome conformation in the switching regions is thus exquisitely sensitive to small changes in the chemical potential and the characteristic energy scale kBT0 of the DNA-nucleosome interaction. Cells of different types or different developmental states with different nucleosome densities are known to be characterized by chemical modification of the nucleosomes (methylation or acetylation) that would alter this characteristic energy scale. The model thus predicts that changes in nucleosome density in response to chemical modification will be localized to the switching regions. A corollary of this prediction is the possibility that the location of the switching regions on the chromosome correlates with the location of gene-regulatory sequences, specifically the binding sites of Transcription Factors. To test this hypothesis, we collected 278 published TF binding locations on chromosome two from the SGD database. We equilibrated the system at ~75% and ~90% average occupancies and calculated the absolute value of the difference in the probability of site occupancy. The mean (absolute) change was found to be 22.7%. When we calculated the mean absolute change in occupancy on the restricted set of the 278 TF binding locations, we found it to be 32.9%. To check for the statistical significance of this result, we randomly chose 250 different sets of 10 base pairs regions and calculated the average absolute change in site occupancy on changing the density. We repeated this procedure and generated a distribution of average absolute changes and found a standard deviation of 2% from the mean. This means that the statistical probability of randomly achieving a mean value of 32.9% is less than 10-7. It follows that at least some TF binding sites are strategically placed on segments of DNA that on average are more likely to reconfigure to changes in nucleosome concentration or affinity.
In summary, we have shown that a simple 1D model for nucleosome positioning, that correctly predicts 50% of the nucleosome locations along yeast chromosome II, is characterized by a sequence of highly localized, first-order rearrangement transitions that occur as a function of the characteristic interaction energy between the DNA and nucleosomes. The transitions are a generic consequence of frustration between the requirements of the excluded-volume interactions and the on-site potential energy. The location of the first-order rearrangement transitions correlates with the location of TF binding sites, indicating that the frustration is exploited by nature as gene-regulatory switches that distinguish cells in different states of development.
Acknowledgements
This work was supported by the NSF under DMR Grant 04-04507.
References
- i.Kornberg R, Stryer L. Nucleic Acid Res. 1988;16:6677. doi: 10.1093/nar/16.14.6677. [DOI] [PMC free article] [PubMed] [Google Scholar]
- ii.Tonks L. Phys. Rev. 1936;50:955. [Google Scholar]; Percus JK. J. Stat. Phys. 1976;15:505. [Google Scholar]
- iii.Segal, et al. Nature. 2006;442:772. doi: 10.1038/nature04979. [DOI] [PMC free article] [PubMed] [Google Scholar]
- iv.Jaeger AW, Kuenzle CC. Embo J. 1982;1:811. doi: 10.1002/j.1460-2075.1982.tb01252.x. [DOI] [PMC free article] [PubMed] [Google Scholar]
- v.We are assuming that two nucleosomes at minimum spacing still are separated by a ten base pair sequence that is not in direct contact with either nucleosome
- vi.The reference temperature depends on the choice of DNA sequence. Under in-vitro conditions it could be tuned by the ambient salt concentration.
- vii.The probability distribution of the onsite potentials is approximately Gaussian with a width ΔV / kBT0: 9.3 and correlation length of about 150 bp
- viii.Percus JK. J. Stat. Phys. 1976;15:505. [Google Scholar]
- ix.Even though this is a 1D system, it can exhibit a true thermodynamic freezing transition for the case of a sinusoidal site potential with random phase, see Zhang MQ. J. Phys. A: Math. Gen. 1991;24:3949.
- x.We performed the simulation under a restricted set of 100,000 configurations for the sake of efficiency


