Abstract
Two anthropomorphic uterine phantoms were developed which allow assessment and comparison of strain imaging systems adapted for use with saline-infused sonohysterography (SIS). Tissue-mimicking (TM) materials consist of dispersions of safflower oil in gelatin. TM fibroids are stiffer than the TM myometrium/cervix and TM polyps are softer. The first uterine phantom has 3-mm diameter TM fibroids randomly distributed in TM myometrium. The second uterine phantom has a 5-mm and an 8-mm spherical TM fibroid in addition to a 5-mm spherical and a 12.5-mm long (medicine-capsule-shaped) TM endometrial polyp protruding into the endometrial cavity; also, a 10-mm spherical TM fibroid projects from the serosal surface. Strain images using the first phantom show the stiffer 3-mm TM fibroids in the myometrium. Results from the second uterine phantom show that, as expected, parts of inclusions projecting into the uterine cavity will appear very stiff, whether they are stiff or soft. Results from both phantoms show that even though there is a five-fold difference in the Young’s moduli values, there is not a significant difference in the strain in the transition from the TM myometrium to the TM fat. These phantoms allow for realistic comparison and evolution of SIS strain imaging techniques and can aid clinical personnel to develop skills for SIS strain imaging.
Keywords: uterus, phantom, elastography, strain imaging, leiomyoma, endometrial polyps
INTRODUCTION
Dysfunctional uterine bleeding is the cause of many gynecological visits and can be due to the presence of either benign conditions, e.g., leiomyoma (uterine fibroids), endometrial polyps, endometrial hyperplasia, and adenomyosis, or the presence of endometrial cancer (Ascher & Reinhold 2002). Being able to distinguish between the different conditions allows the physician to determine the appropriate treatment method. Dilation and curettage (D&C) is the currently accepted method for diagnosing diffused endometrial conditions such as endometrial cancer and endometrial hyperplasia (Hatasaka 2005). However, when focal endometrial conditions (such as endometrial polyps and leiomyomas) or myometrial conditions (such as adenomyosis) are present, D&C is not capable of diagnosing them.
Transvaginal ultrasound (TVUS) is a method routinely used for differentiating between the causes dysfunctional uterine bleeding such as adenomyosis, endometrial polyps and leiomyomas. However, in TVUS images it is difficult to distinguish between a thickened endometrial lining and other diffuse or focal endometrial abnormalities (Davis et al. 2002). An improved TVUS method is saline infused sonohysterography (SIS) which allows uterine abnormalities to be seen more clearly by pushing apart the walls of the uterine cavity with saline infused into the cavity (Parsons 2001).
Even on SIS images, some of the conditions that cause dysfunctional uterine bleeding can have similar ultrasound (US) appearances, leading to more invasive hysteroscopy or more expensive MRI for diagnosis. Ultrasound strain imaging with SIS might provide the extra diagnostic information needed to distinguish between these conditions using ultrasound data obtained during SIS. The saline infusion can provide the deformation necessary for ultrasound strain imaging. The term strain refers to local 1-D strains, i.e., the fractional changes in distance between two points in response to an applied quasistatic stress.
An anthropomorphic uterine phantom that mimics the SIS method could aid in research in the development of SIS strain imaging methods by comparing the performance of systems with different hardware and/or software. Eventually, studies with these phantoms could aid in deciding whether clinical trials for a given system are warranted. In this paper, we describe the production and use of two anthropomorphic uterine phantoms made with tissue mimicking (TM) materials consisting of dispersions of oil-in-gelatin. The first uterine phantom consists of TM fibroids randomly distributed in the TM myometrium and cervix while the second phantom has TM fibroids and endometrial polyps protruding into the uterine cavity as well as a TM fibroid on the outer surface of the TM myometrium.
Realistic phantoms often demonstrate phenomena that are not obvious. For example, in SIS strain imaging, any object that projects from the uterine wall into the liquid-filled uterine cavity will appear stiffer than it actually is, and the further the object projects, the stiffer it appears on strain images. The reason is that the (uniaxial) strain amount depends on how easily the shape of the object can be distorted and – for soft tissues – does not depend on the compressibility of the tissue, per se. Consider a homogeneous sphere of soft tissue in the liquid-filled uterine cavity (not attached to the uterine wall). As the pressure increases by 3 kPa, and assuming that the compressibility, β, of soft tissue is approximately that of water, viz, (Kaye & Laby 1973), the fractional change in volume is If the sphere is 1 cm in diameter, the corresponding change in diameter is 0.5×10⁻⁶. cm ≈ 5 nm, which is much less than current strain imaging methods can detect. (Note that in the phantoms described in this work, the measured maximum increase in pressure was 1.2 kPa corresponding to a uterine cavity volume increase of 5 mL). For a piece of soft tissue of any initial shape suspended in a liquid, that shape will not change in response to the increase in uniform pressure around it (consider, e.g., a scuba diver descending in the ocean).
If the piece of soft tissue is bound to the uterine wall, it will experience distortion as the uterine wall area expands in response to an increase in pressure. However, the further the part of the soft tissue is from the uterine wall, the less the distortion.
PHANTOM DESIGN AND MATERIALS
To design and construct these phantoms, techniques of Madsen et al. (2006a), regarding production of anthropomorphic breast phantoms, were employed. Mechanical properties of myometrial, cervical, and fibroid tissues reported by Kiss et al.(2006) were also helpful for choosing compositions of TM materials forming the phantoms.
The uterine phantoms were designed to simulate the uterus of a pre-menopausal woman with no children. From pathological findings, the typical uterus of this type is 7–8 cm long, 5 cm wide, 2.5 cm in diameter and shaped like an inverted pear with a 6 cm long triangular shaped uterine cavity and a cervical length of 1–2 cm (Sloane 1994).
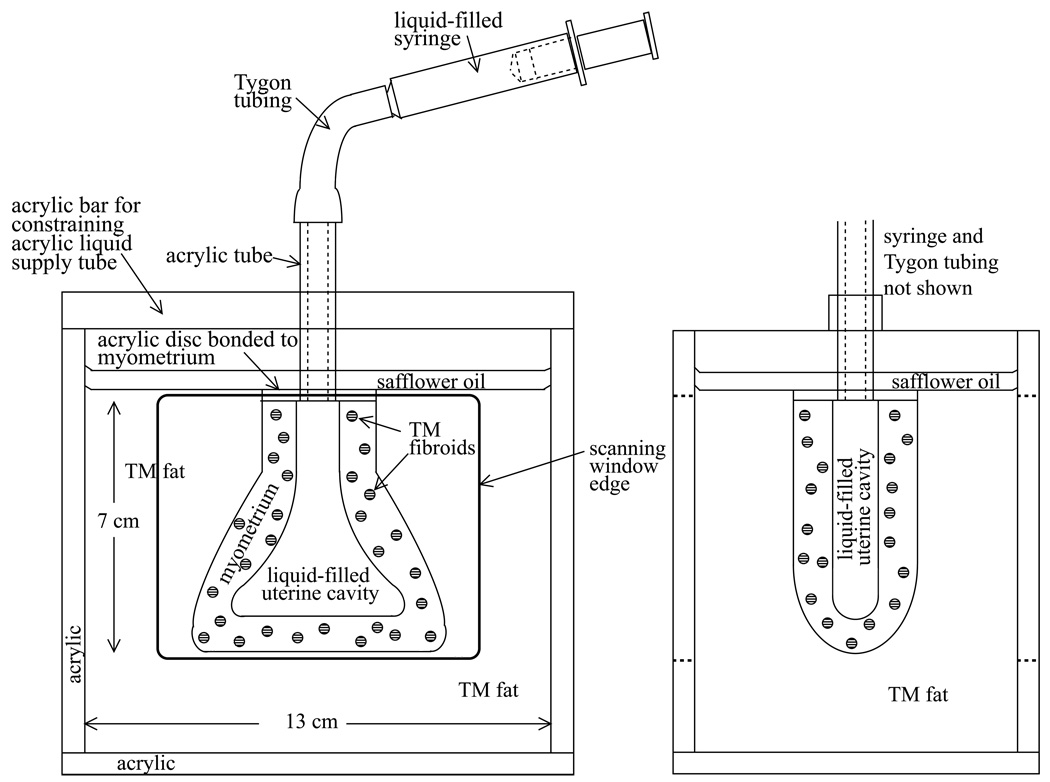
Anterior-posterior and saggital views of each phantom are given in Figure 1 and Figure 2. The first uterine phantom (Figures 1a and 1b) has 3-mm diameter spherical inclusions, representing uterine fibroids, randomly distributed in the TM myometrium and cervix, and the simulated uterus is surrounded by TM fat. The second uterine phantom (Figures 2a and 2b) has two spherical TM fibroids, 5-mm and 8-mm in diameter, and two TM endometrial polyps – one 12.5-mm long (medicine-capsule-shaped) object and one 5-mm diameter sphere – protruding into the uterine cavity. A 10-mm diameter spherical TM fibroid is on the outer surface of the myometrium, and the simulated uterus is again surrounded by TM fat.
Figure 1.
Anterior-posterior view (left) and saggital view (right) of the first uterine phantom
Figure 2.
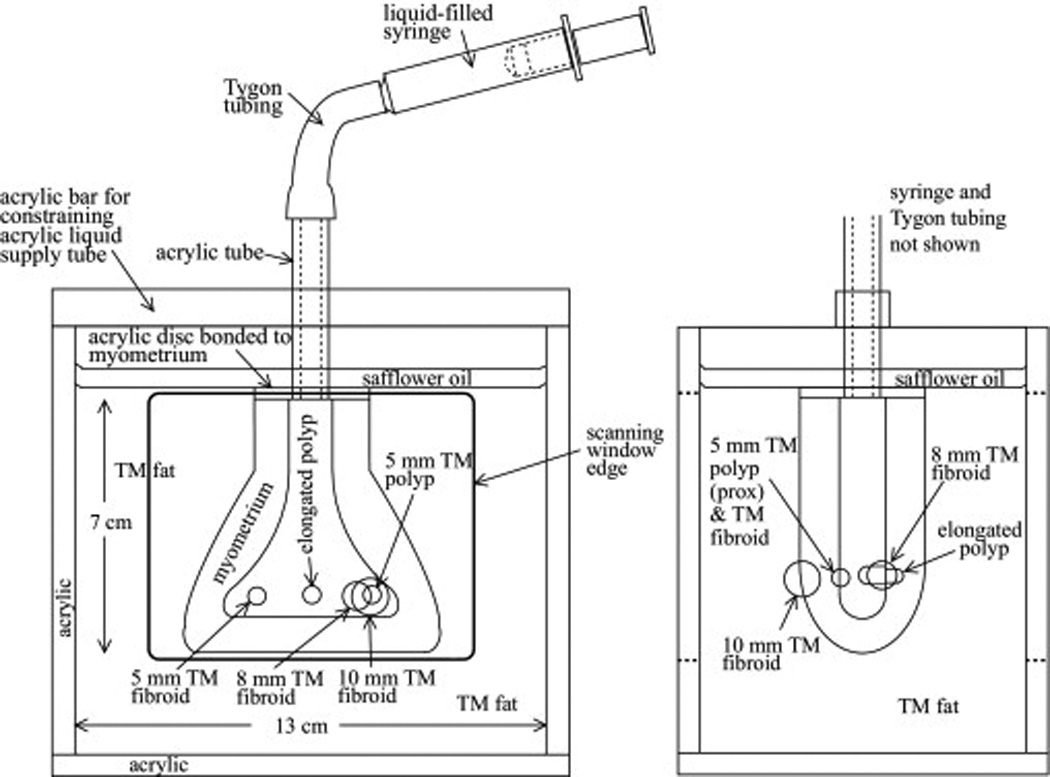
Anterior-posterior view (left) and saggital view (right) of the second uterine phantom
From Kiss et al.(2006), the mean Young’s modulus over quasistatic frequency ranges for excised tissue samples from the myometrium and cervix is 40 kPa while that for uterine fibroids is 100 kPa. The values for the surrounding fat were chosen from Krouskop et al. (1998) where the value of fat was from 18 ± 7 kPa. From Madsen et al. (2006a), the mean Young’s moduli of 10%, 30%, 50% and 70% (volume percents of safflower oil dispersed in gelatin) are 98, 65, 40, and 21 kPa, respectively. From these values, we could estimate the appropriate percents oil in the TM materials for the myometrium/cervix and uterine fibroids. The mechanical properties of endometrial polyps were not found in the literature; from strain imaging of excised uteri with endometrial polyps (Hobson et al. 2007), we inferred that they are softer than the myometrium, and we chose the percent oil accordingly. (The higher the percent oil, the softer the TM material.) Table 1 gives the volume percent safflower oil (Hollywood Brand, The Hain Celestial Group, Inc., Mellville, NY, USA) in oil-in-gelatin materials used in each phantom for each component. Table 2 gives the weight percent of each component of the gelatin matrix which used 200 bloom calf skin gelatin (Vyse Gelatin Co., Schiller Park, IL, USA).
Table 1.
Volume percent oil in oil-in-gelatin TM materials in the uterine phantoms
| Tissue type | Percent oil-in-gelatin dispersion material used | |
|---|---|---|
| Uterine phantom #1 | Uterine phantom #2 | |
| Myometrium and Cervix | 50% | 40% |
| Fat | 70% | 80% |
| Fibroid | 10% | 10% |
| Endometrial polyp | n/a | 70% |
Table 2.
Weight percent of all components of the phantom materials. Note that the formalin solution contains 37% pure formaldehyde.
| Deionized Water | Dry 200 Bloom strength gelatin | Propylene glycol | Pure formaldehyde |
|---|---|---|---|
| 77.87% | 13.21% | 8.65% | 0.268% |
PHANTOM PRODUCTION METHODS
The components of each phantom were produced using methods previously described (Madsen et al. 2005a; 2006a; 2006b). Note that the composition of the gelatin forming matrices – given in Table 2 – in which oil droplets are dispersed is the same for all oil-in-gelatin dispersions in the phantom. TM fibroids and endometrial polyps were made by immersing acrylic two-part molds into the warm molten TM material, closing the molds, and allowing the material to congeal. In the case of the first uterine phantom, many identical 3-mm diameter spheres were produced in one event, each mold part containing many hemispherical depressions (Madsen et al. 2005a); alignment pegs and holes assured production of nearly perfect spheres. A thin layer (likely less than 0.05 mm thick) of petrolatum on the relevant mold surfaces assured that the congealed spheres did not adhere to the molds during their removal. After 12 hours the TM fibroids and endometrial polyps congealed and formaldehyde cross-linking was sufficiently advanced that the melting temperature of the TM material is high enough for subsequent production steps to be undertaken.
The next step was the production of the TM myometrium/cervix with inclusions. The procedure for the first uterine phantom was somewhat different from that for the second uterine phantom because inclusions (TM fibroids or endometrial polyps) were positioned in different ways. The production method for the TM myometrium/cervix in the case of the first uterine phantom is described in the following four steps:
-
A low melting temperature (37°C) polyester wax (Catalog #19312, Electron Microscope Sciences, Hatfield, PA) mold with the shape of the uterine cavity was made as follows. A sufficiently large piece of machinable plastic (Delrin®) was cut and sanded in the shape and size of the uterine cavity and mounted horizontally in an acrylic box with a height of 4 cm and horizontal dimensions 6 cm and 7 cm. After coating the inner surface of the box and the Delrin® plastic uterine cavity mold (PUCM) with silicone release agent (Dow Corning compound, Dow Corning Corporation, Midland, MI), a layer of two-part silicone RTV (Product number R2374 A and B, Silpak, Inc., Pomona, CA) was poured into the box half submerging the PUCM. After the silicone had hardened, its upper surface was coated with more of the silicone release agent, and a second layer of silicone was poured into the box submerging the rest of the PUCM.
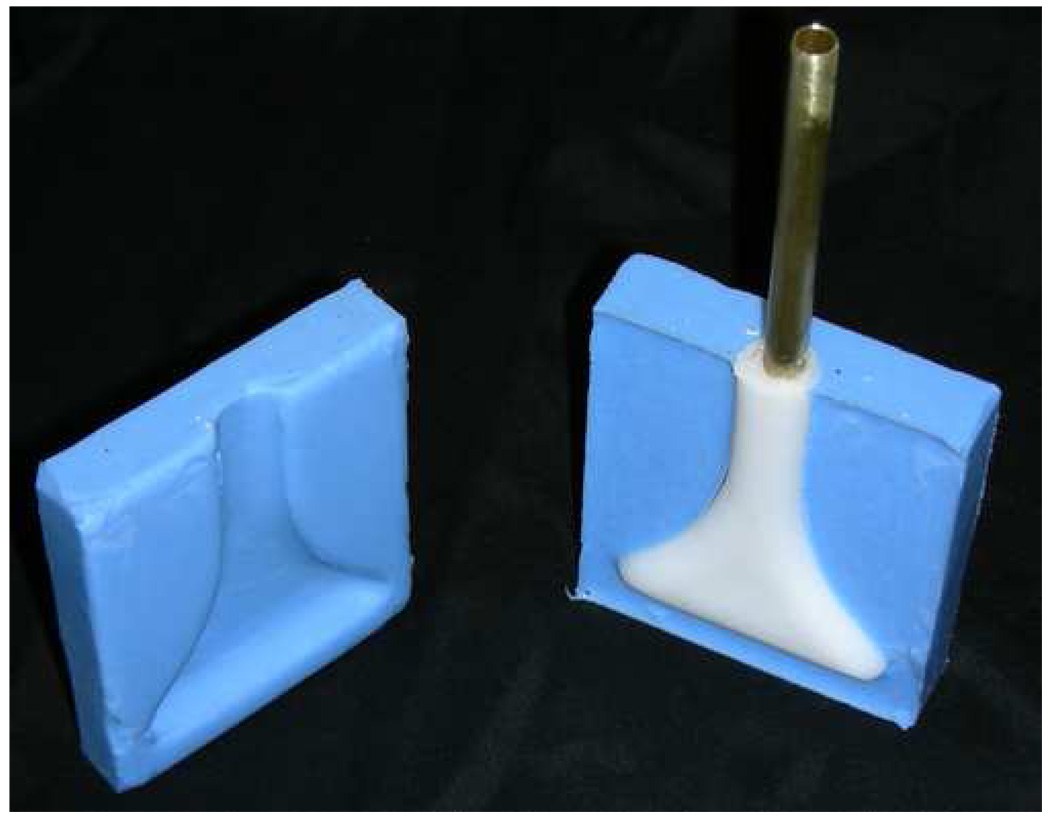
Following the hardening of the second layer of silicone, the two pieces of silicone were removed from the box, the PUCM removed, and the two silicone sections clamped together between two flat aluminum plates so that the uterine cavity is empty. Next, a brass tube – with its end pinched shut – was clamped in position in the uterine cavity formed by the two silicone halves. Then melted polyester wax was poured into the cavity and allowed to congeal around the brass tube forming a polyester wax mold (PEWM). The brass tube and (white) polyester wax are shown along with the two silicone mold halves in Fig. 3.
-
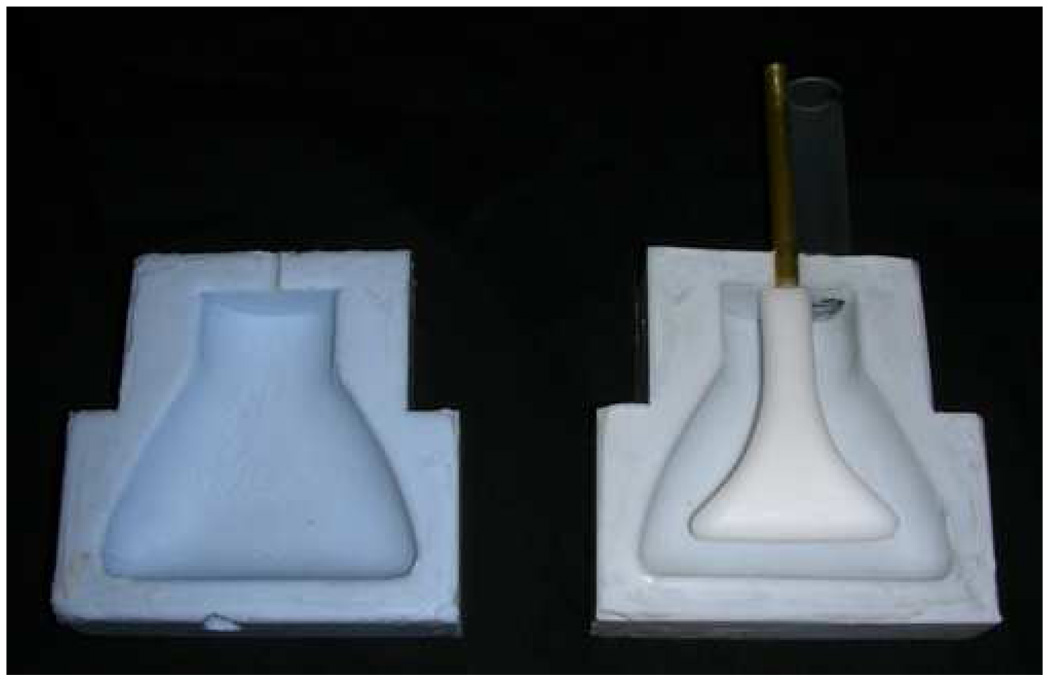
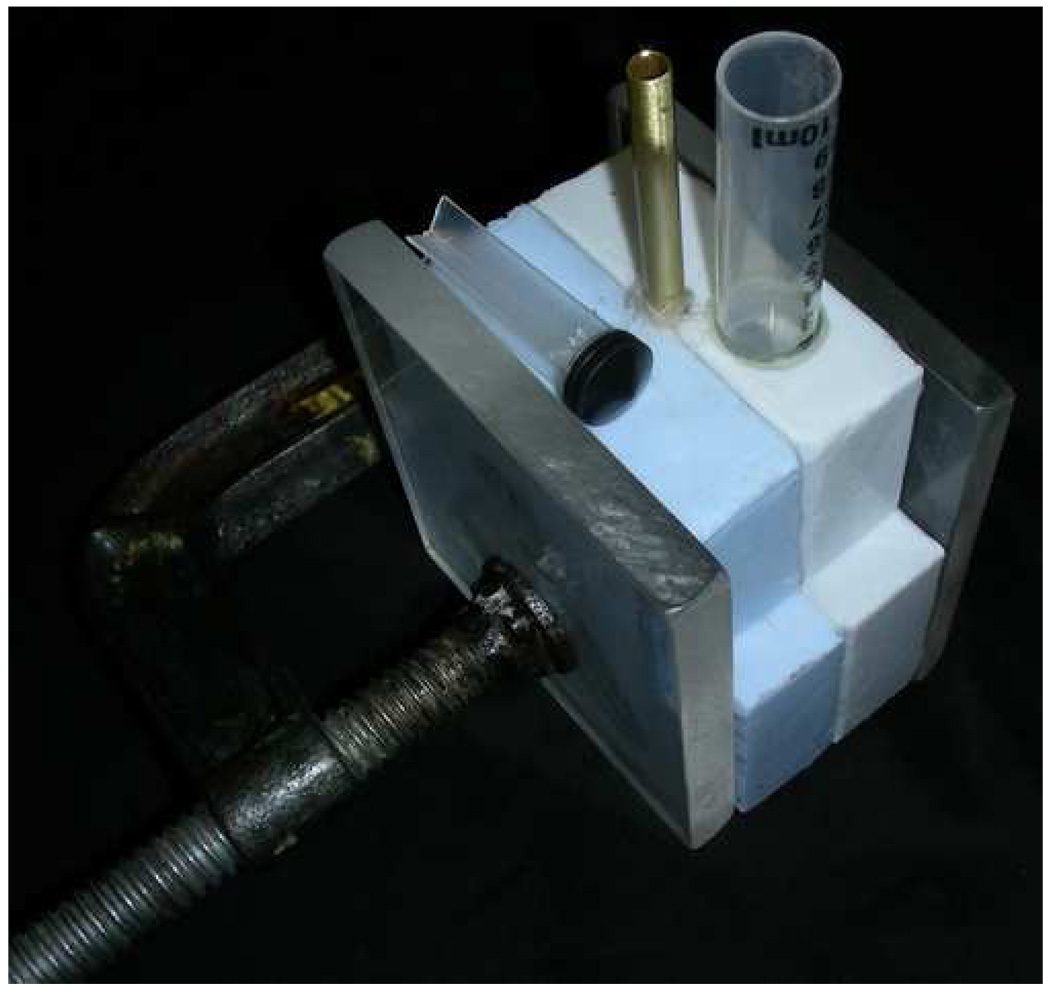
A two-part silicone mold defining a cavity in the shape of the external surface of the myometrium/cervix was then formed in the same fashion as the two-part silicone mold defining the uterine cavity (see Fig. 4). Two opposing semicylindrical depressions at the end of the two part mold allow the brass tube to be clamped so that the PEWM was positioned correctly in the myometrium/cervix cavity. In Fig. 4, a truncated (almost transparent) syringe barrel is seen to the right of the brass tube and parallel to it. The syringe barrel was epoxied into a hole in the silicone myometrium/cervix mold and allowed filling of the myometrium/cervix with molten TM material, surrounding the PEWM. A photo of the apparatus, just prior to filling with the TM myometrium/cervix material is shown in Fig. 5. The syringe barrel is clearly seen along with the syringe piston which was to be placed in the syringe barrel after pouring in the molten TM material.
In the case of the first phantom, about fifty 3-mm diameter spherical simulated TM fibroids (about 1 TM fibroid per every 1.5 mL of TM myometrium/cervix material) were added to the molten TM myometrium/cervix material prior to filling the myometrium/cervix cavity in the mold shown in Fig. 5. The temperature of the molten TM myometrium/cervix material was lowered to about 34°C before filling the cavity so that the PEWM would not melt during congealing. The syringe was inserted with a 0.5-mm diameter wire between it and the syringe barrel allowing all air to be removed during the insertion. A rubber band was applied to maintain a small positive gauge pressure on the molten TM material during congealing. Immediately after applying the rubber band, the apparatus (Fig. 5) was rotated back and forth to distribute the TM fibroids randomly in the molten TM material. To thwart gravitational sedimentation of the TM fibroids, the apparatus shown in Fig. 5 was attached to a plate and rotated about a horizontal axis at 2 RPM until congealing was complete.
After congealing had occurred and formaldehyde cross-linking of the gelatin was sufficiently complete (12 hours or more), the polyester wax was removed from the TM myometrium/cervix cavity, forming the uterine cavity. A Haake type G/D8 temperature controlling unit (Thermo Electron Corporation (Thermo Fisher Scientific), Newington, NH), filled with safflower oil maintained at 40°C, was then used to melt the polyester wax out of the uterine cavity as follows. The solidified TM myometrium/cervix was removed from the silicone mold and immersed in the oil bath. The Haake bath also provided for a stream of 40°C oil to be passed into the brass tube implanted in the PEWM allowing melting of it from the inside. About 15 minutes was required to completely melt away the PEWM.
Figure 3.
Photograph of the two-part silicone mold used to make polyester wax mold (PEWM) of the uterine cavity. The PEWM with embedded brass tube is also shown before removal.
Figure 4.
Photograph of two part silicone mold used to make the TM myometrium/cervix with the polystyrene wax mold of the uterine cavity positioned in one part.
Figure 5.
Photograph of two part silicone mold used to make the TM myometrium/cervix clamped together with the polystyrene wax mold of the uterine cavity in place.
The completed TM myometrium/cervix was then stored in room temperature safflower oil until the last two steps in finishing the phantom were undertaken. Before describing these steps, however, the next section describes the production of the TM myometrium/cervix of the second phantom.
The production of the TM myometrium/cervix – plus TM fibroids and endometrial polyps – differed somewhat from that in the case of the first phantom. In step 1) above, the PEWM was formed with slightly-larger-than hemispherical depressions in it with diameters and positions corresponding to the spherical TM fibroids and endometrial polyps. (See Figs. 2a and 2b) In the case of the medicine-capsule-shaped elongated polyp, the depression had the shape of one of the rounded ends. The first step in creating these depressions was to superglue (RP30, Adhesive Systems Inc., Frankfurt, IL) appropriately shaped cross-linked gelatin objects on the inner surfaces of the silicone mold sections used to form the PEWM. Then the procedure for forming the PEWM was carried out as described in step 1) above. The use of flexible gelatin projections provided for removal of the mold leaving depressions without damaging the solidified polyester wax. The spherical TM fibroids and medicine-capsule-shaped elongated endometrial polyp were then inserted into the depressions in the PEWM and the next step 2) completed. In step 2) for the second phantom, there were no TM fibroids randomly distributed in the myometrium/cervix as in the case of the first phantom. The molten TM myometrium/cervix material bonds strongly to the TM fibroids.
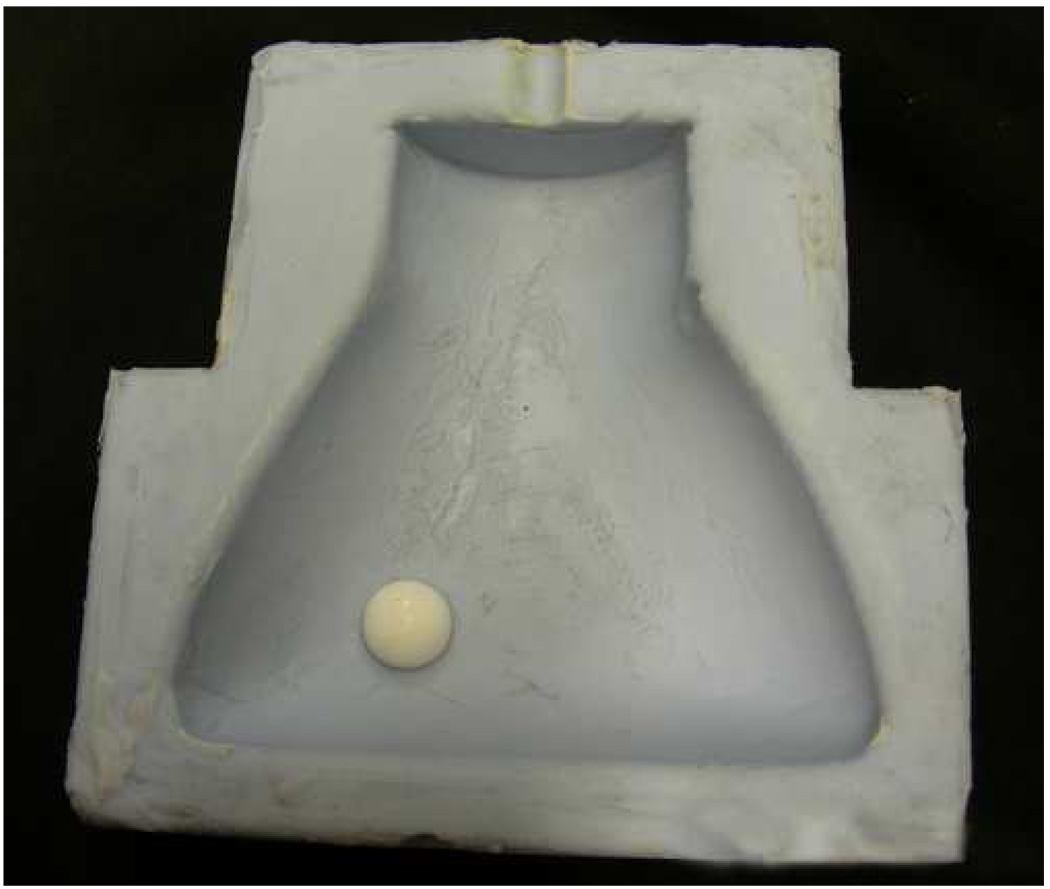
One other difference regarding the production of the TM myometrium/cervix for the second phantom was that a 10-mm diameter hemispherical depression was produced in the external surface of the TM myometrium/cervix due to the presence of an acrylic hemisphere glued to the inner surface of the silicone mold used to form the external surface of the TM myometrium/cervix. (See white hemisphere In the photograph in Fig. 6.) The 10-mm diameter spherical TM fibroid shown in Fig. 2b was “glued” into the hemispherical depression with molten TM myometrium/cervix immediately prior to introduction of the surrounding TM fat.
Figure 6.
Photograph of one side of the inner surface of the silicone mold used to form the external surface of the TM myometrium/cervix with a white 10-mm diameter acrylic hemisphere glued to it to provide a 10-mm diameter hemispherical depression on the external surface of the TM myometrium/cervix.
The completion for both the first or second phantom was accomplished as follows. First, the acrylic tube and attached acrylic disc, shown in Fig. 1a and Fig. 2a, were superglued to the annular-ring-shaped upper surface of the TM myometrium/cervix. Then the acrylic tube, acrylic disc, and TM myometrium/cervix were suspended in the acrylic box shown in Fig. 1 and Fig. 2, and molten TM fat was introduced and allowed to congeal around the TM myometrium/cervix. Suspension was accomplished via the acrylic bar shown in Fig. 1 and Fig. 2.
Next the uterine cavity, acrylic tube, Tygon® tube and syringe were filled with safflower oil. Depression of the syringe piston provides for expansion of the uterine cavity. Finally, a layer of safflower oil was poured over the top of the TM fat to prevent desiccation.
MEASUREMENT OF PHYSICAL PROPERTIES
At the time of phantom production, test cylinders were made for measuring ultrasonic propagation speed and attenuation as well as measuring the mechanical properties of each phantom component. Propagation speed and attenuation for each phantom component were measured at 22°C using the substitution technique (Madsen et al. 1999). Young’s moduli were measured at 1 Hz and at room temperature (~22°C) on cylindrical samples of each phantom component using the EnduraTEC model 3200 ElectroForce (ELF) system (Bose Corporation, ElectroForce Systems Group, Eden Prairie, Minnesota, USA). From the measured Young’s modulus, the elastic contrast of the TM materials was calculated using the following definition of elastic contrast:
| (1) |
ELF samples are defined as cylindrical testing samples made at the time of phantom production of each phantom component, and they will hence be referred to as “ELF samples”. For the first uterine phantom, 1-cm thick, 2.6 cm diameter ELF samples were made, while for the second uterine phantom both 1-cm and 2-cm thick ELF samples were made. A full description of the measurement procedures is given in Madsen et al. (2006b).
Regarding production of the first uterine phantom, the temporary elevation of temperature of the TM myometrium/cervix and TM fibroids could have lowered Young’s modulus values of those TM materials. During the time that the PEWM was melted away in 40°C oil to form the uterine cavity (about 15 minutes), one of two identical ELF samples of the TM myometrium/cervix was also immersed in the 40°C oil. Comparison of Young’s modulus values for the two TM myometrium/cervix ELF samples – one heated at 40°C during the PEWM melting and the other maintained at room temperature – allowed estimation of the effect of heating on the TM myometrium/cervix in the final phantom. Unfortunately, only one ELF sample had been produced with the TM fibroids, and we did not immerse that during the PEWM melting. To assess the corresponding change in Young’s modulus of the TM fibroids a pair of ELF samples was produced after completion of the first uterine phantom and one sample was heated in 40°C oil for 15 minutes and the other was left at room temperature.
STRAIN IMAGING METHODS
RF data acquisition
Radiofrequency (RF) data were acquired for each phantom for each of two different ultrasound systems. Data were acquired during an increase in uterine cavity volume of at least 9%, which corresponded to 1–2 mL. The amount needed to separate the sides of the uterine cavity is patient dependent and amounts of 2–30 mL have been reported to be used for in vivo SIS (Berridge & Winter 2004; Parsons 2001). However, this amount is introduced into the cavity slowly – dependent on pain tolerance of the patient – so 1-2 mL corresponds to clinical situations.
RF data were collected using the Ultrasound Research Interface (URI) on the Siemens Antares SONOLINE™ system (Siemens Medical Solutions USA, Inc., Ultrasound Division, Mountain View, CA, USA) using VFX 9-4 and VFX 13-5 linear array transducers. The transducers were operated at 9 and 11 MHz, respectively, and the bandwidth of the transmitted signal was approximately 80% (RF data is usually acquired at 3–4 MHz transabdominally and 7–8 MHz transvaginally for in vivo imaging). Digitized RF echo data were sampled at 40 MHz and stored for off-line processing.
RF data were also collected using the Aloka SSD 2000 Scanner with a 7.5 MHz linear array transducer. Data were sampled at 100 MHz and digitized using a 12-bit data acquisition board (CompuScope 12400, Gage Applied Technologies Inc., Montreal, Quebec, Canada).
Strain image generation
Two motion tracking algorithms available in our research lab were used to generate strain images. All strain images in this manuscript display the absolute value of the strain. The motivation for comparing the performance of different ultrasound strain imaging systems was to see what the effect of SNR and acquisition frequency was on the strain images when such small strains were applied. With the first algorithm, offline analysis of the RF data sets collected using the Antares and the first uterine phantom consisted of up-sampling in the axial direction four times using filter-based 2D spline interpolator. A 2-D search strategy (Zhu & Hall 2002) was used to calculate displacement estimates, and strain images were produced using these displacement estimates by applying a modified 2-D block-matching algorithm. The pre- and post-deformation RF frames for a rectangular kernel were used to compute the sum-squared difference (SSD) in the 2-D block-matching algorithm. A 50% overlap between adjacent motion tracking kernels was used with tracking kernels of 1.0×0.3 mm2 (width × length). A 2.43-mm moving linear regression window was used to estimate the axial strain from these displacement estimates.
Using a second motion tracking algorithm, strain images for both uterine phantoms were produced from the RF data acquired with the Antares and Aloka. Offline analysis of the RF data acquired included up-sampling in the axial direction four times and in the lateral direction two times using the interp function in Matlab (MATHWORKS, Natick, MA). A 2-D cross-correlation multi-level pyramid was used to track displacement (Shi & Varghese 2007), and a sliding linear regression window (given in Table 3) was used to estimate the axial strain from the displacement estimates (2-D multilevel strain estimation technique). Three sets of kernel lengths and widths are used in this algorithm to track the displacement from a coarse to fine search. Due to the small amount of displacement in the RF data collected, it was sufficient to only use the finer two levels to track the displacement when processing this data. Specific kernel sizes and step sizes between adjacent displacement tracking kernels used for each system are given in Table 3.
Table 3.
Kernel sizes and overlaps between adjacent displacement tracking kernels and linear regression window length used with the 2-D multilevel strain estimation technique. The first number in each bracket was used in the coarsest search, and the second number was used in the finest search.
| System | fc (MHz) |
Linear Regression Window (mm) |
Axial Kernel Length (mm) |
Axial Step Size between Adjacent Tracking Kernels (mm) |
Lateral Kernel Width (mm) |
Lateral Step Size between Adjacent Tracking Kernels (mm) |
|---|---|---|---|---|---|---|
| Antares | 11 | 1.06 | [0.963,0.286] | [0.385,0.0963] | [0.757,0.379] | [0.303,0.151] |
| 9 | 1.06 | [0.963,0.286] | [0.385,0.0963] | [1.07,0.535] | [0.428,0.214] | |
| Aloka | 7.5 | 2.31 | [1.54,0.539] | [0.308,0.116] | [0.364,0.182] | [0.364,0.182] |
To reduce misinterpretation of tracking errors due to lack of echoes from the liquid-filled uterine cavity, the cavity was masked out. The mask was obtained by manually segmenting the uterine cavity on the B-mode image using the roipoly function in Matlab. The masked area is shown in white in the strain images.
Strain images were produced from the same RF data set taken on the first uterine phantom using the 2-D block matching and the 2-D multilevel strain estimation technique. From these images, the strain contrast between the TM myometrium/cervix and fibroid was calculated. To allow for direct comparison with the elastic contrast, the strain contrast of the TM fibroid can be defined as:
| (2) |
RESULTS AND DISCUSSION
Material properties
Table 4 gives the densities, propagation speeds, and attenuation coefficients for each of the phantom components. The attenuation coefficients have been corrected for water attenuation. It should be noted that we did not attempt to match closely the attenuation coefficients or propagation speeds of the phantom components to their corresponding tissue types.
Table 4.
Ultrasound properties at 22°C for the components of Uterine phantoms #1 and #2. Columns 4 and 5 were generated by curve-fitting data between 3 and 10 MHz using the relation α = α0fn where α0 and n are constants and f is the frequency.
| Tissue Type | Density (g/mL) |
Prop. Speed (m/s) |
Attenuation coefficient | Atten. coeff. ÷ freq. at 7 MHz (dB/cm/MHz) |
||
|---|---|---|---|---|---|---|
| α0 (dB cm−1 MHz−n) | n | |||||
| Uterine Phantom #1 |
Myometrium and Cervix | 0.97 ± 0.005 | 1520 ± 1 | 0.20 ± 0.04 | 1.40 ± 0.08 | 0.41 ± 0.02 |
| Fat | 0.94 ± 0.005 | 1486 ± 1 | 0.50 ± 0.06 | 1.13 ± 0.05 | 0.61 ± 0.02 | |
| Fibroid | 1.01 ± 0.005 | 1581 ± 1 | 0.052 ± 0.015 | 2.0 ± 0.1 | 0.34 ± 0.02 | |
| Uterine Phantom #2 |
Myometrium and Cervix |
0.98 ± 0.005 | 1524 ± 1 | 0.19 ± 0.04 | 1.43 ± 0.09 | 0.48 ± 0.02 |
| Fat | 0.94 ± 0.005 | 1493 ± 1 | 0.34 ± 0.09 | 1.25 ± 0.11 | 0.59 ± 0.02 | |
| Fibroid | 1.01 ± 0.005 | 1569 ± 1 | 0.073 ± 0.017 | 1.91 ± 0.1 | 0.45 ± 0.02 | |
| Endometrial polyp | 0.95 ± 0.005 | 1492 ± 1 | 0.28 ± 0.05 | 1.28 ± 0.08 | 0.50 ± 0.02 | |
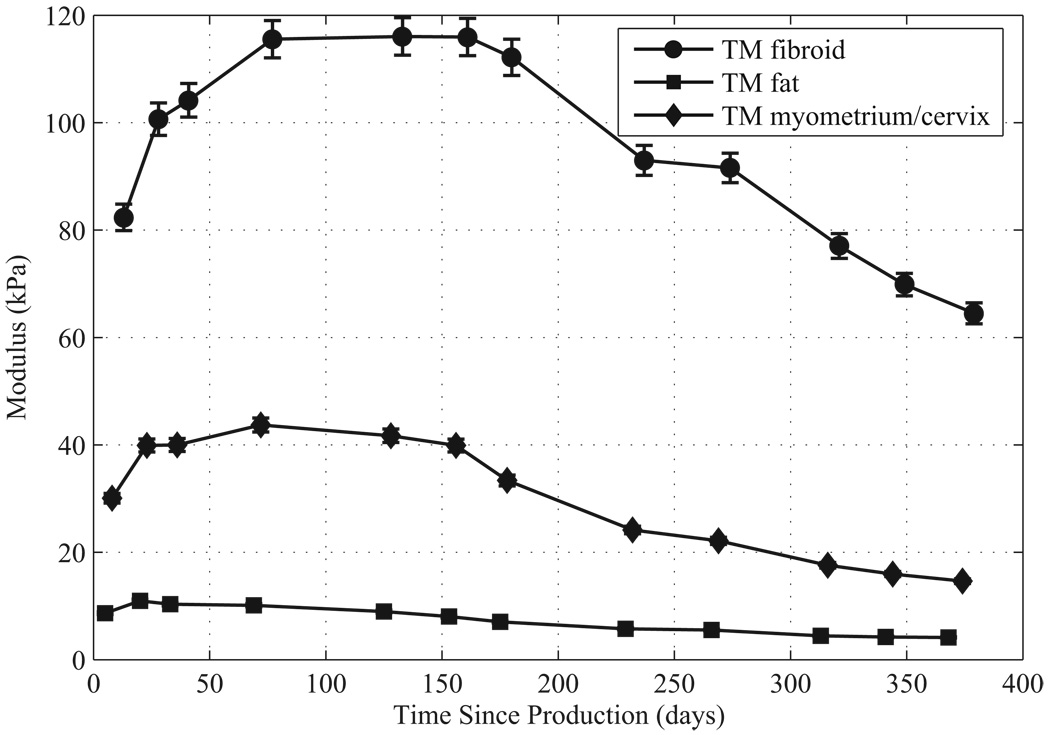
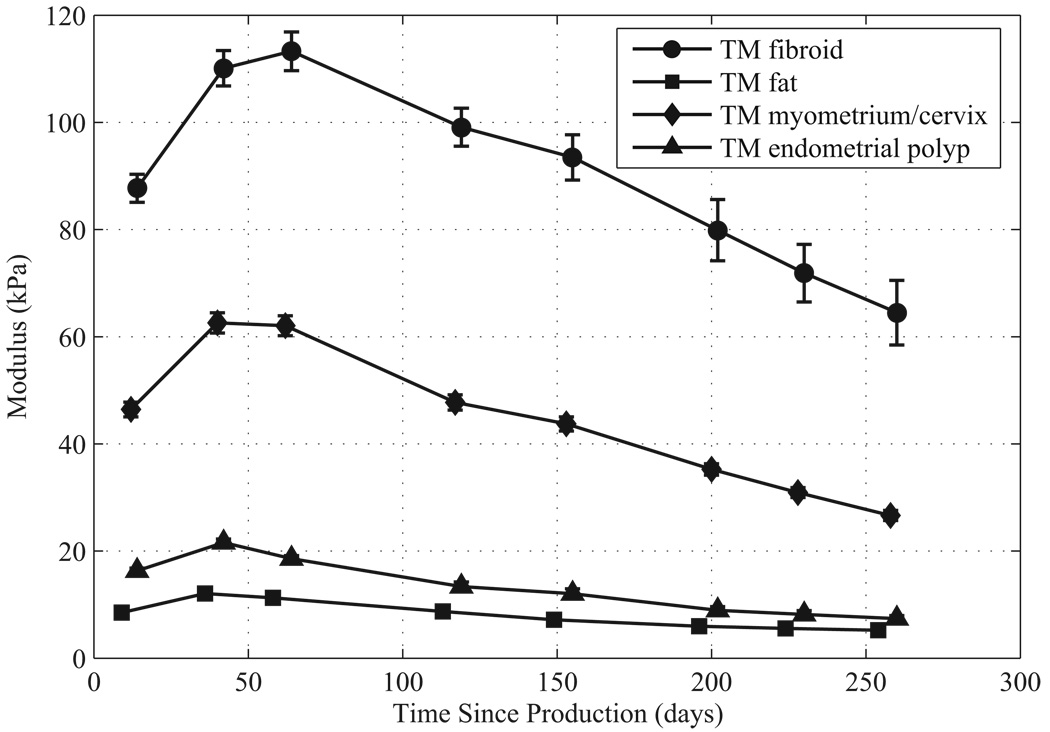
For each phantom component the Young’s storage modulus values and standard errors over time are given in Figure 7 and Figure 8. Note that Young’s storage moduli were measured on the isolated ELF samples. Each ELF sample was stored immersed in safflower oil in a small sealed glass container between measurements. Methods for calculating the standard error in the measurements are described in Madsen et al. (2005b). Note that over the measurement period, the storage moduli of the components of both phantoms increased in the first 50–60 days after production. In the first uterine phantom, the storage moduli stayed constant up to five months after production, and then slowly decreased. In the second uterine phantom, the storage moduli started slowly decreasing after 50–60 days after production.
Figure 7.
Young’s storage moduli at 1 Hz over time since production for components of the first uterine phantom.
Figure 8.
Young’s storage moduli at 1 Hz over time since production for components of the second uterine phantom.
The mean Young’s storage modulus values for TM fibroid, TM myometrium/cervix, and TM fat given in Figure 7 and Figure 8 agree reasonably well with the values obtained by Kiss et al. (2006), Krouskop et al. (1998), and Wellman (1999). The mean storage moduli of the TM fibroids, TM myometrium, and TM fat over the measurement time for the first phantom are 95, 30, and 7.4 kPa, respectively, and for the second phantom are 90 kPa, 44, and 8.1 kPa, respectively. The mean values for the TM fibroids of both phantoms correspond well to the mean value of 100 ± 10 kPa that Kiss et al. (2006) obtained; however, the mean storage modulus of the TM fibroids of the second phantom are somewhat lower. The mean value for the TM myometrium/cervix of the second uterine phantom is closer to the mean 40 kPa obtained by Kiss et al. (2006) than that of the TM myometrium/cervix of the first uterine phantom. The mean TM fat storage moduli values for the first and second uterine phantoms are lower than the 18 ± 7 kPa obtained by Krouskop et al. (1998), however they are closer to the human breast fat value of 5 kPa measured by Wellman (1999).
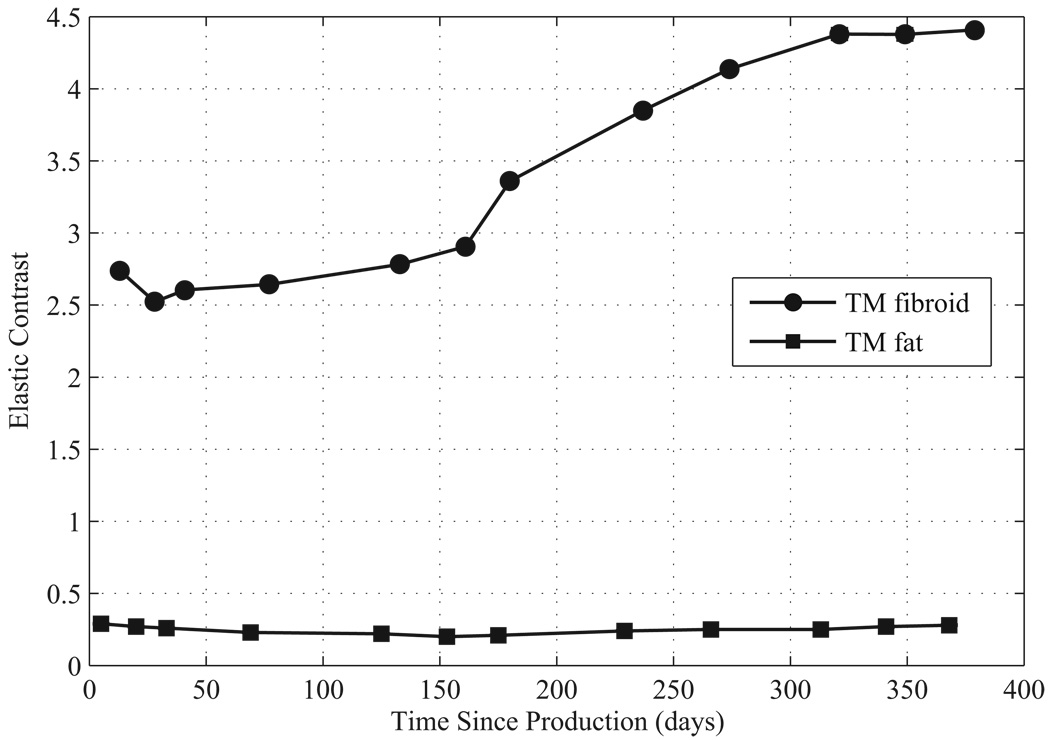
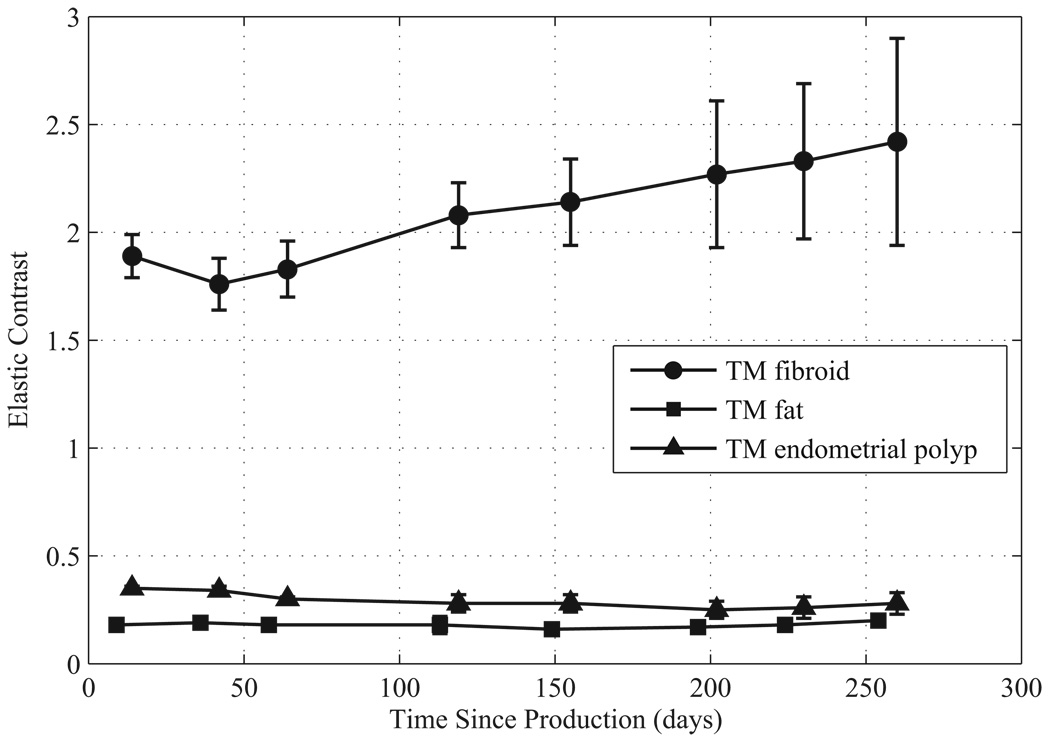
The elastic contrasts for the TM materials are given in Figure 9 and Figure 10. The elastic contrast for the TM fibroids of the first uterine phantom stays close to 2.5 for the first 160 days, but then increases. The elastic contrast for the TM fibroids of the second uterine phantom begins at about 1.9 but then gradually increases to 2.5 over 260 days. Using the mean value provided by Kiss et al. (2006) for the myometrium and cervix, the elastic contrast for in vitro uterine fibroids is 2.5 which is in the range of the elastic contrast of the TM fibroids during the first 150 days for the first uterine phantom and during the first 260 days for the second phantom.
Figure 9.
Elastic contrast over time since production for components of the first uterine phantom.
Figure 10.
Elastic contrast over time since production for components of the second uterine phantom.
The elastic contrast values for the TM endometrial polyps and TM fat stay relatively constant over the measurement period. Using the mean values of human breast fat provided by Krouskop et al. (1998) and Wellman (1999) with the mean value provided by Kiss et al. (2006) for the myometrium/cervix, the elastic contrast of fat is 0.45 and 0.125, respectively. The elastic contrast for the TM fat in the first and second uterine phantoms was 0.21 and 0.18, respectively.
The effect on the Young’s storage modulus of immersing the TM material in 40°C oil to melt away the PEWM during manufacture was investigated. The Young’s storage modulus value of the TM myometrium/cervix ELF sample that was immersed in a 40°C oil bath was 20% lower than the sample that wasn’t, while the 40°C TM fibroid material was lower than the unheated version again by 20%. Thus, while the absolute moduli decrease with temperature exposure, the elastic contrast does not appear to be significantly affected by the heating.
When making future uterine phantoms with oil-in-gelatin TM material, the decrease in the Young’s storage moduli both over time and when immersed in a warm oil bath presented in this paper should be taken into consideration when choosing the appropriate TM materials. It should also be noted that these were isolated ELF samples that had been stored between measurements in separate containers without any contact to each other and are not samples excised from the phantom. However, Madsen et al. (2006b) has shown that there is good agreement between the Young’s storage moduli and elastic contrasts for isolated ELF samples produced at time of phantom production and samples excised from the phantom.
Strain images
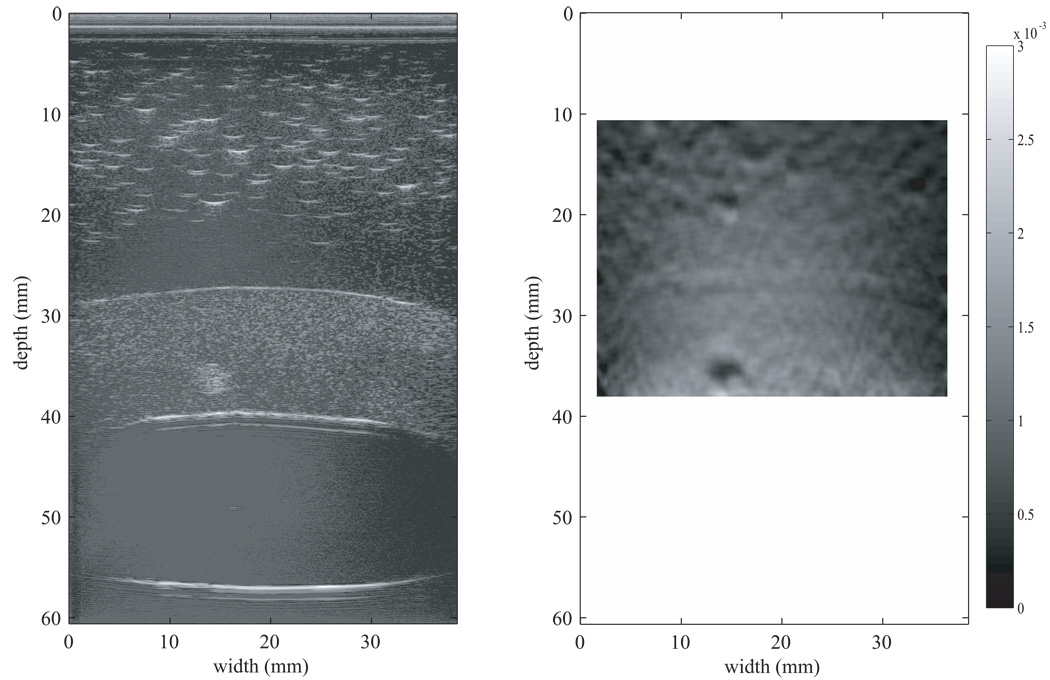
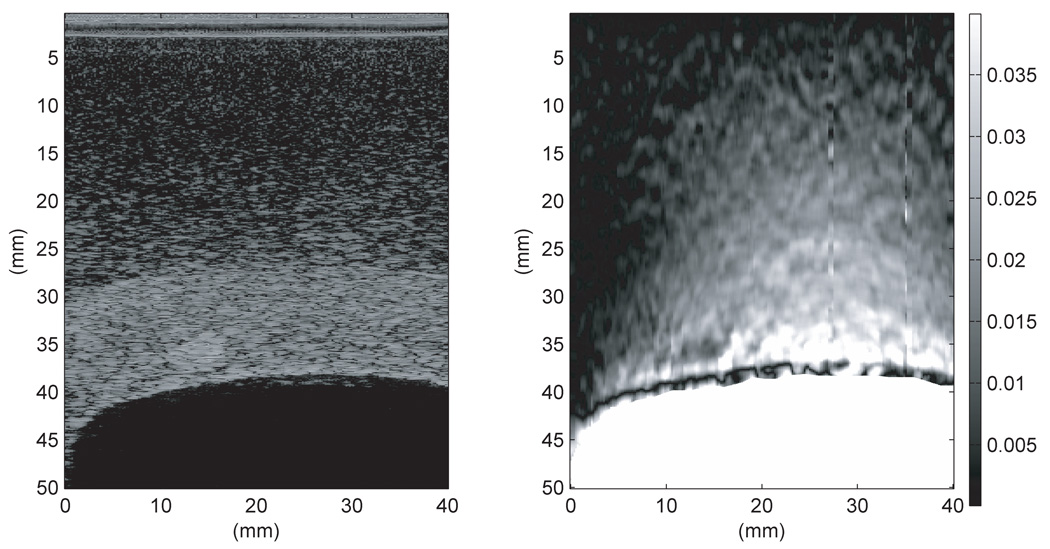
The strain image for the first uterine phantom in Figure 11 was produced using the 2-D block matching algorithm with RF data taken using the Siemens Antares at VFX 13-5 probe operating at 11 MHz. The bright white spots from 0–20 mm in depth in the B-mode image in Figure 11 are from larger oil droplets in the TM fat material. Figure 11 indicates that the 3-mm spherical inclusion has lower strain than the surrounding TM myometrium/cervix material; this lower strain is expected given the elastic contrast determined from EnduraTEC measurements on isolated test samples.
Figure 11.
B-mode image (left) and strain image (right) of the first uterine phantom. The strain image was produced using the 2-D block matching algorithm with RF data taken using the Siemens Antares at VFX 13-5 probe operating at 11 MHz. Note that the 3-mm spherical inclusion clearly has lower strain than the surrounding TM myometrium/cervix material; 0% strain is black and 0.3% strain is white on the grayscale.
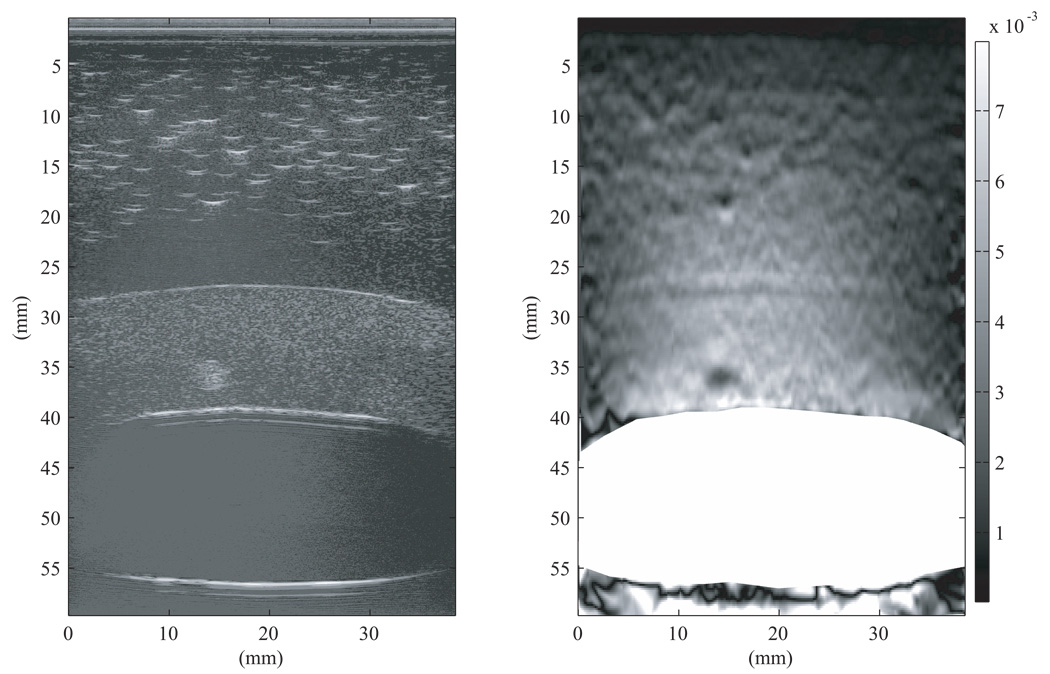
The strain image in Figure 12 was generated using the 2–D multilevel strain estimation technique applied to the same RF data used in Figure 11; the 3-mm spherical inclusion again has a lower strain than the surrounding myometrium/cervix TM materials. The dark circles seen in the strain images in Figure 11 and Figure 12 at a depth of 15–20 mm are strain image artifacts and not TM fibroids.
Figure 12.
B-mode image (left) and strain image (right) of the first uterine phantom. The strain image was produced using the 2-D multilevel strain estimation technique with the same RF data used to generate the strain image in Figure 11. The uterine cavity has been masked out to prevent any displacement tracking errors due to liquid in the cavity. Note that the 3-mm spherical inclusion again has a lower strain than the surrounding TM myometrium/cervix. In this image 0% strain is black and 0.8% strain is white on the grayscale. The dark circles seen in the strain image in Figure 12 at a depth of 15–20 mm are strain image artifacts and not TM fibroids.
From the RF data used to produce the strain images in Figure 11 and Figure 12, the mean strain contrast over consecutive frames can be computed. Using 10 consecutive strain images produced using 2-D block matching algorithm, the mean strain contrast for the TM fibroid was 2.43 ± 0.20. The mean strain contrast for the TM fibroid calculated from 34 consecutive stain images produced using the 2-D multilevel strain estimation technique was 2.14 ± 0.12. The strain contrast determined from both algorithms is consistent with the mean elastic contrast of 2.5 during the first 160 days after phantom production which is when this data was collected. (See Fig. 9).
Notice the dark (apparent higher stiffness) band at the fat-to-myometrium interface in the strain image in Figure 12. This dark band is an artifact due to the fact that the specular reflection dominates the speckle, and the shape of the RF signal corresponding to the specular reflection remains unchanged during the application of stress. The strain imaging algorithm, which employs a 200 µm kernel, interprets the unchanging RF wave form as a region with high stiffness.
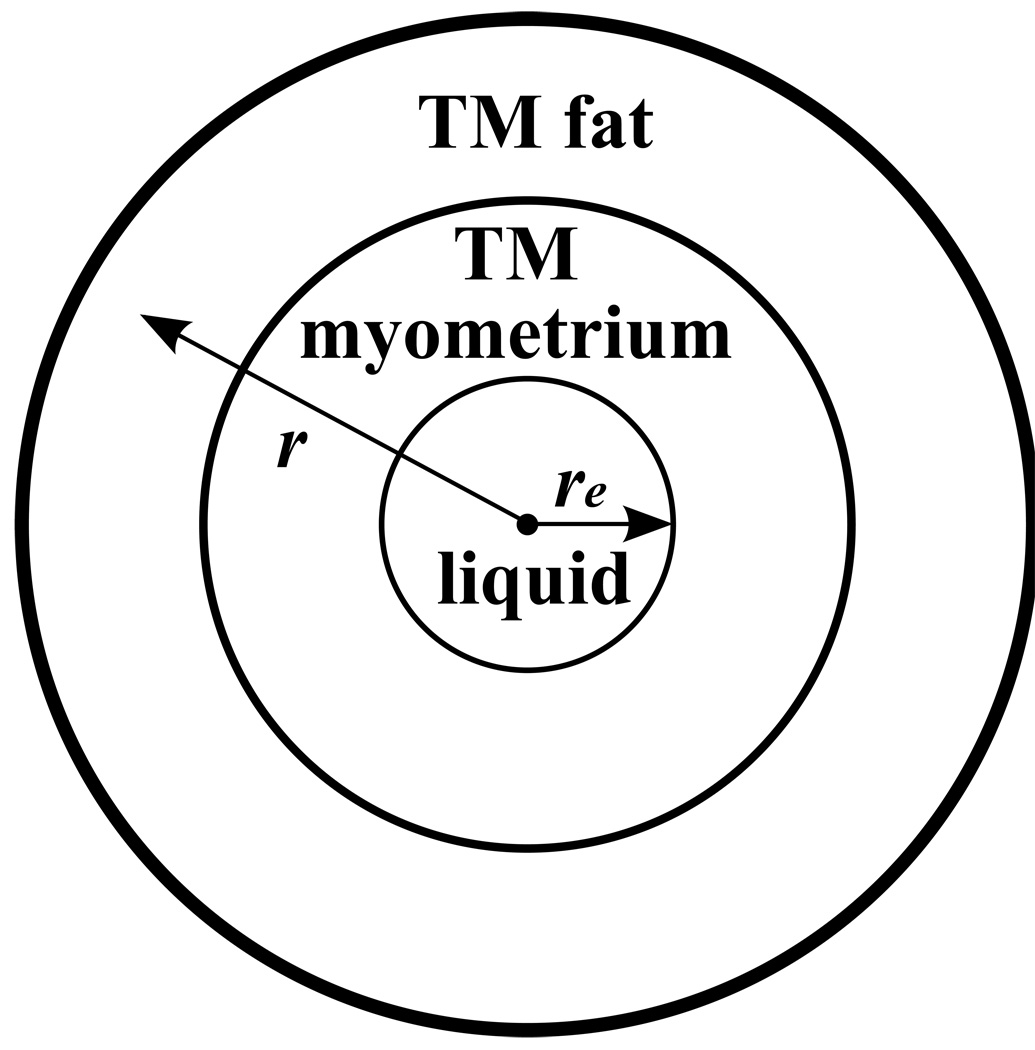
A more challenging aspect of the strain image in Figure 12 is that, except for the specular reflection artifact discussion in the last paragraph, there was no apparent change in strain in passing from the TM myometrium into the upper TM fat layer – even though the Young’s modulus of the TM myometrium is about 5 times that of the TM fat (See Fig. 9). A likely explanation is that the local distortion of the TM materials in the vicinity of the interface is minimal, contrary to the case when there is a local object such as a 3-mm diameter sphere (TM fibroid) in the TM myometrium which also has a much different Young’s modulus than the TM myometrium. The stress at the inner surface of the TM myometrium is perpendicular to that surface and that surface is approximately parallel to the TM fat-to-myometrium interface. That type of geometry also exists for simpler but similar geometries which are easier to analyze. One case is that in which spherical symmetry exists, i.e., a liquid filled spherical inner cavity of radius re is surrounded by a spherical shell of TM fat (See Fig. A-1 in the Appendix).
Figure A-1.
Symmetric Phantom. A liquid filled sphere (or cylinder) is surrounded by a spherical (or cylindrical) shell of TM myometrium which is surrounded by a spherical (or cylindrical) shell of TM fat.
For isotropic incompressible materials with the spherically symmetric geometry in Figure A-1, it is shown in the Appendix that for an point initially at a distance e r ≥ re, the increase in r (i.e., the displacement Δr ) due to increase in liquid volume is independent of the Young’s moduli of the component materials, and for small values of Δre/re, Δr ∝̃ r−2 and the local strain, dΔr/dr , is also independent of the Young’s moduli.
A second case in the Appendix involves the expansion of a cylindrical section of fixed length L where there is a central liquid volume surrounded by concentric cylinders. Again the displacement Δr is independent of Young’s moduli and Δr ∝̃ r-1, and the strain at any r, dΔr/dr, is again independent of Young’s moduli and
The geometry of the uterine phantom is somewhat similar to the two examples given in the Appendix. Because of the broad interfaces of the TM fat-to-TM myometrium, it is reasonable that independence of Young’s moduli of the strains in the neighborhood of the interface is nearly the case. Also the decrease in local strain with increasing distance from the liquid filled cavity in Fig. 12 is also argued by the r−3 and r−2 dependencies of dΔr/dr described in the Appendix.
Also note that the quality of the strain image created using the 2-D block matching and that using the 2-D multilevel strain estimation technique produced are comparable. The quality of the strain images can be determined by calculating the CNRe (Varghese & Ophir 1998) which is defined as:
| (3) |
where s1 and σ1 are the mean and standard deviation of the strain, respectively, in the TM fibroid, and s2 and σ2 the mean and standard deviation of the strain, respectively, in the TM myometrium/cervix. The mean CNRe value calculated from ten consecutive strain images produced using the 2-D block matching algorithm was 37.0 ± 4.49 dB, while the mean CNRe value from 34 consecutive strain images produced using the 2-D multilevel strain estimation technique was 29.0 ± 2.60 dB; thus the quality of the strain image produced using the 2-D block matching algorithm was slightly better given the higher CNRe. However, as shown previously by Shi and Varghese (2007), the 2-D multilevel strain estimation technique will be able to track the tissue motion better than the 2-D block matching method when the assumption of continuous tissue motion is violated (e.g., expansion about the inner cavity).
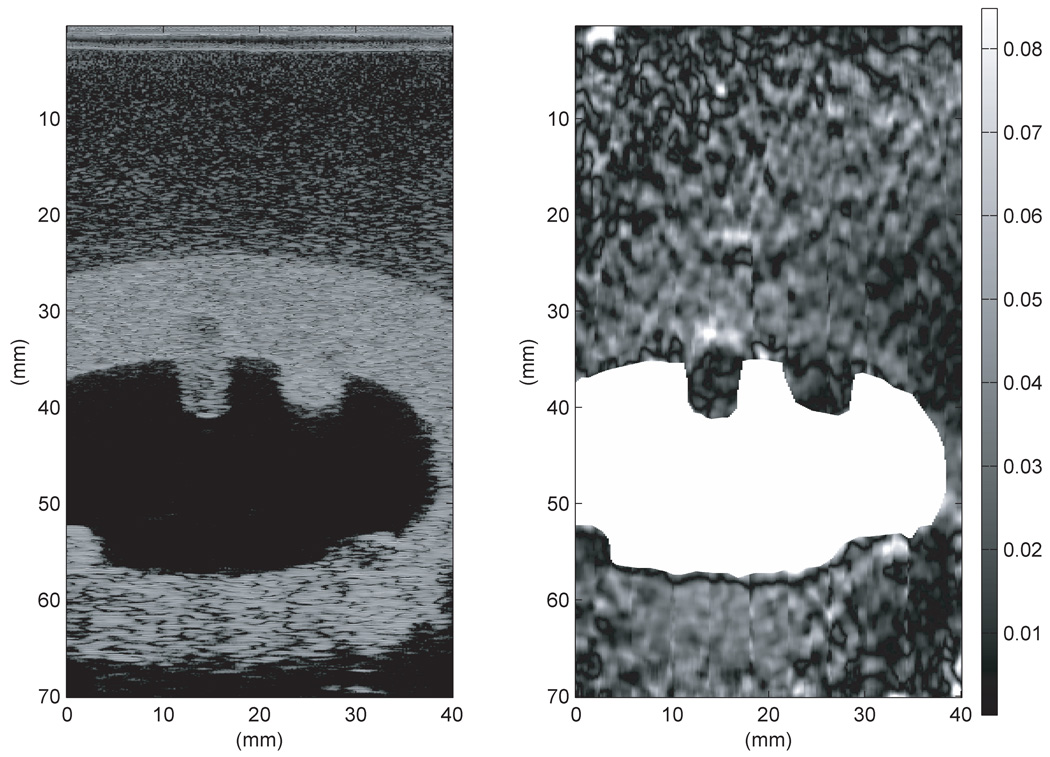
Figure 13 was produced from RF data taken using the second uterine phantom and the Antares with the VF-X 9-4 probe operating at 9 MHz. During data acquisition, attempts were made to keep the scan slice as well as possible near the centers of the spherical inclusions and on the axis of symmetry of the elongated TM polyp. Note that the centers and axis are not quite coplanar, so perfect alignment was impossible. The strain images were produced using the 2-D multilevel strain estimation technique. In Figure 13, the initial B-mode image is shown on the left and was used to define the boundary of the uterine cavity. That boundary was used to mask the artifacts in the uterine cavity produced in the strain image (as seen in center image in Figure 13). The mask is white corresponding to the very high mobility of the liquid in the cavity. If this method could be applied clinically, there would be an automatic segmentation program available for the physician or sonographer to use for masking out the cavity. The particular frame used for masking does not appear to be significant. The physician or sonographer should be able to create the mask from any acquired frame.
Figure 13.
B-mode image (left), strain image without masking (middle), and strain image with masking (right) of the second uterine phantom from RF data acquired on the Antares at 9 MHz. The strain image was produced using the 2-D multilevel strain estimation technique. Masking was done with the first frame used to track the displacement. Note that, compared to the TM myometrium/cervix, the parts of the endometrial polyps (center upper and lower left lesions in the B-scan) that project into the uterine cavity show lower strain and the parts within the TM myometrium/cervix show higher strain. The fibroid (upper right lesion) has lower strain compared to the TM myometrium/cervix with the parts projecting into the uterine cavity having lowest strain. In this image 0% strain is black and 3% strain is white on the grayscale.
The elongated TM polyp was considered important enough that a strain image was generated with a concentrated effort to maintain the scan plane superimposed on its axis and symmetry. The symmetry axis was parallel to the US beam direction. This positioning was accomplished by maximizing the B-scan marks corresponding to specular reflections at each end of the TM polyp and maintaining the lateral dimension of the marks perpendicular to the TM polyp axis. In addition, a larger strain extent was produced by injecting more cavity liquid than that corresponding to Figure 13 – approximately 5 mL instead of 2 mL as in Figure 13. In Figure 14 – from left to right – are shown the B-mode frame from the second frame used to track the displacement, the strain image without masking, and masked strain image. As a result of the greater strain, the strain image is less noisy and gray level contrasts are better depicted than in Figure 13. Note that the region of higher strain of the TM polyp extends only about 1 mm into the uterine cavity.
Figure 14.
B-mode image (left), strain image without masking (middle), and strain image with masking (right) of the second uterine phantom from RF data acquired on the Antares at 9 MHz. The strain image was produced using the 2-D multilevel strain estimation technique with the uterine cavity masked out (right image) employing the second frame used to track the displacement. Extra care was taken to superimpose the scan plane on the TM polyp’s axis of symmetry and to make the beam axes of propagation parallel to that axis of symmetry. In this image 0% strain is black and 6% strain is white on the grayscale.
Notice that the parts of the TM polyp and TM fibroids that project into the uterine cavity appear to be very stiff. This apparent high stiffness value is due to the fact that – at any instant of time – the liquid surrounding these parts exerts a uniform pressure on their surface resulting in almost no distortion and, therefore, almost no relative displacements of speckle echoes during the period of increased strain. This phenomenon was discussed in more detail in the Introduction.
Figure 15 and Figure 16 show B-mode and strain images of the first and second uterine phantom, respectively, from RF data taken on the Aloka at 7.5 MHz. The strain images in both of these figures were again produced using the 2-D multilevel strain estimation technique with the uterine cavity masked out. The strain images are much noisier than those determined using the Antares. In Fig. 15, the TM fibroid is not well distinguished in the noisy background of the strain image. The strain image in Figure 16 again is noisy, but the embedded soft part of the elongated TM polyp exhibits higher strain as expected. The lower quality of the Aloka images may be due to the combination of lower acquisition frequency and lower SNR of the Aloka relative to the Antares (Madsen et al. 2005a).
Figure 15.
B-mode image (left) and strain image (right) of the first uterine phantom from RF data acquired on the Aloka at 7.5 MHz. The strain image was produced using the 2-D multilevel strain estimation technique with the uterine cavity masked out using the second frame used to track the displacement. In this image 0% strain is black and 4% strain is white on the grayscale.
Figure 16.
B-mode image (left) and strain image (right) of the second uterine phantom from RF data acquired on the Aloka at 7.5 MHz. The strain image was produced using the 2-D multilevel strain estimation technique with the uterine cavity masked out using the second frame employed to track the displacement. In this image 0% strain is black and 8.5% strain is white on the grayscale.
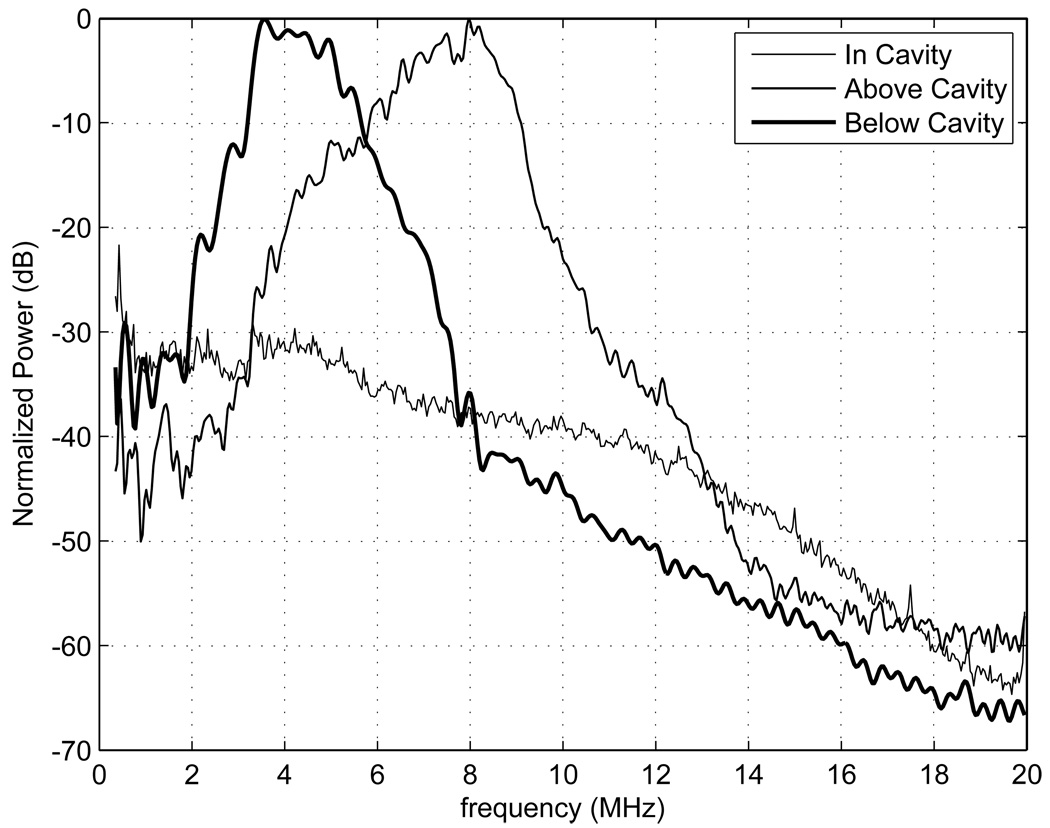
Power spectra were generated for the proximal and distal side of the TM myometrium/cervix and for the uterine cavity using RF data taken on the second uterine phantom with the Siemens Antares; the spectra are shown in Fig. 17. The power spectra in the cavity have been normalized to the maximum value of the spectra above the cavity. Ideally there should be no echoes from within the cavity; however, electronic noise in the cavity is evident. This electronic noise is erroneously tracked, leading to spurious strain in the cavity as seen in the center images of Fig. 13–Fig. 14 where the cavity is not masked out.
Figure 17.
Power spectra generated from RF data taken using the second uterine phantom and the Siemens Antares VFX 13-5 transducer operated at 9 MHz in, above, and below the uterine cavity. The power spectrum in the cavity was normalized to the maximum value of the spectrum above the cavity. The power spectrum in the uterine cavity shows that there is presumably electronic noise detected, which leads to significant strain image noise within the cavity. The power spectra proximal and distal to the uterine cavity show a decrease in bandwidth with depth.
Comparison of power spectra proximal and distal to the uterine cavity (refer to Figure 17) shows a decrease in bandwidth with depth. Bilgen and Insana (1997) showed that, when cross-correlation techniques are used to estimate the displacement, the error in displacement increases as the bandwidth decreases. Walker and Trahey (1995) also gave an expression for the Cramér-Rao lower bound which predicted the same effect. This explains why, in Fig. 12–14, that the strain images distal to the uterine cavity are noisier than proximal to the uterine cavity. Thus, if small lesions are present distal to the uterine cavity, it could be difficult to track the displacement and distinguish them on strain images.
CONCLUSIONS
Durable phantoms simulating the uterus and abnormal structures with well-defined properties have been produced. These phantoms allow realistic assessment of saline infused sonohysterography strain imaging methods and their diagnostic promise. The phantoms can be used in simulating patient studies using transabdominal US or transvaginal US systems. In addition to their value as a research tool for the refining SIS strain imaging methods, they could also serve clinical personnel to develop insight regarding data acquisition techniques and regarding interpretations of SIS strain images before beginning patient procedures. The results presented in this paper from different strain imaging methods have shown that different methods are of different quality – i.e. the combination of lower acquisition frequency and lower SNR produced lower quality strain images in the Aloka compared to the Antares.
The anthropomorphic uterine phantom can lead to perhaps unexpected insights into possible limitations of the SIS strain imaging technique. For example, since strain imaging depends on distortion of incompressible materials, it was expected that the further a lesion projects into the liquid-filled uterine cavity, the stiffer it will appear to be – regardless of its actual stiffness. This apparent stiffness was demonstrated with the second uterine phantom. Thus, the actual stiffness of a lesion relative to the uterine wall can be determined only for that part of the lesion embedded in the uterine wall.
An unexpected result was the lack of strain contrast between the TM fat and myometrium. Since the Young’s modulus of the TM myometrium was five times larger than that of the TM fat, it was expected that there would be a considerable difference in the strain in the transition from the TM myometrium to the TM fat. However, there was little if any change in the strain, leading to a possible explanation in terms of the similarity of the TM fat-to-TM myometrium interface with an axially symmetric or a spherically symmetric interface with a central liquid-filled cavity; in the symmetric cases, no change in strain occurs as the interface is crossed.
ACKNOWLEDGEMENTS
We would like to acknowledge the help of Shyam Bharat, Matthew McCormick, Kibo Nam, Min Rao, and Amy Sommer with help in RF data collection. We would also like to acknowledge that this study was funded in part by NIH grants R01EB000459, R01CA100373, 2-T32-CA-09206.
APPENDIX: Lack of elastic contrast for symmetric layered media
Consider the diagram in Figure A-1 depicting a sphere of liquid surrounded by a spherical shell of TM myometrium which is surrounded by a spherical shell of TM fat. The materials are considered to be isotropic and incompressible, i.e., (The value for water is 5×10⁻¹⁰ m2/N and for vegetable oil is about 6×10⁻¹⁰ m2/N).
Let the initial radius of the liquid sphere be re and the increase be re + Δre with injection of more liquid. Because of incompressibility, the increase in volume of any concentric sphere of radius r ≥ re increases by a constant:
where Δr is the increase in r corresponding to Δre Dividing the right side of through by r, we get:
Solving for Δr, the displacement at r, we get:
| (A1) |
Thus, for initial distance r from the center, the local strain is independent of the Young’s moduli of the component materials. Taking the value of re to be 2 cm and C to be the change in volume of the liquid in the uterine cavity, i.e. about 5 mL, we have:
Employing the binomial expansion of the first term in {}’s on the right of Equation A1, we get:
i.e., the displacement at a distance r from the center is inversely proportional to r2. Then the local strain at any distance r from the center is:
and is also independent of the Young’s modulus. Thus, no discontinuity in local strain occurs at the interface between the TM myometrium and TM fat.
The same type of calculation can be done for a coaxial cylinder corresponding to Figure A-1. Consider the three-layered cylindrical object to have fixed length L with an initial liquid core radius, re, of 2 cm and initial volume, , of 40 cm3 (L ≈ 3 cm). Taking the change in re to be such that the increase in volume of the liquid core is 5 cm3 with expansion, we have:
Solving for the displacement at r, we have:
which is again independent of Young’s modulus values.
The local strain at any distance r from the symmetry axis is therefore:
which again is independent of Young’s moduli and no discontinuity occurs at the interface between the TM myometrium and TM fat.
Notice that this result implies limitations on cardiovascular elastography regarding distinguishing different coaxial layers of a blood vessel when the change in shape of the vessel corresponds to blood pressure changes.
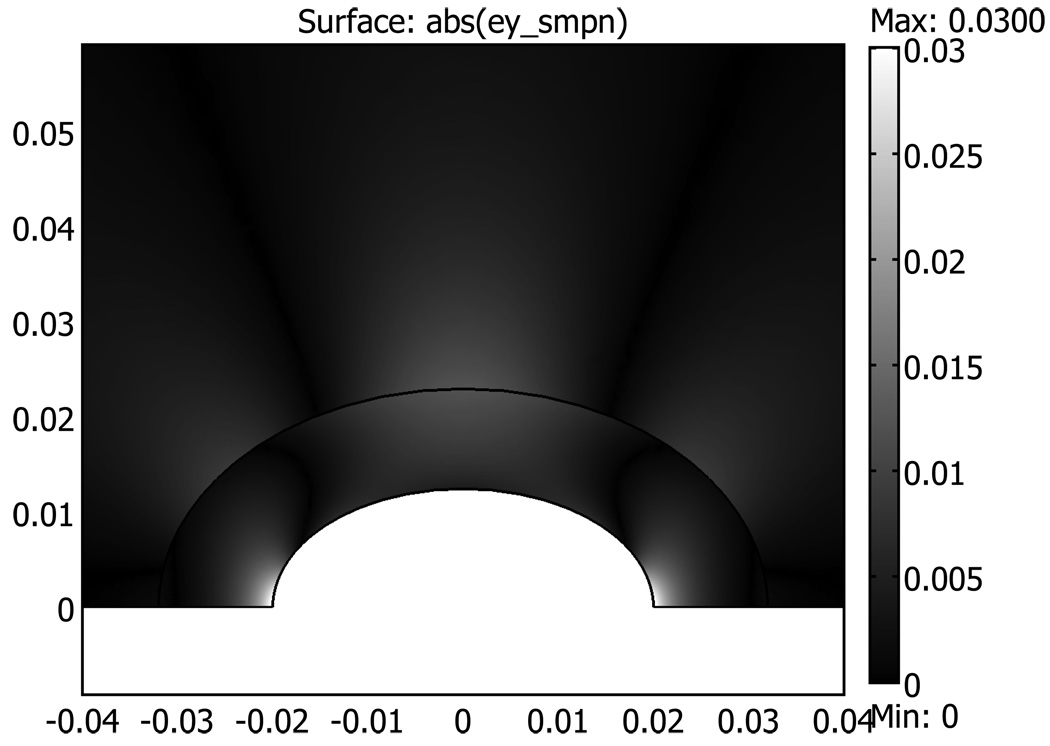
FEA software COMSOL 3.4 (Comsol Inc., Burlington, MA) was used to produce a two-dimensional simulation of the strain in the uterine phantom with no inclusions to corroborate the above discussion. The liquid filled cavity was an ellipse with a minor axis of 3.6 cm and a major axis of 7.2 cm (axes corresponding to Figure 14). A concentric ellipse represented the TM myometrium to TM fat interface with an ellipse with a minor axis of 6.0 cm and major axis of 12.0 cm (corresponding to Figure 14). The surrounding fat area was 30 cm × 30 cm. The Young’s modulus for the TM fat and myometrium used in the simulation were 7 kPa and 40 kPa, respectively. Plane strain conditions were assumed with the FEA simulation, and a pressure increase of 0.5 kPa was introduced in the liquid filled cavity. Figure A-2 shows the result of the FEA simulation, which is similar to the strain imaging results shown in Figure 11–Figure 14. Note particularly that Figure A-2 shows no discontinuity in the local strain at the interface between the TM myometrium and TM fat, and that there is a decrease in strain with increasing distance from the symmetry axis.
Figure A-2.
Two-dimensional FEA simulation of strain in uterine phantom with no inclusions. Distances on horizontal and vertical axis are in meters. Only the upper half of the simulation is shown since the lower half is just the mirror image of the upper half.
Footnotes
Publisher's Disclaimer: This is a PDF file of an unedited manuscript that has been accepted for publication. As a service to our customers we are providing this early version of the manuscript. The manuscript will undergo copyediting, typesetting, and review of the resulting proof before it is published in its final citable form. Please note that during the production process errors may be discovered which could affect the content, and all legal disclaimers that apply to the journal pertain.
REFERENCES
- Ascher SM, Reinhold C. Imaging of cancer of the endometrium. Radiologic Clinics of North America. 2002;40(3):563–576. doi: 10.1016/s0033-8389(01)00013-6. [DOI] [PubMed] [Google Scholar]
- Berridge DL, Winter TC. Saline infusion sonohysterography: Technique, indications, and imaging findings. Journal of Ultrasound in Medicine. 2004;23:97–112. doi: 10.7863/jum.2004.23.1.97. [DOI] [PubMed] [Google Scholar]
- Bilgen M, Insana MF. Error analysis in acoustic elastography. I. Displacement estimation. Journal of Acoustical Society of America. 1997;101(2):1139–1146. doi: 10.1121/1.418018. [DOI] [PubMed] [Google Scholar]
- Davis PC, O'Neill MJ, Yoder IC, Lee SI, Mueller PR. Sonohysterographic findings of endometrial and subendometrial conditions. RadioGraphics. 2002;22:803–816. doi: 10.1148/radiographics.22.4.g02jl21803. [DOI] [PubMed] [Google Scholar]
- Hatasaka H. The Evaluation of Abnormal Uterine Bleeding. Clinical Obstetrics and Gynecology. 2005;48(2):258–273. doi: 10.1097/01.grf.0000161485.35535.9a. [DOI] [PubMed] [Google Scholar]
- Hobson MA, Kiss MZ, Varghese T, Sommer AM, Kliewer MA, Zagzebski JA, Hall TJ, Harter J, Hartenbach EM, Madsen EL. In Vitro Uterine Strain Imaging: Preliminary Results. Journal of Ultrasound in Medicine. 2007;26:899–908. doi: 10.7863/jum.2007.26.7.899. [DOI] [PMC free article] [PubMed] [Google Scholar]
- Kaye GWC, Laby TH. Tables of Physical and Chemical Constants and some Mathematical Functions. 14th ed. London: London: 1973. p. 35. [Google Scholar]
- Kiss MZ, Hobson MA, Varghese T, Harter J, Kliewer MA, Hartenbach EM, Zagzebski JA. Frequency-dependent Complex Modulus of the Uterus: Preliminary Results. Physics in Medicine and Biology. 2006;51:3683–3695. doi: 10.1088/0031-9155/51/15/006. [DOI] [PMC free article] [PubMed] [Google Scholar]
- Krouskop TA, Wheeler TM, Kallel F, Garra BS, Hall T. Elastic moduli of breast and prostate tissue under compression. Ultrasonic Imaging. 1998;20:260–274. doi: 10.1177/016173469802000403. [DOI] [PubMed] [Google Scholar]
- Madsen EL, Dong F, Frank GR, Garra BS, Wear KA, Wilson T, Zagzebski JA, Miller HL, Shung KK, Wang SH, Feleppa EJ, Liu T, O'Brien WD, Jr, Topp KA, Sanghvi NT, Zaitsev AV, Hall TJ, Fowlkes JB, Kripfgans OD, Miller JG. Interlaboratory comparison of ultrasonic backscatter, attenuation, and speed measurements. J Ultrasound Med. 1999;18(9):615–631. doi: 10.7863/jum.1999.18.9.615. [DOI] [PubMed] [Google Scholar]
- Madsen EL, Frank GR, Hobson MA, Shi H, Jiang J, Varghese T, Hall T. Spherical lesion phantoms for testing the performance of elastography systems. Physics in Medicine and Biology. 2005a;50:5983–5995. doi: 10.1088/0031-9155/50/24/015. [DOI] [PMC free article] [PubMed] [Google Scholar]
- Madsen EL, Hobson MA, Frank GR, Shi H, Jiang J, Hall T, Varghese T, Doyley MM, Weaver JB. Anthropomorphic Breast Phantoms for Testing Elastography Systems. Ultrasound in Medicine and Biology. 2006a;32(6):857–874. doi: 10.1016/j.ultrasmedbio.2006.02.1428. [DOI] [PMC free article] [PubMed] [Google Scholar]
- Madsen EL, Hobson MA, Shi H, Varghese T, Frank GR. Tissue-mimicking agar/gelatin materials for use in heterogeneous elastography phantoms. Physics in Medicine and Biology. 2005b;50:5597–5618. doi: 10.1088/0031-9155/50/23/013. [DOI] [PMC free article] [PubMed] [Google Scholar]
- Madsen EL, Hobson MA, Shi H, Varghese T, Frank GR. Stability of heterogeneous elastography phantoms made from oil dispersion in aqueous gels. Ultrasound in Medicine and Biology. 2006b;32(2):261–270. doi: 10.1016/j.ultrasmedbio.2005.10.009. [DOI] [PMC free article] [PubMed] [Google Scholar]
- Parsons AK. Saline infusion sonohysterography. Medica Mundi. 2001;45(2) [Google Scholar]
- Shi H, Varghese T. Two-dimensional multi-level strain estimation for discontinuous tissue. Physics in Medicine and Biology. 2007;52(2):389–401. doi: 10.1088/0031-9155/52/2/006. [DOI] [PubMed] [Google Scholar]
- Sloane E. Anatomy and Physiology: An Easy Learner. Boston: Jones & Bartlett Publishers Inc.; 1994. p. 359. [Google Scholar]
- Varghese T, Ophir J. An analysis of elastographic contrast-to-noise ratio performance. Ultrasound in Medicine & Biology. 1998;24(6):915–924. doi: 10.1016/s0301-5629(98)00047-7. [DOI] [PubMed] [Google Scholar]
- Walker WF, Trahey GE. A Fundamental Limit on Delay Estimation Using Partially Correlated Speckle Signals. IEE Transactions on Ultrasonics, Ferroelectrics, and Frequency Control. 1995;42(2):301–308. [Google Scholar]
- Wellman PS. Tactile Imaging [PhD] Boston: Harvard University; 1999. p. 137. [Google Scholar]
- Zhu Y, Hall TJ. A modified block matching method for real-time freehand strain imaging. Ultrasonic Imaging. 2002;24:161–176. doi: 10.1177/016173460202400303. [DOI] [PubMed] [Google Scholar]


