

Abstract
The intramolecular diffusive motion within supercoiled DNA molecules is of central importance for a wide array of gene regulation processes. It has recently been shown, using fluorescence correlation spectroscopy, that plasmid DNA exhibits unexpected acceleration of its internal diffusive motion upon supercoiling to intermediate density. Here, we present an independent study that shows a similar acceleration for fully supercoiled plasmid DNA. We have developed a method that allows fluorescent labeling of a 200-bp region, as well as efficient supercoiling by Escherichia coli gyrase. Compared to plain circular or linear DNA, the submicrosecond motion within the supercoiled molecules appears faster by up to an order of magnitude. The mean-square displacement as a function of time reveals an additional intermediate regime with a lowered scaling exponent compared to that of circular DNA. Although this unexpected behavior is not fully understood, it could be explained by conformational constraints of the DNA strand within the supercoiled topology in combination with an increased apparent persistence length.
Introduction
In bacterial cells, DNA molecules are twisted around their axis, yielding a supercoiled topology (Fig. 1 a) (1). This twist is actively introduced by the gyrase enzyme (2) and leads to a build-up of torsional stress in the circular molecules and a typical intertwined geometry, as well as the formation of branches made of plectonemes. How a single site within this supercoiled topology moves around by diffusion is a nontrivial problem, which depends on various unknown parameters like effective bending stiffness and hydrodynamic coupling. At the same time, it is an issue with direct biological relevance. For instance, the expression of genes often depends on the colocalization of distant chromosomal sites (3,4). An understanding of the diffusive motion of supercoiled DNA is therefore essential for a quantitative understanding of many cellular phenomena.
Figure 1.
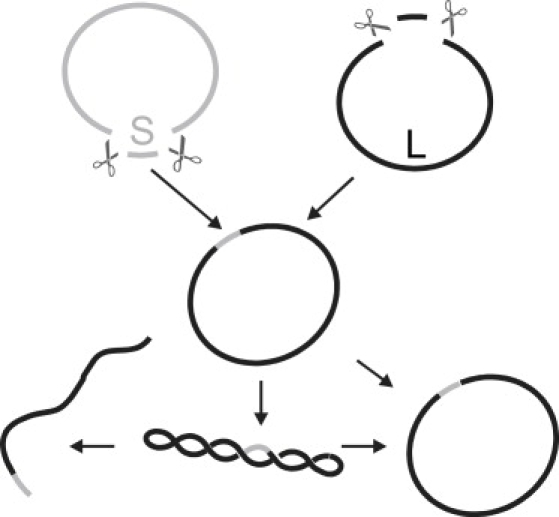
Schematic representation of the sample preparation.
The internal diffusion dynamics of linear DNA strands has been investigated theoretically (5–7), in bulk experiments (8), and most recently at the single-molecule level (9,10). In these latter experiments, the dynamic motion of the ends of DNA strands was recorded using fluorescence correlation spectroscopy (FCS) (11). In accordance with theoretical considerations, the mean-square displacement (MSD) of the DNA ends showed a deviation from the linear scaling of pure diffusion at low timescales. The first study (9) was consistent with the Rouse model for a semiflexible polymer without hydrodynamic coupling, in which the MSD follows a power law of ∼t1/2. A later study (10) found better agreement with the Zimm model, which assumes hydrodynamic coupling between molecule segments and predicts a dependence of ∼t2/3.
The analytical theory (12) of supercoiled DNA dynamics is much less developed, with most current insight coming from computer simulations (13–15). Experimental investigation has been pioneered by Langowski and co-workers, who employed the dynamic light scattering (DLS) technique (15–19). These experiments revealed rotational and translational diffusion modes, as well as an internal diffusion coefficient and relative movement amplitude (15). The FCS method is complementary, since it allows one to measure the mean-square displacement of one site and its dependence on time, and thus makes it possible to investigate subdiffusive behavior. We also mention another approach, in which the diffusion of a labeled site on a bacterial chromosome was monitored using time-lapse microscopy (20). However, the time resolution of this technique is limited to ∼0.1 s, which makes it not useful for the question of interest here.
The FCS technique cannot straightforwardly be extended from the linear to the supercoiled case, due to technical challenges in combining the attachment of fluorescent labels with efficient supercoiling of the DNA. Here, we present what we consider a novel method that allows for the construction of labeled supercoiled DNA molecules to high superhelical densities, opening up an FCS-based analysis. This method complements a recent independently developed technique that allows labeling and supercoiling to intermediate densities.
Method
Uniformly labeled, short fragments (220 bp) were cut from labeled plasmids, and then inserted into unlabeled plasmids. The resulting closed circular DNA topology was subsequently supercoiled in an in vitro reaction using Escherichia coli gyrase. To obtain the starting DNA material, plasmids pDNR-LIB (Clonetech, Mountain View, CA) of 4200 bp size are grown in E. coli cells (strain DH1αZ1), extracted, and purified (miniprep kit, Qiagen, Venlo, The Netherlands). Labeling with Alexa 546 fluophores is done by means of a platinum conjugate-based linkage system (ULYSIS, Amersham Biosciences, Fairfield, CT), resulting in a labeling density of ∼1 dye molecule/20 bp. The following steps are depicted schematically in Fig. 1. Labeled and unlabeled plasmid samples are both digested with restriction enzyme BglI (New England Biolabs, Ipswich, MA), leading to a small fragment (S) of ∼220 bp and a large fragment (L) of ∼4000 bp. The fragments are separated and purified by running them on an agarose gel. Next, the labeled S and unlabeled L are religated, resulting in the original plasmid with a fluorescently labeled stretch of ∼220 bp. The concentration of labeled S was around threefold that of L in the religation reaction. BglI creates two noncomplementary, nonpalindromic 3-bp overhangs in pDNR-LIB, thereby preventing the insertion of multiple fragments S. The labeled plasmid then is incubated with gyrase (Sigma Aldrich, St. Louis, MO) and analyzed by gel electrophoresis, revealing a supercoiling density higher than −0.04 (21). The supercoiled (SC) band is purified from this gel and can be used for the FCS measurements. To obtain open circular (OC) and linear samples from the purified SC plasmid, we used the nicking endonuclease N.Alw1 (New England Biolabs) and restriction endonuclease HindIII (New England Biolabs), cutting the plasmid open at a distance of 12 bp from the label.
We obtain the diffusion dynamics for the three different topologies using FCS. In FCS, the kinetics of a fluorescent object is measured by monitoring the fluctuations δI(t) of its emission intensity I(t) in a confocal excitation beam with a Gaussian profile. The excitation and, consequently, the emission of these fluorescent entities changes as they move in and out of the focal volume by Brownian motion. By autocorrelating the recorded intensity signal, the temporal dynamics of these fluctuations can be quantified. It is important to note that the mean-square displacement (MSD), , of a pointlike fluorescent source can be directly derived from the autocorrelation function G(t). For the case of an excitation volume formed by a Gaussian beam with intensity profile , G(t) is given by Shusterman et al. (9):
| (1) |
Here, N is the number of fluorescent entities in the focal volume, and ωxy and ωz denote the lateral and axial dimensions of this volume.
Measurements have been performed on a home-built FCS setup based on an inverted optical microscope. We used a frequency-doubled Nd:YAG laser at 532 nm (CrystaLaser, Reno, NV) focused by a 63×, 1.4 NA oil immersion objective (Nikon, Tokyo, Japan). The fluorescent light is passed through standard filter sets for Alexa 546/Cy3 and through a pinhole (diameter typically 50 μm), before it is detected by an avalanche photodiode (APD, Eg&G, Gaithersburg, MD). The APD signal is fed into a hardware correlator (ALV/5000E) where the autocorrelation function is computed. Both the diameter of the excitation beam and the pinhole size have been chosen to minimize possible artifacts like a nongaussian intensity distribution in the focus (22). Typical laser power at the sample was below 1 μW. In this regime, no effect of triplet blinking and photobleaching on the diffusion dynamics signal could be observed. Samples were dispensed into the wells of a microtiter plate with a glass bottom. The system was calibrated by collecting FCS curves of an aqueous solution of rhodamine 6G molecules before each measurement (23). To maintain the same focal point distance to the coverslip for calibration and experiment, the DNA and rhodamine 6G solution were dispensed into wells of the same microplate, requiring only a lateral shift to switch between samples. The dimensions of the focal volume were typically found to be ωxy = 390 nm and ωz = 2000 nm.
The measurements on DNA molecules have been performed in 4 mM phosphate buffer (KPO4) with 100 mM KCl as a monovalent salt. DNA concentrations were in the dilute regime, corresponding to 0.02–0.4 molecules in the confocal volume of ∼1.2 fL on average. FCS spectra have been recorded for 300–600 s typically. Three sample preparations of each topology have been investigated, and at least three FCS spectra were taken of each preparation, which showed reproducible results.
Results
First, we characterized the diffusion of the isolated fluorescence probe, the labeled segment S. The measured correlation function G(t) of S is shown in Fig. 2 a. At timescales <1 μs, the internal photodynamics of the fluophores manifests itself in an exponentially decaying process: this is the contribution of the singlet-to-triplet conversion of the dye molecules to the autocorrelation function. Since this contribution is well separated in time from the diffusive motion of the DNA monomers, we can fit an Ae−Bt + G(0) model to derive N via the y-axis intercept G(0) = 1/N in Eq. 1. In this manner, the MSD of the labeled monomer is obtained from the measurements using Eq. 1. (Fig. 2 b). The data narrowly follow the t1 scaling expected for trivial diffusion over a time span of five decades, thus obeying a point-source behavior. These results are consistent with expectations, since the probe length of 65 nm (220 bp) is similar to the persistence length of dsDNA (50 nm) and it can thus be considered stiff without significant internal dynamics. The strict t1 scaling also shows that having multiple fluophores on the probe is not a limitation. When attached to the larger DNA constructs, deviations from the t1 behavior can thus be attributed to their internal dynamics. Using , we obtain a diffusion constant of for the fragment S.
Figure 2.
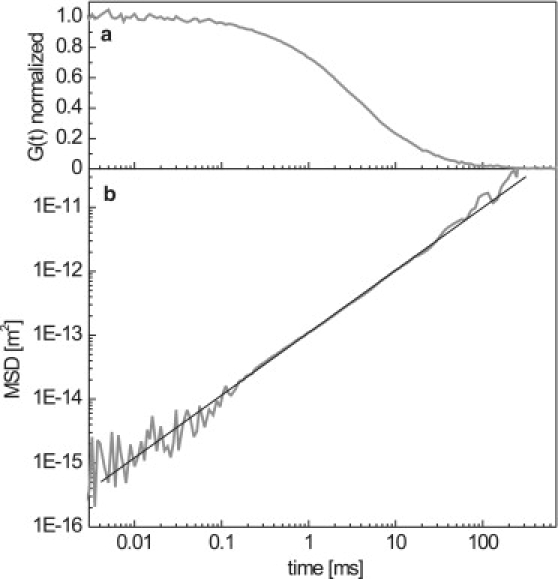
(a) Normalized correlation function, G(t), of the isolated labeled fragment S. (b) Mean-square displacement of the labeled fragment S. The data follows a power law t1 (solid line), indicating a point-source diffusive behavior.
Next, we investigate the dynamics of the 4200-bp linear DNA molecule with the labeled fragment S situated at its end (Fig. 3). For timescales >1 ms, the MSD is linear in time, reflecting the overall diffusion of the DNA molecule. Fitting the data in this regime yields a diffusion constant of . For times <1 ms, the kinetics deviates from this t1 trend, showing subdiffusive behavior. The fitting of our data in this regime results in . The scaling thus lies between the earlier observed t0.5 (9) and t0.66 (10), which represent, respectively, weak (Rouse model) and strong (Zimm model) hydrodynamic coupling between the DNA monomers. Indeed, it has been argued theoretically (24–26) that the two models represent limiting cases.
Figure 3.
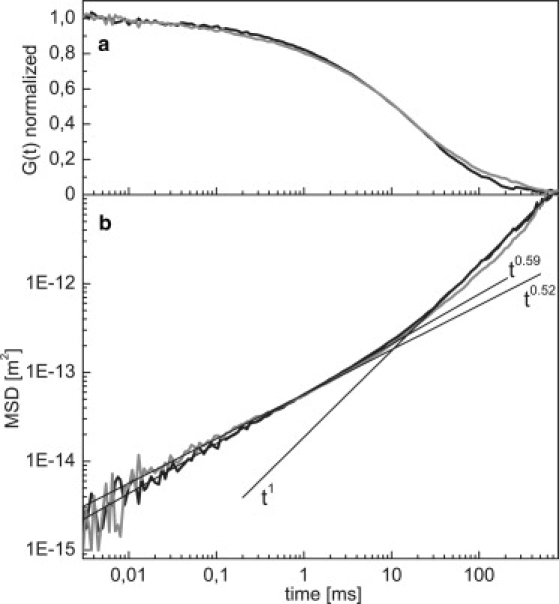
(a) Normalized correlation functions, G(t), of linear DNA (black) and open circular plasmid DNA (gray). (b) Mean-square displacement of the data in a for linear DNA (black) and open circular DNA (gray). Straight lines indicate fits to the different regimes for linear DNA data for times >50 ms, MSD ∼t1, and for linear and open circular DNA data at times <1 ms: MSD t0.59 ± 0.065 and t0.52 ± 0.05, respectively.
The data for the OC and SC plasmids is shown in Figs. 3 and 4. First, we note that both the SC and the OC plasmid also show trivial diffusion, , for the molecule as a whole above 10 ms. In this regime, the OC and linear data overlap, whereas the SC curve is higher, as the SC molecule is more compact and therefore shows a faster diffusive motion. We find a diffusion constant of , i.e., a factor of 1.7 higher than Dlin. This value is somewhat larger than the reported ratio of 1.35, as determined by sedimentation studies (27), though it does agree with results obtained by single-molecule tracking experiments (28). We find a similar diffusion constant for the OC and linear DNA, which is unexpected given the smaller hydrodynamic radius of the circular topology. Note that these discrepancies in diffusion constant may be partly attributed to a reduced accuracy of the FCS technique at the largest timescales. Below 5 ms, the linear and OC data show a similar behavior, with a slightly higher MSD and a lower scaling exponent for the OC curve .
Figure 4.
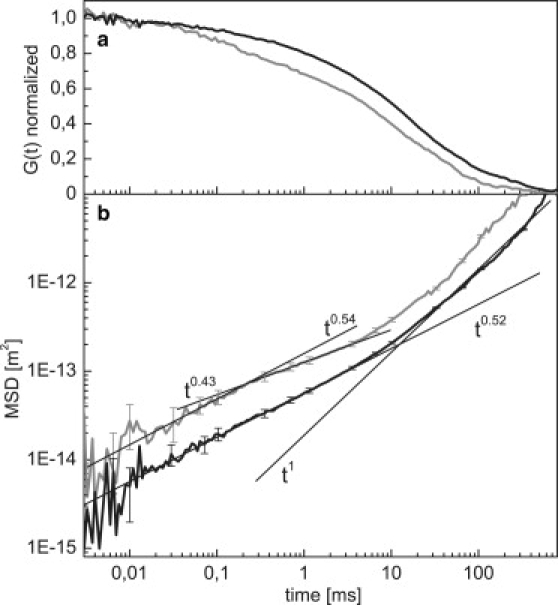
(a) Normalized correlation functions, G(t), of open circular DNA (black, upper curve) and supercoiled plasmid DNA (gray, lower curve). (b) Mean-square displacement of the data in a. Straight lines indicate fits to the different regimes. Fits to the OC data are as in Fig. 3b. The data for SC DNA is fit in the regime below 0.2 ms (t0.54 ± 0.06) and in the intermediate regime between 0.3 ms and 3 ms (t0.43 ± 0.05).
The short-time behavior of the SC DNA segment displays various counterintuitive features. Given the increased constraints on the polymer conformation in the supercoiled topology, one may expect a decreased intramolecular mobility. However, we instead observe a significantly increased mobility compared to a linear or circular DNA segment. At 100 μs we find the MSD magnitude to be around three times higher for the supercoiled case, reducing the time required to achieve a certain displacement by an order of magnitude. This acceleration, which has also been reported in a recent independent study for lower supercoiling densities (29), cannot straightforwardly be explained with existing analytical models or simulations. One possibility is that the bond-angle correlations of the DNA strands increase due to constraints in the supercoiled topology, resulting in an increased apparent persistence length. The observed increase of the MSD by a factor of 3 would result in an increase of the apparent persistence length to 120 nm, since the MSD should be roughly proportional to the persistence length (7).
We note that the observed anomalous diffusion cannot be explained by molecules passing in different orientations, as has been theorized (29). One may also consider possible dynamic quenching behavior of the fluorescent dyes due to nearby bases resulting from the supercoiling. However, the opposing strands in the supercoiled geometry are expected not to touch because of electrostatic repulsion (30). Quenching fluctuations are also not seen in the control measurements of the labeled segment alone, would be at much faster timescales due to the small distances involved, and are therefore not expected to be the cause of the observed deviations.
Supercoiled DNA displays two subdiffusive regimes (Fig. 4) rather than the single one seen for linear and OC DNA. In the first regime, up to 0.2 ms, the data roughly parallel the MSD of the OC DNA, with a scaling of ∼t0.54 ± 0.05. Between 0.2 and 10 ms, the MSD bends to an even lower scaling of ∼t0.43 ± 0.04, before the curve follows the expected trivial diffusion of the molecule as a whole at >10 ms. To explore possible explanations for the observed behavior, we first consider the scaling of a free semiflexible chain. Below the persistence length, the MSD is expected to scale with t0.75 (31). Above the persistence length, the behavior is like that of a flexible chain, with the MSD scaling exponent dropping to between t0.5 and t0.66. Note that the latter regime would only be visible for chain lengths significantly larger than the effective persistence length in the supercoiled state. Otherwise, the t0.75 scaling immediately crosses over to the free diffusion behavior.
In addition, the scaling could be affected by the intertwined topology acting as an effective cylindrical confinement, in analogy to the tube model (32) of a molecule in a polymer melt, where a chain segment is considered to be confined in a narrow tube formed by the other polymers. Simulations and theory (24,33) have shown that for such a confinement, the MSD exhibits three different regimes. For short displacements, the chain is not hindered by the confinement and behaves as if it is free. When reaching the diameter of the cylindrical confinement, the chain movements become constrained, which results in a decrease of the MSD scaling exponent. At large timescales, the scaling of the entire polymer diffusion is followed.
The linking number difference, ΔLk, allows us to estimate the length scale of the constraint in the supercoiled topology. ΔLk corresponds to the number of DNA crossings in a planar projection, which are separated by an average distance Lx. For our plasmid with its high supercoiling density, Lx = 30–35 nm, which is smaller than the persistence length of linear DNA. This makes the transition from unconstrained to constrained not visible here. One therefore would only see the crossover from stiff to flexible behavior in this scenario. Indeed, the bending of the MSD curve at 240 nm is consistent with this transition, given the increased apparent persistence length due to supercoiling. The cylindrical confinement acts in both regimes, and has the effect of lowering the scaling exponents (from the expected t0.75 to t0.54, and from t0.66 or t0.5 to t0.43). Note that for plasmids with lower supercoiling densities, the supercoiling-induced confinement should appear at higher lengths, so that the pure t0.75 scaling may become visible.
Discussion
We have presented measurements of the dynamics of a single site in isolated DNA molecules of fully supercoiled topology, and compared it with the dynamics in open circular and linear topologies. To achieve this, we developed a method for constructing supercoiled DNA plasmids with a fluorescently labeled segment in vitro. We performed FCS measurements to determine the diffusive kinetics of this labeled site in different topologies. The central finding is that fully supercoiled DNA appears to exhibit a significantly faster internal dynamics compared to linear or circular DNA. These results complement and verify a recent independent study that has found a similar acceleration for plasmid DNA with intermediate supercoiling densities (29). Although we have put forward possible mechanisms, further theoretical and computational studies are essential to provide a full explanation.
The observed acceleration upon supercoiling has direct implications for the colocalization of two DNA sites and, consequently, for gene regulation. By how much colocalization times are reduced will also depend on other factors, such as the distance between the sites, and the exact conformational changes during diffusion. This issue can be addressed directly, by extending the current method to engineer two fluorescently labeled sites of different color within each plasmid, in combination with the fluorescence resonance energy transfer technique. In addition, the technique presented here can be used to investigate the changes in rapid internal dynamics as induced by various DNA-binding proteins, such as HNS or SMC, but also by RNA polymerase as it actively induces conformational changes in the supercoiled DNA.
Acknowledgments
We thank G. Isijk for technical assistance. A.A. acknowledges support from the Marie-Curie program under the European Community's Sixth framework program.
This work was funded by the European Community Biomach program, and the Organization for Fundamental Research on Matter (FOM), which is financially supported by the Netherlands Organization for Scientific Research (NWO).
References
- 1.Anderson P., Bauer W. Supercoiling in closed circular DNA: dependence upon ion type and concentration. Biochemistry. 1978;17:594–601. doi: 10.1021/bi00597a006. [DOI] [PubMed] [Google Scholar]
- 2.Gellert M., Mizuuchi K., Dea M.H.O., Nash H.A. DNA gyrase: an enzyme that introduces superhelical turns into DNA. Proc. Natl. Acad. Sci. USA. 1976;73:3872. doi: 10.1073/pnas.73.11.3872. [DOI] [PMC free article] [PubMed] [Google Scholar]
- 3.Rippe K., von Hippel P.H., Langowski J. Action at a distance: DNA-looping and initiation of transcription. Trends Biochem. Sci. 1995;20:500–506. doi: 10.1016/s0968-0004(00)89117-3. [DOI] [PubMed] [Google Scholar]
- 4.Halford S.E., Welsh A.J., Sczcelkun M.D. Hydrogen bonding, base stacking, and steric effects in DNA replication. Annu. Rev. Biophys. Biomol. Struct. 2004;33:1–22. doi: 10.1146/annurev.biophys.30.1.1. [DOI] [PubMed] [Google Scholar]
- 5.Rouse P.E.J. A theory of the linear viscoelastic properties of dilute solutions of coiling polymers. J. Chem. Phys. 1953;21:1272–1280. [Google Scholar]
- 6.Zimm B.H. Dynamics of polymer molecules in dilute solution: viscoelasticity, flow birefringence and dielectric loss. J. Chem. Phys. 1956;24:269–278. [Google Scholar]
- 7.Doi M., Edwards S.F. Clarendon Press; Oxford, United Kingdom: 1986. The Theory of Polymer Dynamics. [Google Scholar]
- 8.Bern B.J., Pecora R. Wiley; New York: 1976. Dynamic Light Scattering. [Google Scholar]
- 9.Shusterman R., Alon S., Gavrinyov T., Krichevsky O. Monomer dynamics in double- and single-stranded DNA polymers. Phys. Rev. Lett. 2003;92:048303. doi: 10.1103/PhysRevLett.92.048303. [DOI] [PubMed] [Google Scholar]
- 10.Petrov E., Ohrt T., Winkler R., Schwille P. Diffusion and segmental dynamics of double-stranded DNA. Phys. Rev. Lett. 2006;97:258101. doi: 10.1103/PhysRevLett.97.258101. [DOI] [PubMed] [Google Scholar]
- 11.Madge D., Elson E., Webb W. Thermodynamic fluctuations in a reacting system—measurement by fluorescence correlation spectroscopy. Phys. Rev. Lett. 1972;29:705–708. [Google Scholar]
- 12.Marko J.F., Siggia E.D. Fluctuations and supercoiling of DNA. Science. 1994;265:506–508. doi: 10.1126/science.8036491. [DOI] [PubMed] [Google Scholar]
- 13.Huang J., Schlick T., Vologodskii A. Dynamics of site juxtaposition in supercoiled DNA. Proc. Natl. Acad. Sci. USA. 2001;98:968–973. doi: 10.1073/pnas.98.3.968. [DOI] [PMC free article] [PubMed] [Google Scholar]
- 14.Chirico G., Langowski J. Kinetics of DNA supercoiling studied by Brownian dynamics simulation. Biopolymers. 1994;34:415–433. [Google Scholar]
- 15.Langovski J., Kapp U., Klenin K., Vologodskii A. Solution structure and dynamics of DNA topoisomers: Dynamic light scattering studies and Monte Carlo simulations. Biopolymers. 1994;34:639–646. [Google Scholar]
- 16.Langowski J., Giesen U. Configurational and dynamic properties of different length superhelical DNAs measured by dynamic light scattering. Biophys. Chem. 1989;34:9–18. doi: 10.1016/0301-4622(89)80036-5. [DOI] [PubMed] [Google Scholar]
- 17.Kremer W., Klenin K., Diekmann S., Langowski J. DNA curvature influences the internal motions of supercoiled DNA. EMBO J. 1993;12:4407–4412. doi: 10.1002/j.1460-2075.1993.tb06125.x. [DOI] [PMC free article] [PubMed] [Google Scholar]
- 18.Gebe J.A., Delrow J.J., Heath P.J., Fujimoto B.S., Stewart D.W. Effects of Na+ and Mg2+ on the structures of supercoiled DNAs: comparison of simulations with experiments. J. Mol. Biol. 1996;262:105–128. doi: 10.1006/jmbi.1996.0502. [DOI] [PubMed] [Google Scholar]
- 19.Hammerman M., Steinmaier C., Merlitz H., Kapp U., Waldeck W. Salt effects on the structure and internal dynamics of superhelical DNAs studied by light scattering and Brownian dynamics. Biophys. J. 1997;73:2674–2687. doi: 10.1016/S0006-3495(97)78296-1. [DOI] [PMC free article] [PubMed] [Google Scholar]
- 20.Elmore S., Muller M., Vischer N., Odijk T., Woldringh C.L. Single-particle tracking of oriC-GFP fluorescent spots during chromosome segregation in Escherichia coli. J. Struct. Biol. 2005;151:275–287. doi: 10.1016/j.jsb.2005.06.004. [DOI] [PubMed] [Google Scholar]
- 21.Keller W. Determination of the number of superhelical turns in simian virus 40 DNA by gel electrophoresis. Proc. Natl. Acad. Sci. USA. 1975;72:4876–4880. doi: 10.1073/pnas.72.12.4876. [DOI] [PMC free article] [PubMed] [Google Scholar]
- 22.Hess S.T., Webb W.W. Focal volume optics and experimental artifacts in confocal fluorescence correlation spectroscopy. Biophys. J. 2002;83:2300–2317. doi: 10.1016/S0006-3495(02)73990-8. [DOI] [PMC free article] [PubMed] [Google Scholar]
- 23.Rigler R., Mets U., Widengren J., Kask P. Fluorescence correlation spectroscopy with high count rate and low background:analysis of translational diffusion. Eur. Biophys. J. 1993;22:169–175. [Google Scholar]
- 24.Kremer K., Binder K. Dynamics of polymer chains confined into tubes: scaling theory and Monte Carlo simulations. J. Chem. Phys. 1984;81:6381–6394. [Google Scholar]
- 25.Thotova J., Brutovsky B., Lisy V. Single monomer dynamics in DNA polymers. Czech. J. Phys. 2005;55:221–227. [Google Scholar]
- 26.Winkler R.G. Deformation of semiflexible chains. J. Chem. Phys. 2003;118:2919. [Google Scholar]
- 27.Upholt W.B., Gray H.B., Vinograd J. Sedimentation velocity behavior of closed circular SV40 DNA as a function of superhelix density, ionic strength, counterion and temperature. J. Mol. Biol. 1971;61:21–38. doi: 10.1016/0022-2836(71)90128-8. [DOI] [PubMed] [Google Scholar]
- 28.Robertson R.M., Laib S., Smith D.E. Diffusion of isolated DNA molecules: dependence on length and topology. Proc. Natl. Acad. Sci. USA. 2006;103:7310–7314. doi: 10.1073/pnas.0601903103. [DOI] [PMC free article] [PubMed] [Google Scholar]
- 29.Shusterman R., Gavrinyov T., Krichevsky O. Internal dynamics of superhelical DNA. Phys. Rev. Lett. 2007;100:098102. doi: 10.1103/PhysRevLett.100.098102. [DOI] [PubMed] [Google Scholar]
- 30.Ubbink J., Odijk T. Electrostatic-undulatory theory of plectonemically supercoiled DNA. Biophys. J. 1999;76:2502–2519. doi: 10.1016/S0006-3495(99)77405-9. [DOI] [PMC free article] [PubMed] [Google Scholar]
- 31.Kroy K., Frey E. Dynamic scattering from solutions of semiflexible polymers. Phys. Rev. E. 1997;55:3092–3101. [Google Scholar]
- 32.de Gennes P. Cornell University Press; Ithaca, NY: 1979. Scaling Concepts in Polymer Physics. [Google Scholar]
- 33.Kalb, J., and B. Chakraborty. 2007. Single polymer confinement in a slit: correlation between structure and dynamics. http://www.arxiv.org, arXiv:cond-mat/0702152v1. [DOI] [PubMed]