

Abstract
The transduction of signals depends on the translocation of signaling molecules to specific targets. Undirected diffusion processes play a key role in the bridging of spaces between different cellular compartments. The diffusion of the molecules is, in turn, governed by the intracellular architecture. Molecular crowding and the cytoskeleton decrease macroscopic diffusion. This article shows the use of a stochastic simulation method to study the effects of the cytoskeleton structure on the mobility of macromolecules. Brownian dynamics and single particle tracking were used to simulate the diffusion process of individual molecules through a model cytoskeleton. The resulting average effective diffusion is in line with data obtained in the in vitro and in vivo experiments. It shows that the cytoskeleton structure strongly influences the diffusion of macromolecules. The simulation method used also allows the inclusion of reactions in order to model complete signaling pathways in their spatio-temporal dynamics, taking into account the effects of the cellular architecture.
Introduction
The cellular response to external signals depends on the signal transduction from the plasma membrane to the respective targets of the signal. The biochemical pathway for the signal transduction process is known for many signals, e.g., epidermal growth factor (1). While biochemical reactions affect the number of the molecules carrying the signal, transport processes are needed to deliver these molecules to their targets on various locations in the cell, mostly the nucleus where they trigger the expression of certain genes. Some signaling cascades involve the active transportation of signaling molecules along the cytoskeleton by motor proteins (2). However, in many cases the translocation of the signaling molecules depends on undirected diffusion in the cell (3).
To model signal transduction realistically, the stochasticity caused by low particle numbers should be incorporated (4–6). In addition, the spatial aspects must be taken into account (7–11). These include the microscopic and heterogeneous cellular architecture as well as molecular crowding (12,13). Besides the existence of spatial restrictions, the mobility of signaling molecules can further decrease as a result of unspecific and transient binding to the cytoskeleton (14). Computer simulations enable a separate and combined analysis of the different effects in silico. This article focuses solely on the spatial aspects and investigates the influence of molecule size as well as differences in the architecture of the cytoskeleton network on the diffusion of inert tracer molecules. By adjusting cytoskeleton parameters so that the diffusion results fit to measured data, one may also derive additional information about the (cytoskeleton) structures in cells.
Blum et al. (15) were the first to calculate the effect of the cytoskeleton on diffusion. However, an analytical solution for the diffusion in a cytoskeleton structure was only possible in a regular lattice structure. Monte Carlo simulations on the particle level facilitate geometries that are more realistic. A particle-based model to analyze diffusion due to forbidden spaces in the cell was first used by Ölveczky and Verkman (16) and later in the software environment of Smoldyn, but only using plates or cubes as fixed obstacles (17). MCell, another simulation environment, allows complex compartment geometries but does not include a cytoskeleton (18). Pogson et al. (19) included binding to actin structures but did not explore the effect on diffusion. The stochastic simulation framework presented here tackles the diffusion problem based on a realistic model for the cytoskeleton (see Fig. 1). In this framework, binding to the cytoskeleton and reactions can be included as well to build a realistic signal transduction simulation (20). In addition, all structures and molecules of the simulation can be visualized to provide a three-dimensional impression of the intracellular processes (21).
Figure 1.

Model cytoskeleton with 5% volume fraction, and a fiber diameter of 25 nm (microtubules). The tracer molecules (white) are 10 nm in diameter.
The diffusion of molecules in the cell is experimentally determined using fluorescence recovery after photobleaching or fluorescence correlation spectroscopy (FCS) methods (22–25). Overall, a size-dependent hindrance of diffusion was observed. In addition, the measurements not only revealed the reduced diffusion but also subdiffusion. In this case, the diffusion coefficient changes over time due to spatial heterogeneity. Subdiffusion depends on the level of crowding (26,27). Diffusion, and to a greater extent, subdiffusion, can limit biochemical reaction rates (28) and thus, affect the dynamics of signal transduction (29).
The hindrance in diffusion depends on various parameters such as cytoskeleton volume fraction, filament alignment, or particle size. Empirical formulas can describe some dependencies (30–32), but are unable to relate the phenomenon to physical explanations. On the other hand, the complex physical interactions and architecture lead to complex mathematical models that often need simplifications in critical points (33,34). This article aims to connect relevant parameters of the cytoskeleton architecture to the hindrance in diffusion. The approach is based on the convincing fact that a test molecule cannot move through an obstacle.
The difficulty for a rigorous analysis of the process of hindered diffusion in the cellular environment begins with the appropriate representation of the manifold obstacles. The cytoplasm is not a homogeneous solution but highly crowded with proteins. Up to 30% of the cellular volume is occupied by macromolecules (12). Some of these molecules are arranged in the cytoskeleton structures: Microtubules (diameter ≈ 25 nm), intermediate filaments (10 nm), and actin filaments (7 nm) form a complex network (35). Considering the diffusion of macromolecules, this network leads to a sieving effect. Larger molecules are hindered in their diffusion to a greater extent, and eventually a caging effect restricts the movement of large objects (e.g., vesicles) to pores of the cytoskeleton or subcompartments in the cell. The cytoskeleton can be disassembled using specific chemical agents to measure the effects of the different fiber types separately. Luby-Phelps (23) found that intermediate filaments had the strongest effect on diffusion. Potma et al. (36) estimated that the effect of the actin filament network in Dictyostelium cells accounted for 53% of the hindrance in diffusion. Dauty and Verkman (37) reported that actin led to a size-dependent hindrance of DNA diffusion. These findings suggest that the cytoskeleton is the primary physical barrier that hinders the diffusion of macromolecules.
The cytoskeleton, in a first approach, can be seen as a rigid network comparable to porous media. Averaging over the microscopic structure leads to macroscopic properties from which the hindrance on diffusion can be calculated by volume averaging (38). Going more into details, this hindrance not only depends on the properties of the obstacles, e.g., the pore size, but also on the size and conformation of the diffusing macromolecule (39). While rigid bodies cannot adjust their shape, chainlike polymers such as DNA or RNA can wriggle and squeeze themselves through small pores of the network (40).
The volume fraction of the microtrabecular lattice, a definition that extends the cytoskeleton by all kinds of proteins bound to it (41), was measured in PTK cells analyzing high voltage electron micrograph images and reported to be between 15 and 21% (42). This is much larger than the volume fraction of the cytoskeleton building blocks, which accounts only for ∼3% (23). Hou et al. (43) estimate a necessary volume fraction of an actin cytoskeleton of 11% in order to match diffusion data in artificial F-actin solutions with in vivo data. It can be assumed that proteins that are transiently or permanently bound to the cytoskeleton are the reason for this increased apparent skeleton volume. The correlation of protein interactions on the scale of the entire proteome reveals a connection between signaling and cytoskeleton proteins (44). This correlation might be due to the organization of signaling proteins in scaffolds attached to the membrane or the cytoskeleton to improve the signaling cascade by enzyme channeling (29). Furthermore, active transport with motor proteins along the cytoskeleton could improve first passage times compared to free diffusion (45), especially for large objects like vesicles but also RNA or proteins (2). The important effects of motorized transport and channeling through scaffolds are not included in this study, but will be analyzed in detail in the future.
In addition to the fixed structure of the cytoskeleton, the cytoplasm is crowded with unbound macromolecules. These crowding objects reduce the volume available for all other molecules, and therefore influence protein folding, reactions, and diffusion (46,47). Their mobility and immense number increases the computational effort. Currently different groups are developing methods toward realistic modeling of the complex interactions introduced by macromolecular crowding, e.g., Sun and Weinstein (48) and Ridgway et al. (49).
Simulation method and hindered diffusion
Diffusion is the macroscopic outcome of the stochastic Brownian motion of individual molecules. For normal diffusion, the mean value of the squared individual distances increases linearly with time t,
| (1) |
where d is the dimension of .
Brownian motion of molecules translates to a Wiener process in the mathematical description, and can be simulated as a random walk. In this simulation, a discrete time with fixed time step Δt and continuous space was used. The desired number of particles is placed on initial positions. The positions were subsequently updated in every time step with a random step depending on the diffusion coefficient D according to
| (2) |
The stochastic force behind Brownian motion is translated into the Gaussian random vector with mean and (50). The central limit theorem allows the use of other distributions of random numbers; the repeated application of the random step leads to a fast convolution into a normal distribution. Simpler distributions can thus be used, but the advantages (computationally simpler and thus faster) have to be critically weighed against the disadvantages (reduced accuracy at short times).
For every test molecule, the target position of each random walk step was compared with the cytoskeleton locations, and sterically prohibited positions were rejected. In principle, there are three different models of how to handle a collision:
Method 1. The detailed ballistic reflection, at the exact point where the trajectory intersects with the cytoskeleton, can be calculated.
Method 2. If the new position is prohibited, a different random step will be calculated instead, until a valid new position is found.
Method 3. The easiest method is to stay at the previous, valid position and to wait for the next timestep.
Comparisons of these three methods show that they give the same results for the effective diffusion (data not shown). A molecule in the first and second model will definitely move in the timestep, while molecules of the last model might stay at the old position. Nevertheless, the random nature of the movement often cancels out the previous step; after several steps, the displacement in all models will again be similar. Only in extreme cases, i.e., high levels of crowding or large molecules (ɛ > 0.8), are the methods expected to give slightly different results. In such cases, the diffusion in the second model is faster compared to the last model where molecules can hardly move. With respect to the computational effort, the easiest method still can be used when modeling signal transduction under realistic conditions because the signaling molecules are usually not that large. In this study the second method was used, but restricted to, at maximum, 10 repetitions to find a valid new position.
The cytoskeleton itself was modeled as a set of randomly arranged, overlapping cylinders, whose number, length, and diameter could be adjusted (see Fig. 1). This cytoskeleton model was quite similar to the cytoskeleton structures observed by Medalia et al. (51) with electron tomography. The parameters used in our simulations are listed in the Supporting Material. The cytoskeleton volume was calculated using a Monte Carlo method: test points were placed at random positions, and the fraction of trials inside the cytoskeleton equaled the cytoskeleton volume fraction. The excluded volume fraction ɛ was calculated accordingly using test spheres with the respective radius. The free volume fraction ϕ was accordingly (ϕ = 1 – ɛ). To avoid boundary effects, the test volume for the hindered diffusion measurements was a cube inside the cytoskeleton model structure. This cubic test volume was repeated in all directions to allow unlimited movement of the tracer molecules (periodic boundary conditions). Δt was maximized according to Eq. 2, with respect to the condition max(Δx) < rcytoskeleton + rtracer, so that the tracer particles could not jump through the obstacles (note: the method used does not validate the path itself, it only validated the final position of a step). It is also worth noting that in method 3, where no repeated steps to find a valid position were allowed, max(Δx) should be smaller than the mean free path to prevent the particles from mostly jumping into obstacles and subsequently to stop moving. A uniform distribution is used for the random walk step since it has no tails and therefore allows larger steps than a normal distribution.
The effective diffusion was calculated according to Eq. 1:
In this framework, it is not even necessary to know the exact D0. According to Eq. 2, also depends on D0. The resulting Deff/D0 solely states the relative slowdown.
In the case of transient anomalous diffusion, the linear relationship of Eq. 1 does not hold; 〈x(t)2〉 increases nonlinear, proportional to tα, but α converges to 1 (see Fig. 2). The value for Deff/D0 was evaluated after convergence to normal diffusion, which was reached in all simulations. Simulations were stopped as soon as the fastest particle had traveled more than three times through the periodic test volume (i.e., , where L was at least 0.5 μm). Pretests proved that this was sufficiently long to average out the spatial inhomogeneities and to reach the normal diffusion regime. Simulations were alternatively stopped when Deff(t)/D0 fell below 1 × 10⁻⁶, which indicated that all particles were trapped. It was not possible to define a stopping criterion based on the slope of 〈x(t)2〉 due to the noisy temporal development. The quantity 〈x(t)2〉 and therefore Deff/D0 revealed stochastic noise in relation to the number of tracers. To eliminate the noise in the results of this article, we used the average of five independent runs with 20,000 particles each.
Figure 2.

A nonlinear time dependence of 〈x(t)2〉 leads to a time-dependent D/D0(t).
Molecular crowding by other macromolecules which themselves are moving and diffusing was not included in this simulation. To our knowledge, there is no experimental data available expressing only the cytoskeleton in its in vivo structure without molecular crowding. To compare the simulation data with measured in vivo tracer diffusion (including both cytoskeleton and crowding), the effect of crowding had to be added to these data. This was achieved by multiplying the relative effective diffusion coefficients:
| (3) |
This holds as long as the effect of the cytoskeleton on the crowding molecules only marginally impacts the crowding molecules' effect on the tracer molecules (i.e., the two effects can be decoupled). Experimental results show that this multiplication is possible for the combination of separate cytoskeleton and molecular crowding effects (43).
Since the unbound crowding molecules are not located in a fixed structure, we assume an average and spatially homogeneous effect on the diffusion of the tracer particles—like an increased effective viscosity of the cytosol ηcytosol compared to water with η0. According to the Stokes-Einstein relation, the effective diffusion is reduced to Deff/D0 = η0/ηcytosol. Hou et al. (43) found a nearly radius-independent effective diffusion through Ficoll-crowded solutions with Deff/D0 = 0.37 for the highest crowding values. This value corresponds to a viscosity of ∼2.7 cP, which is comparable with the cytosolic viscosity (23).
The empiric formula Deffcrowding/D0 = exp(−0.035 × 1240.64 × rtracer0.16) to include molecular crowding was also used as comparison. The parameters are estimated to match experimental data from Swiss 3T3 fibroblasts and a model setup by Luby-Phelps and Weisiger (52).
Results
Simulation versus theory
It is known from the theory of porous media that the relative effective diffusion Deff/D0 is related to the free volume fraction ϕ. Maxwell's approach for conduction through heterogeneous media (53) can also be applied to hindered diffusion (54):
| (4) |
Weissberg (54) calculated a more detailed upper limit for the value of Deff/D0 in the case of overlapping spheres:
| (5) |
This diffusion in the fluid phase (with volume fraction ϕ) has to be modified to account for the diffusion in the total volume of the porous media. The so-called volume averaging transforms Deff/D0 to ϕ × Deff/D0 (38) and allows the comparison of simulations on the level of the porous system with the theoretical values.
Simulations of a cytoskeleton setup by spheres in a simple cubic lattice were in good accordance with Maxwell's (Eq. 4) and Weissberg's (Eq. 5) theoretical predictions, especially with regard to small occupied volume fractions. The deviations obtained were similar to those obtained in other Monte Carlo simulations (55) (see Fig. 3). For all cytoskeleton models tested here, the effective diffusion decreased far more than for ordered spheres. Nevertheless the difference between simulation and theory was smaller than that observed in simulations performed by Trinh et al. (55) for random media. This shows that the hindrance in diffusion depends on the setup and shape of the obstacles. The random architecture also led to a percolation threshold at low free volume fractions. Beyond this value, the tracer molecules were caged in the cytoskeleton structure.
Figure 3.
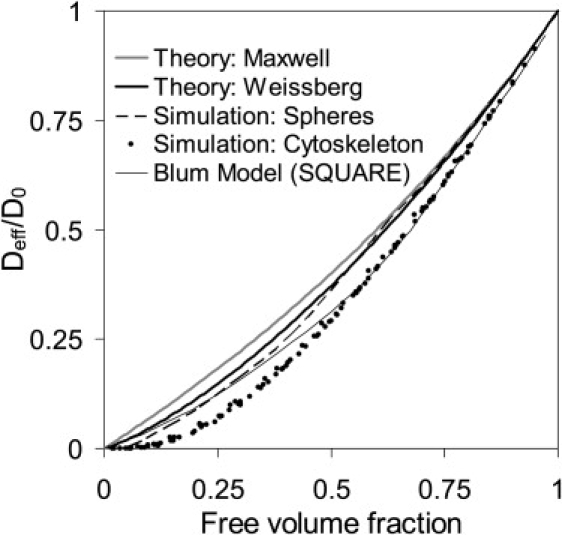
Comparison of theoretical predictions with simulated data (spheres in a simple cubic lattice, a simple cytoskeleton structure (15), and a model cytoskeleton of random cylinders in various architectures and different tracer radii). Note that the simulation results are multiplied by the free volume fraction to be comparable with the theoretical results (volume averaging).
For comparison, we include the result obtained by Blum et al. (15), which is based on a regular grid cytoskeleton and square geometry. This result could be reproduced with our simulation method when we apply the same cytoskeleton structure (data not shown). In this model, different results were obtained for large tracers because the square network was not able to trap particles; Deff/D0 is always nonzero. It is also possible to construct symmetric networks that always will trap large particles. In contrast, a random structure exhibits spatial inhomogeneity: some parts allow diffusion, while others already form a cage around the tracer molecules.
Ogston et al. (30) derived an exponential dependency of Deff/D0 on the tracer radius in a solution of polymer chains. However, the present simulations (see Figs. 4 and 5) and data obtained by Blum et al. (15) as well as experiments in agarose gels (56) showed a curvature that cannot be explained by a single exponential function. We therefore suggest that the formula does not represent the complete interaction between the entangled network of crowding objects and the tracer particles.
Figure 4.
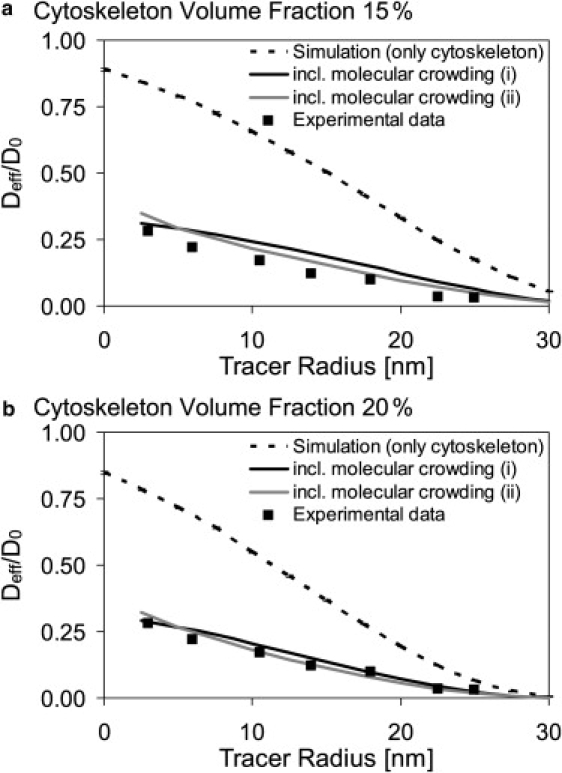
Comparison of simulated and experimental data from Luby-Phelps and Weisiger (52): (a and b) Cytoskeleton volume fraction = 15% and 20%, respectively. The simulation data were multiplied by literature values, to take into account molecular crowding ((i): Deff/D0 = 0.37 (43), and (ii): Deffcrowding/D0 = exp(−0.035 × 1240.64 × rtracer0.16) (52).
Figure 5.
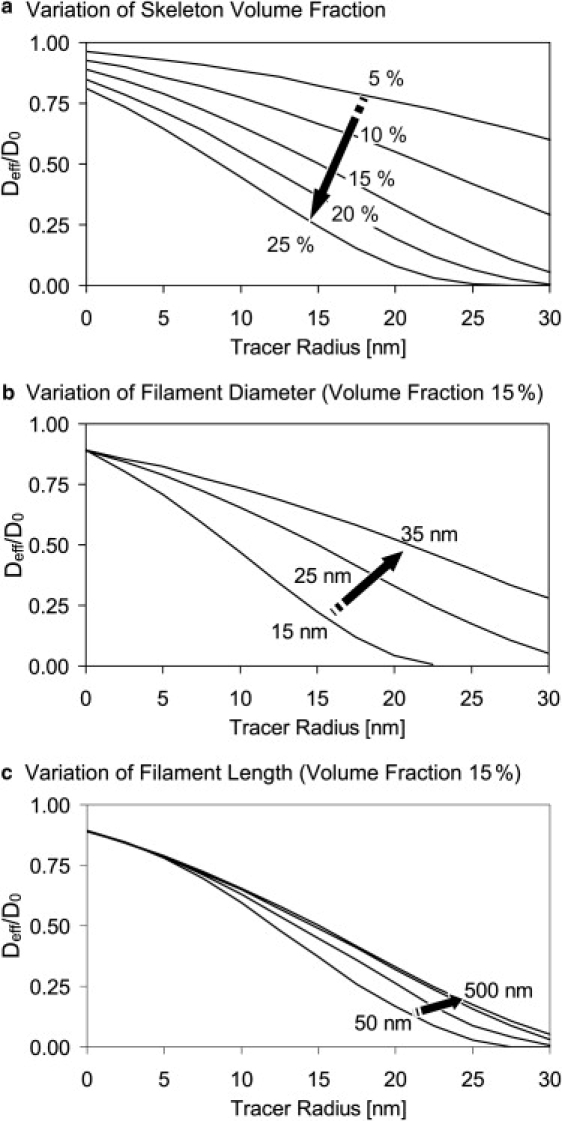
Variation of the cytoskeleton parameters: (a) rf = 12.5 nm; Lf = 500 nm; volume fraction = 5, 10, 15, 20, and 25%. (b) Volume fraction = 15%; Lf = 500 nm; rf = 7.5, 12.5, and 17.5 nm. (c) Volume fraction = 15%; rf = 12.5 nm; and Lf = 50, 100, 200, and 500 nm.
Simulation versus experiment
To compare the simulation with the measured in vivo data, the volume fraction of the model cytoskeleton was adjusted to 15% and then to 20% to match the intracellular conditions reported by Gershon et al. (42). The model cytoskeleton was constructed of randomly arranged cylinders representing microtubules, 25 nm in diameter and 500 nm in length. Molecular crowding was included according to Eq. 3. The simulation result Deffskeleton/D0 was multiplied with the constant Deffcrowding/D0 = 0.37 (43) and for comparison with the exponential Deffcrowding/D0 = exp(−0.035 × 1240.64 × rtracer0.16) (52). Fig. 4 shows that, independent of the method used to include molecular crowding, the model cytoskeleton occupying 20% of the volume is most congruent with the experimental data obtained by Luby-Phelps and Weisiger (52).
Parameter study: volume fraction, fiber radius, and fiber length
In the simulation, it was possible to separately adjust the volume fraction occupied by the cytoskeleton fibers as well as their size and number. An increase of the volume fraction led to a reduced diffusion (Fig. 5 a). Smaller fiber diameter and hence a smaller single filament volume fraction required a higher number of filaments to reproduce the same cytoskeleton volume fraction. This led to a reduction in the mesh size of the filament network and thus decreased the diffusion of larger molecules (Fig. 5 b).
To obtain a particular fiber volume fraction, the necessary number of fibers Nfiber increases proportional to rfiber−2. For each fiber and a given tracer particle, the excluded volume grows proportional to (rfiber + rtracer)2. For large tracer particles this term is dominated by rtracer; thus, for the complete cytoskeleton structure and for large tracers the increase of the excluded volume strongly depends on rfiber−2. The same consideration is true for variations of the fiber length, except that the fiber volume linearly depends on the length. Accordingly, the effect of fiber length variation is less pronounced than that of fiber radius variation (see Fig. 5, b and c).
It is possible to mix different fiber types in the simulation. The appropriate proportion of large fibers (e.g., microtubule) to small fibers (e.g., actin filaments) might furthermore improve the congruence between simulation results and theory.
Convergence of subdiffusion into diffusion
Measurements of diffusion in the cytoplasm using FCS reveal subdiffusion of molecules. Accordingly Eq. 1 would give a time-dependent instead of a constant value in the spatial/temporal dimensions covered by FCS (57). Computer simulations of molecules in a crowded environment confirmed this outcome (26,58): 〈x(t)2〉 increases nonlinearly, proportionally to tα with α < 1. This anomalous diffusion turns into normal diffusion after a certain timescale (crossover time), which itself depends on the level of crowding (27,59,60).
Figs. 2 and 6, respectively, illustrate 〈x2(t)〉 and the way in which subdiffusion converged into diffusion, depending on the tracer particle radius. The crossover from anomalous to normal diffusion depended on the excluded volume and its distribution in space. Large tracer particles were caged in the network. This limits 〈x2(t)〉 to a maximum value, depending on the size of the subvolume which restricts the movement. In this case, Deff/D0 → 0, and the crossover time diverges to infinity. Eventually, a stationary value of Deff/D0 was reached in all simulations. The quantity 〈x2(t)〉 for this crossover can be as high as 1 μm2. This crossover distance is smaller than normal cell size, but the nonlinearity of diffusion on short time- and length scales might affect signaling especially when coupled with nonlinear reaction schemes.
Figure 6.
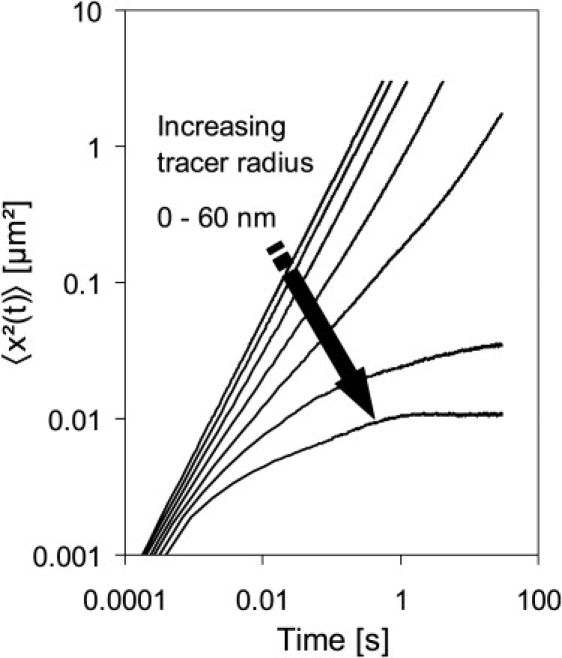
Temporal development of 〈x2(t)〉 for tracer particles with an assumed D0 = 1 μm2/s in a model cytoskeleton with volume fraction = 15%; rf = 12.5 nm. The tracer radius increased in 10-nm steps from 0 to 60 nm. In the log-log representation, the transient anomalous development eventually led to equal slopes, but shifted curves in the normal diffusion regime. Tracers with a radius ≥ 50 nm were caged and eventually showed a constant 〈x2(t)〉.
Discussion
The excellent congruence between theoretical expectations and the results of our simulations using spheres in a cubic lattice indicates that it was also possible to obtain reliable simulation results for the chosen cytoskeleton model. Although the exact in vivo cytoskeleton structure was not known, the simulation with a cytoskeleton volume fraction of 20%, which is in the range reported by Gershon et al. (42), was nevertheless in good agreement with experimental data. To reach this agreement, the hindrance of diffusion due to molecular crowding within the cell had to be taken into account. Further simulations and experimental measurements are needed to be able to define the effect of molecular crowding on diffusion and to predict Deffcrowding/D0, especially in combination with the cytoskeleton structure.
The excellent congruence of experimental data with our simulation using large filament radii and volume fractions can be partly explained by filament bundling. The fibers of the cytoskeleton tend to align with each other, forming bundles (61), which can themselves be treated as larger filament elements. Such a bundle includes other molecules and the space between the single filaments is not accessible to tracer particles. Furthermore, molecules (transiently) bound to the cytoskeleton increase the radius and volume of cytoskeletal structures. Bundling, in turn, is helpful for computer simulations, because larger objects together with a reduced object number reduce the computational effort.
In vivo, the cytoskeleton is a dynamic structure. However, for the timescales under consideration in our simulations (i.e., seconds), the cytoskeleton can be regarded as static. Accordingly, the simulations used assumed rigid fibers, which hold only for distances shorter than the persistence length of the fibers. At longer distances, the cytoskeleton fibers would be flexible. Large particles might thus be able to stretch the network structure, and squeeze through meshes that originally were too small. The persistence length of microtubules is 5200 μm, and for actin filaments it is 17.7 μm (62). With the persistence lengths of the cytoskeleton filaments, rigid fibers can be safely assumed for tracer particles that are smaller than 0.1 μm. The simulation algorithm did not include molecular dynamics. Water molecules and their interactions were not modeled. All processes relating to a hydration layer must therefore be included in a fixed hydrodynamic radius.
Using reasonable ranges for the parameters of cytoskeleton volume fraction and molecular crowding effects, our simulation produced results that are congruent with theoretical and experimental expectations. It provides a good tool for the further investigation of the impact of cytoplasmic properties on transport processes. Such an investigation should include a rigorous analysis of transient binding to cytoskeleton structures as well as the utilization of motor proteins for directed transport along cytoskeleton tracks. The next step will be to combine the separate analysis of hindered diffusion and the stochasticity of (diffusion limited) reactions as outlined in Lapin et al. (20). This is a major step toward realistic simulations of signaling on the cellular level that include all relevant interactions.
Supporting Material
Ten figures and their accompanying tables are available at http://www.biophysj.org/biophysj/supplemental/S0006-3495(09)00778-4.
Supporting Material
Acknowledgments
We thank Bruce Locke for introducing us to the method of volume averaging.
We acknowledge the funding by the State of Baden-Württemberg/Center Systems Biology in Stuttgart.
References
- 1.Oda K., Matsuoka Y., Funahashi A., Kitano H. A comprehensive pathway map of epidermal growth factor receptor signaling. Mol. Syst. Biol. 2005;1:1–17. doi: 10.1038/msb4100014. [DOI] [PMC free article] [PubMed] [Google Scholar]
- 2.Schnapp B.J. Trafficking of signaling modules by kinesin motors. J. Cell Sci. 2003;116:2125–2135. doi: 10.1242/jcs.00488. [DOI] [PubMed] [Google Scholar]
- 3.Kerr I.M., Costa-Pereira A.P., Lillemeier B.F., Strobl B. Of JAKs, STATs, blind watchmakers, jeeps and trains. FEBS Lett. 2003;546:1–5. doi: 10.1016/s0014-5793(03)00411-3. [DOI] [PubMed] [Google Scholar]
- 4.Gómez-Uribe C.A., Verghese G.C. Mass fluctuation kinetics: capturing stochastic effects in systems of chemical reactions through coupled mean-variance computations. J. Chem. Phys. 2007;126:024109. doi: 10.1063/1.2408422. [DOI] [PubMed] [Google Scholar]
- 5.Turner T.E., Schnell S., Burrage K. Stochastic approaches for modeling in vivo reactions. Comput. Biol. Chem. 2004;28:165–178. doi: 10.1016/j.compbiolchem.2004.05.001. [DOI] [PubMed] [Google Scholar]
- 6.Gillespie D. A general method for numerically simulating the stochastic time evolution of coupled chemical reactions. J. Comput. Phys. 1976;22:403–434. [Google Scholar]
- 7.Takahashi K., Arjunan S., Tomita M. Space in systems biology of signaling pathways towards intracellular molecular crowding in silico. FEBS Lett. 2005;579:1783–1788. doi: 10.1016/j.febslet.2005.01.072. [DOI] [PubMed] [Google Scholar]
- 8.Ridgway D., Broderick G., Ellison M.J. Accommodating space, time and randomness in network simulation. Curr. Opin. Biotechnol. 2006;17:493–498. doi: 10.1016/j.copbio.2006.08.004. [DOI] [PubMed] [Google Scholar]
- 9.Tolle D., Le Novre N. Particle-based stochastic simulation in systems biology. Curr. Bioinformat. 2006;1:315–320. [Google Scholar]
- 10.Ander M., Beltrao P., Di Ventura B., Ferkinghoff-Borg J., Foglierini M. SmartCell, a framework to simulate cellular processes that combines stochastic approximation with diffusion and localization: analysis of simple networks. Syst. Biol. 2004;1:129–138. doi: 10.1049/sb:20045017. [DOI] [PubMed] [Google Scholar]
- 11.Kholodenko B.N. Four-dimensional organization of protein kinase signaling cascades: the roles of diffusion, endocytosis and molecular motors. J. Exp. Biol. 2003;206:2073–2082. doi: 10.1242/jeb.00298. [DOI] [PubMed] [Google Scholar]
- 12.Ellis R. Macromolecular crowding: an important but neglected aspect of the intracellular environment. Curr. Opin. Struct. Biol. 2001;11:114–119. doi: 10.1016/s0959-440x(00)00172-x. [DOI] [PubMed] [Google Scholar]
- 13.Grima R., Schnell S. A mesoscopic simulation approach for modeling intracellular reactions. J. Stat. Phys. 2007;128:139–164. [Google Scholar]
- 14.Jacobson K., Wojcieszyn J. The translational mobility of substances within the cytoplasmic matrix. Proc. Natl. Acad. Sci. USA. 1984;81:6747–6751. doi: 10.1073/pnas.81.21.6747. [DOI] [PMC free article] [PubMed] [Google Scholar]
- 15.Blum J.J., Lawler G., Reed M., Shin I. Effect of cytoskeletal geometry on intracellular diffusion. Biophys. J. 1989;56:995–1005. doi: 10.1016/S0006-3495(89)82744-4. [DOI] [PMC free article] [PubMed] [Google Scholar]
- 16.Ölveczky B.P., Verkman A.S. Monte Carlo analysis of obstructed diffusion in three dimensions: application to molecular diffusion in organelles. Biophys. J. 1998;74:2722–2730. doi: 10.1016/S0006-3495(98)77978-0. [DOI] [PMC free article] [PubMed] [Google Scholar]
- 17.Lipkow K., Andrews S.S., Bray D. Simulated diffusion of phosphorylated CheY through the cytoplasm of. Escherichia coli. J. Bacteriol. 2005;187:45–53. doi: 10.1128/JB.187.1.45-53.2005. [DOI] [PMC free article] [PubMed] [Google Scholar]
- 18.Stiles J., Bart T. Monte Carlo methods for simulating realistic synaptic microphysiology using MCell. In: De Schutter Erik., editor. Computational Neuroscience—Realistic Modeling for Experimentalists. CRC Press; Boca Raton, FL: 2001. [Google Scholar]
- 19.Pogson M., Holcombe M., Smallwood R., Qwarnstrom E. Introducing spatial information into predictive NF-κB modeling—an agent-based approach. PLoS ONE. 2008;3:e2367. doi: 10.1371/journal.pone.0002367. [DOI] [PMC free article] [PubMed] [Google Scholar]
- 20.Lapin A., Klann M., Reuss M. Proceedings of the FOSBE 2007. Germany; Stuttgart: 2007. Stochastic simulations of 4D-spatial temporal dynamics of signal transduction processes. [Google Scholar]
- 21.Falk, M., M. Klann, M. Reuss, and T. Ertl. 2009. Visualization of signal transduction processes in the crowded environment of the cell. In Proceedings of IEEE Pacific Visualization Symposium 2009 (PacificVis '09).
- 22.Verkman A.S. Solute and macromolecule diffusion in cellular aqueous compartments. Trends Biochem. Sci. 2002;27:27–33. doi: 10.1016/s0968-0004(01)02003-5. [DOI] [PubMed] [Google Scholar]
- 23.Luby-Phelps K. Cytoarchitecture and physical properties of cytoplasm: volume, viscosity, diffusion, intracellular surface area. Int. Rev. Cytol. 2000;192:189–221. doi: 10.1016/s0074-7696(08)60527-6. [DOI] [PubMed] [Google Scholar]
- 24.Seksek O., Biwersi J., Verkman A.S. Translational diffusion of macromolecule-sized solutes in cytoplasm and nucleus. J. Cell Biol. 1997;138:131–142. doi: 10.1083/jcb.138.1.131. [DOI] [PMC free article] [PubMed] [Google Scholar]
- 25.Kao H.P., Abney J.R., Verkman A.S. Determinants of the translational mobility of a small solute in cell cytoplasm. J. Cell Biol. 1993;120:175–184. doi: 10.1083/jcb.120.1.175. [DOI] [PMC free article] [PubMed] [Google Scholar]
- 26.Weiss M., Hashimoto H., Nilsson T. Anomalous protein diffusion in living cells as seen by fluorescence correlation spectroscopy. Biophys. J. 2003;84:4043–4052. doi: 10.1016/S0006-3495(03)75130-3. [DOI] [PMC free article] [PubMed] [Google Scholar]
- 27.Weiss M., Elsner M., Kartberg F., Nilsson T. Anomalous subdiffusion is a measure for cytoplasmic crowding in living cells. Biophys. J. 2004;87:3518–3524. doi: 10.1529/biophysj.104.044263. [DOI] [PMC free article] [PubMed] [Google Scholar]
- 28.Luby-Phelps K., Lanni F., Taylor D.L. The submicroscopic properties of cytoplasm as a determinant of cellular function. Annu. Rev. Biophys. Biophys. Chem. 1988;17:369–396. doi: 10.1146/annurev.bb.17.060188.002101. [DOI] [PubMed] [Google Scholar]
- 29.Chiam K.-H., Tan C.M., Bhargava V., Rajagopal G. Hybrid simulations of stochastic reaction-diffusion processes for modeling intracellular signaling pathways. Phys. Rev. E Stat. Nonlin. Soft Matter Phys. 2006;74:051910. doi: 10.1103/PhysRevE.74.051910. [DOI] [PubMed] [Google Scholar]
- 30.Ogston A.G., Preston B.N., Wells J.D. On the transport of compact particles through solutions of chain-polymers. Proc. R. Soc. Lond. A: Math. Phys. Sci. 1973;333:297–316. [Google Scholar]
- 31.Cukier R.I. Diffusion of Brownian spheres in semidilute polymer solutions. Macromolecules. 1984;17:252–255. [Google Scholar]
- 32.Muramatsu N., Minton A.P. Tracer diffusion of globular proteins in concentrated protein solutions. Proc. Natl. Acad. Sci. USA. 1988;85:2984–2988. doi: 10.1073/pnas.85.9.2984. [DOI] [PMC free article] [PubMed] [Google Scholar]
- 33.Amsden B. Modeling solute diffusion in aqueous polymer solutions. Polymer. 2002;43:1623–1630. [Google Scholar]
- 34.Han J., Herzfeld J. Macromolecular diffusion in crowded solutions. Biophys. J. 1993;65:1155–1161. doi: 10.1016/S0006-3495(93)81145-7. [DOI] [PMC free article] [PubMed] [Google Scholar]
- 35.Alberts B., Johnson A., Lewis J., Raff M., Roberts K. Wiley-VCH Verlag. Germany; Stuttgart: 2004. Molekularbiologie der Zelle [Molecular Biology of Cells] [Google Scholar]
- 36.Potma E., de Boeij W.P., Bosgraaf L., Roelofs J., van Haastert P.J.M. Reduced protein diffusion rate by cytoskeleton in vegetative and polarized Dictyostelium cells. Biophys. J. 2001;81:2010–2019. doi: 10.1016/s0006-3495(01)75851-1. [DOI] [PMC free article] [PubMed] [Google Scholar]
- 37.Dauty E., Verkman A.S. Actin cytoskeleton as the principal determinant of size-dependent DNA mobility in cytoplasm. J. Biol. Chem. 2005;280:7823–7828. doi: 10.1074/jbc.M412374200. [DOI] [PubMed] [Google Scholar]
- 38.Whitaker S. Springer; New York: 1998. The Method of Volume Averaging. [Google Scholar]
- 39.Pluen A., Netti P.A., Jain R.K., Berk D.A. Diffusion of macromolecules in agarose gels: comparison of linear and globular configurations. Biophys. J. 1999;77:542–552. doi: 10.1016/S0006-3495(99)76911-0. [DOI] [PMC free article] [PubMed] [Google Scholar]
- 40.Cheng Y., Prud'homme R.K., Thomas J.L. Diffusion of mesoscopic probes in aqueous polymer solutions measured by fluorescence recovery after photobleaching. Macromolecules. 2002;35:8111–8121. [Google Scholar]
- 41.Ovadi J. R.G. Landes; Austin, TX: 1995. Cell Architecture and Metabolic Channeling. [Google Scholar]
- 42.Gershon N.D., Porter K.R., Trus B.L. The cytoplasmic matrix: Its volume and surface area and the diffusion of molecules through it. Proc. Natl. Acad. Sci. USA. 1985;82:5030–5034. doi: 10.1073/pnas.82.15.5030. [DOI] [PMC free article] [PubMed] [Google Scholar]
- 43.Hou L., Lanni F., Luby-Phelps K. Tracer diffusion in F-actin and Ficoll mixtures: toward a model for cytoplasm. Biophys. J. 1990;58:31–43. doi: 10.1016/S0006-3495(90)82351-1. [DOI] [PMC free article] [PubMed] [Google Scholar]
- 44.Forgacs G., Yook S.H., Janmey P.A., Jeong H., Burd C.G. Role of the cytoskeleton in signaling networks. J. Cell Sci. 2004;117:2769–2775. doi: 10.1242/jcs.01122. [DOI] [PubMed] [Google Scholar]
- 45.Shafrir Y., Ben-Avraham D., Forgacs G. Trafficking and signaling through the cytoskeleton: a specific mechanism. J. Cell Sci. 2000;113:2747–2757. doi: 10.1242/jcs.113.15.2747. [DOI] [PubMed] [Google Scholar]
- 46.Echeveria C., Tucci K., Kapral R. Diffusion and reaction in crowded environments. J. Phys. Condens. Matter. 2007;19:065146. [Google Scholar]
- 47.Minton A.P. The influence of macromolecular crowding and macromolecular confinement on biochemical reactions in physiological media. J. Biol. Chem. 2001;276:10577–10580. doi: 10.1074/jbc.R100005200. [DOI] [PubMed] [Google Scholar]
- 48.Sun J., Weinstein H. Toward realistic modeling of dynamic processes in cell signaling: Quantification of macromolecular crowding effects. J. Chem. Phys. 2007;127:155105. doi: 10.1063/1.2789434. [DOI] [PubMed] [Google Scholar]
- 49.Ridgway D., Broderick G., Lopez-Campistrous A., Ru'aini M., Winter P. Coarse-grained molecular simulation of diffusion and reaction kinetics in a crowded virtual cytoplasm. Biophys. J. 2008;94:3748–3759. doi: 10.1529/biophysj.107.116053. [DOI] [PMC free article] [PubMed] [Google Scholar]
- 50.Fox R.O. Cambridge University Press; Cambridge, UK: 2003. Computational Models for Turbulent Reacting Flows. [Google Scholar]
- 51.Medalia O., Weber I., Frangakis A.S., Nicastro D., Gerisch G. Macromolecular architecture in eukaryotic cells visualized by cryoelectron tomography. Science. 2002;298:1209–1213. doi: 10.1126/science.1076184. [DOI] [PubMed] [Google Scholar]
- 52.Luby-Phelps K., Weisiger R. Role of cytoarchitecture in cytoplasmic transport. Comp. Biochem. Physiol. 1996;115B:295–306. [Google Scholar]
- 53.Maxwell J. A Treatise on Electricity and Magnetism. Vol. 2. Clarendon Press; Oxford, UK: 1881. [Google Scholar]
- 54.Weissberg H.L. Effective diffusion coefficient in porous media. J. Appl. Phys. 1963;34:2636–2639. [Google Scholar]
- 55.Trinh S., Arce P., Locke B.R. Effective diffusivities of point-like molecules in isotropic porous media by Monte Carlo simulation. Transp. Porous Media. 2000;38:241–259. [Google Scholar]
- 56.Fatin-Rouge N., Starchev K., Buffle J. Size effects on diffusion processes within agarose gels. Biophys. J. 2004;86:2710–2719. doi: 10.1016/S0006-3495(04)74325-8. [DOI] [PMC free article] [PubMed] [Google Scholar]
- 57.Banks D.S., Fradin C. Anomalous diffusion of proteins due to molecular crowding. Biophys. J. 2005;89:2960–2971. doi: 10.1529/biophysj.104.051078. [DOI] [PMC free article] [PubMed] [Google Scholar]
- 58.Netz P., Dorfmüller T. Computer simulation studies of anomalous diffusion in gels: structural properties and probe-size dependence. J. Chem. Phys. 1995;103:9074–9082. [Google Scholar]
- 59.Saxton M. A biological interpretation of transient anomalous subdiffusion. I. Qualitative model. Biophys. J. 2007;92:1178–1191. doi: 10.1529/biophysj.106.092619. [DOI] [PMC free article] [PubMed] [Google Scholar]
- 60.Chang R., Jagannathan K., Yethiraj A. Diffusion of hard sphere fluids in disordered media: a molecular dynamics simulation study. Phys. Rev. E Stat. Nonlin. Soft Matter Phys. 2004;69:051101. doi: 10.1103/PhysRevE.69.051101. [DOI] [PubMed] [Google Scholar]
- 61.Wawrowsky, K. 2007. Analysis and Visualization in Multidimensional Microscopy. PhD thesis, Julius-Maximilians-Universität Würzburg, Würzburg, Germany.
- 62.Gittes F., Mickey B., Nettleton J., Howard J. Flexural rigidity of microtubules and actin filaments measured from thermal fluctuations in shape. J. Cell Biol. 1993;120:923–934. doi: 10.1083/jcb.120.4.923. [DOI] [PMC free article] [PubMed] [Google Scholar]
Associated Data
This section collects any data citations, data availability statements, or supplementary materials included in this article.