

Abstract
The human orbitofrontal cortex is strongly implicated in appetitive valuation. Whether its role extends to support comparative valuation necessary to explain probabilistic choice patterns for incommensurable goods is unknown. Using a binary choice paradigm, we derived the subjective values of different bundles of goods, under conditions of both gain and loss. We demonstrate that orbitofrontal activation reflects the difference in subjective value between available options, an effect evident across valuation for both gains and losses. In contrast, activation in dorsal striatum and supplementary motor areas reflects subjects' choice probabilities. These findings indicate that orbitofrontal cortex plays a pivotal role in valuation for incommensurable goods, a critical component process in human decision making.
Introduction
Many everyday decisions involve comparing the value of available options. Often, the nature of the options varies widely, and such incommensurable outcomes require comparison according to some sort of common value currency. How the human brain effects such comparisons is still unclear. A role for the orbitofrontal cortex (OFC) in valuation under conditions of simple appetitive choice is well established (Tremblay and Schultz, 1999; Gottfried et al., 2003; Padoa-Schioppa and Assad, 2006). A more extended role for the OFC is evident in more complex contexts including the subjective valuation of delayed rewards (Kable and Glimcher, 2007) and the amount subjects are willing to pay for foodstuffs (Plassmann et al., 2007). This more generalized evaluative function makes it a plausible substrate for value comparison. Indeed, neurons in the OFC are known to respond to value similarly under conditions of both gain and loss (Hosokawa et al., 2007). It follows that if this region is involved in value comparison, these processes are likely to display corresponding symmetry.
To address these issues, we designed a paradigm that involved value comparison during economic choice between goods of different classes (money, foodstuffs, noncomestible consumer goods) under conditions of both gain and loss. In practice, choice behavior is probabilistic based on a computation of the relative values of the options under consideration (Kahneman and Tversky, 1979; Vulkan, 2000; Blavatsky, 2008). This indeterminism is frequently characterized using sigmoid choice kernels (Camerer and Ho, 1999) and suggests that comparison involves not just establishing what is preferable but quantifying by how much, an essential process in assigning choice probabilities according to such a kernel. It follows that these probabilities are likely to be reflected in neural activity in brain regions involved in linking value with overt behavioral responses.
In this experiment, we derived the subjective values of bundles of goods offered to a subject, together with their respective choice probabilities, using a repeated binary choice paradigm and a logit analysis (Camerer and Ho, 1999; Lau and Glimcher, 2005). This involves fitting a logistic sigmoid to a subject's choice pattern and is formally equivalent to a softmax decision rule (Sutton and Barto, 1998). We have previously shown that a softmax rule can capture subjects' behavior in the context of reward learning under uncertainty (Daw et al., 2006). Logit techniques provide a method for estimating both relative values and choice probabilities, since the latter can be derived from the shape of the sigmoid curve. By implementing such an approach, we could use our behavioral data to generate parametric regressors that provided the key variables in our analysis of simultaneously acquired functional magnetic resonance imaging (fMRI) data. Our principal hypothesis was that activity in the medial OFC (mOFC) would correlate with a difference in value between the options presented to a subject on a trial-by-trial basis in both conditions. In contrast, based on previous evidence, we predicted that choice probabilities would be reflected in activation of dorsal striatum (Lauwereyns et al., 2002) and cortical areas involved in motor planning (Platt and Glimcher, 1999; Nachev et al., 2008).
Materials and Methods
Subjects.
Sixteen (12 female) subjects, age range 19–29, all right handed, participated in the study. All subjects were free of neurological or psychiatric disease and fully consented to participate. The study was approved by the Joint National Hospital for Neurology and Neurosurgery (University College London Hospitals NHS trust) and Institute of Neurology (University College London) Ethics Committee. After scanning subjects were given a combination of cash/items according to the outcome of a subset of decisions during the task.
Stimuli and task.
Subjects made a series of binary preference decisions between sums of money (£1–25 in £3 increments) and one to three prize objects (1A, 2A, 3A, 1B, 2B, 3B, 1A plus 1B), where A and B could be any two of the item types used in the task. We used multiple similar items rather than different individual items because pilot data had shown significant undervaluing of bundles of multiples identical items. This allowed us to be sure that any neural activity in response to behaviorally derived subjective values did not simply reflect some objective feature of the items (e.g., perceived cost), but rather their subjective desirability. Because we wanted to specifically test the neural mechanisms by which values are compared, we presented these simultaneously rather than sequentially, on either side of a fixation cross for 2200 ms. This was followed after a 500 ms gap by the appearance of two round dots at the image locations, signaling that the subject should make their choice. Subjects indicated their choices by pressing a button with their index finger on one of two MRI-compatible button boxes held in either hand, the left-hand box indicating a selection of the image presented on the left side of the screen, and vice versa. If the subject made a selection within the allowed time (1000 ms), a red ring appeared around the green dot on their chosen side. Intertrial interval was jittered between 2000 and 2500 ms (Fig. 1). Each possible sum/object bundle combination (n = 63) was presented four times, twice in each spatial configuration in a pseudorandomized order counterbalanced across half sessions.
Figure 1.

Illustration of a single trial of the task paradigm (trials were visually identical in both gain and loss sessions). Subjects fixated for an interval jittered between 2000 and 2500 ms, after which they were presented with a choice between a sum of money between £1 and £25 and a bundle of one or more items. In gain sessions, subjects had been shown both money and items, but not yet received them, and they were asked to decide which they would prefer to acquire out of the money and the items. In loss sessions, subjects had already been given £25 and all items to be offered in that particular session, and were asked to choose which they would prefer to give up. These options, as illustrated, were displayed for 2200 ms on either side of the fixation cross. They then disappeared, and after an interval of 500 ms, two green circles appeared, instructing the subject to make a choice. Successful choices (made within the 1000 ms choice-screen display time) were indicated by the appearance of a red ring around the circle on the side chosen.
Visual cues were presented on a computer monitor projected onto a screen, visible via an angled mirror on top of the fMRI head coil. The visual stimuli were photographs of the objects used in the task, and monetary amounts in text, ∼6 cm in diameter viewed on the projector screen from a distance of ∼50 cm. They were fully balanced and randomized across subjects. Each subject performed two sessions of the task, one in a “gain” condition, and one in a “loss” condition. This enabled us to examine to what extent the comparison of gains and losses resemble one another neurophysiologically. In the loss condition, subjects had already received three of each task item used in that session (i.e., 3A and 3B) together with £25 in cash. They were then asked to choose on each trial which of the two options presented they would prefer to lose. In contrast, in the gain condition, subjects began with nothing and selected what they would prefer to receive. The order of these sessions was fully counterbalanced between subjects. To harmonize terminology across conditions, the “selected” option will refer to the cash/objects that the subject chose either to gain or to keep, rather than to the one the subjects actually indicated with their button press.
Items used in the task were 2 GB universal serial bus (USB) keys, mugs, boxes of chocolates, and boxes of luxury biscuits. We used two foodstuffs and two nonfoodstuffs to attempt to demonstrate that the activity we found was not related simply to one class of good. For each subject, two of these item types were used in the win condition and two in the loss. The distribution of task items was counterbalanced across subjects, across item classes (food/nonfood), and across experimental conditions. At the end of the experiment, subjects drew two raffle tickets from separate bags. They then received what they had chosen on the trial corresponding to the number on the “gain” ticket and lost (from the items and money they had previously been given) what they had chosen on the trial corresponding to the number on the “loss” ticket. Participants were not compensated other than their winnings on the experiment. Subjects were told that if the ticket number corresponded to a trial on which they made no response, then they would either gain nothing or lose both of the goods presented on that trial. In practice, due to the very small number of errors committed, this did not happen.
Before scanning subjects underwent a computerized tutorial to familiarize them with the task. At the end of this, subjects were asked to describe the task to check that they understood it. All were able to do so adequately. They were also left with the task items for at least 5 min and instructed to familiarize themselves adequately with them. This was designed to ensure that they developed clear valuations of the items and also that subjects believed that they would receive the items after the experiment.
Behavioral analysis.
The proportion of trials on which a subject chose cash were plotted separately for each offer value, in relation to each item bundle. These distributions were then fitted with a logistic sigmoid function. The underlying value of the bundle was estimated based on the indifference point, reflecting the monetary value at which the subject was equally likely to choose either offer. The estimated value of the item bundle, together with the shape of the logistic sigmoid itself, was then used to construct parametric regressors for use in the fMRI analysis as described below. Subjects in whom it proved impossible to derive value estimates for at least one bundle type either through inconsistency (n = 1) or because bundle values exceeded £25 (n = 1) were discarded from behavioral and imaging analysis. All behavioral analysis was performed using Matlab 6.5 (MathWorks).
fMRI.
Gradient-echo T2*-weighted echo-planar (EPI) images were acquired on a 3T Allegra Siemens scanner. Scanner settings (echo time, 0.065 ms; repetition time, 2.6 s; 40 2 mm slices acquired in descending order at an angle of 30° in the anterior–posterior axis) were designed to optimize sensitivity in the OFC (Deichmann et al., 2003). In each session, 598 images were collected (∼25 min each, two per subject). Whole-brain 1 mm × 1 mm × 1 mm T1-weighted structural images were also acquired, coregistered with mean EPI images, and averaged across subjects to permit anatomical localization. Subjects lay in the scanner with foam head-restraint pads to minimize any movement. They responded using two fMRI-compatible button boxes.
Preprocessing and statistical analysis were performed using SPM5 (Wellcome Trust Centre for Neuroimaging, London, UK, www.fil.ion.ucl.ac.uk/spm). After discarding the first eight images to allow for T1 equilibration effects, images were realigned with the first volume, normalized to a standard EPI template, and smoothed using an 8 mm full-width at half-maximum Gaussian kernel. Realignment parameters were inspected visually to identify any potential subjects with excessive head movement, and those with excessive movement (n = 2) were removed from imaging analysis.
Primary analysis.
Images were analyzed in an event-related manner using the general linear model, with trials represented by a boxcar function of duration equal to that of image presentation (2200 ms). These events were then modulated by five parametric regressors. Three of these were generated using the values derived from subjects' estimated indifference points. The first of these was the summed value of the two offers presented on the particular trial (LV) (V1 + V2). The second was the absolute value (AV = |PE|) of the prediction error for the summed value generated using a simple Rescorla-Wagner learning rule such that PV(1) = 0; and for all t > 1: PE(t) = LV(t) − PV(t); PV(t + 1) = PV(t) + δ × PE(t), where PE is the prediction error, t is the trial number, δ = 0.01, and PV is the predicted value. We attempted to model prediction errors in this study using both the actual prediction error and the absolute value of it, and used δ values between 0.01 and 0.9, and have selected 0.01 since this yielded the largest parameter estimate in the peak voxel in the ventral striatum. Since we found no significant activations corresponding to a simple prediction error, we do not discuss it further. Nor do we make any particular claims for the precise learning rate exhibited by subjects, since our search was not exhaustive. The third, key, regressor was the difference between the offer values (DV) (|V1 − V2|).
We define DV as the absolute value of the difference between the options available to the subject. A similar regressor could be generated by subtracting the value of the unchosen from that of the chosen option (since subjects are extremely likely to choose the higher valued option). Thus, we have selected the definition of DV used in our analyses on theoretical grounds. The idea that agents compare the values of options available to them, and then select between them stochastically, based on probabilities derived from some nonlinear choice kernel is well established (Corrado et al., 2005; Lau and Glimcher, 2005; Daw et al., 2006; Padoa-Schioppa and Assad, 2006; Kable and Glimcher, 2007; Tom et al., 2007). This fits better with DV as defined here and obviates the need to interpret what the negative parameter value derived when subjects chose a lower-valued option might mean either neurophysiologically or in terms of decision making.
We used the shape of the logistic sigmoid to derive estimates of the maximum choice probability (the probability of choosing the more highly valued option, which thus varied from 0.5 to 1.0) on each trial (MP). This is a measure of how far choices are biased away from indifference by the values of the options under consideration. We also generated a parametric regressor based on the side of the screen on which the selected offer was presented (side). These regressors were orthogonalized in the order LV, AV, DV, MP, and side using the Gram-Schmidt process (see supplemental Fig. S5, available at www.jneurosci.org as supplemental material). The resulting stimulus functions were then convolved with a hemodynamic response function (HRF). Regression was performed using restricted maximum likelihood estimations in SPM. Effects of no interest included error trials and realignment parameters from the image preprocessing to provide additional correction for residual subject motion. Low-frequency fluctuations were removed using a high-pass filter (cutoff 128 s) and an AR(1) model plus white noise was used to correct for temporal autocorrelation. Group-level activation was determined by performing a one-sample t test on the linear contrasts of the statistical parametric maps (SPMs) generated during the first-level analysis.
Because the DV and MP regressors are highly correlated, in our main model, activation due to MP could be misattributed to DV due to their shared components. We performed a supplementary analysis in which we switched the order of the two regressors in our model and hence their order of orthogonalization (see supplemental Results, available at www.jneurosci.org as supplemental material). We report DV and MP activations that are significant in both models. As a further measure, we performed a conjunction analysis between the MP regressor from the main model and the DV regressor from this second check model (supplemental Results, available at www.jneurosci.org as supplemental material). In addition we analyzed the data using several different models containing parameters that might plausibly have been encoded by the orbitofrontal cortex, including the chosen value, the ratio between the two values, and whether the subject chose money or the item bundle. We also looked at whether activation patterns were significantly different for each of our regressors on trials in which the goods on offer were foodstuffs as opposed to trials in which they were not. These results are all presented in the supplemental material (available at www.jneurosci.org).
On the basis of previous work, contrast-specific regions of interest (ROIs) were selected in the medial prefrontal/orbitofrontal cortices, anterior and posterior cingulate cortices, midbrain, and dorsal and ventral striatum for the value contrasts (Kable and Glimcher, 2007; Hare et al., 2008). We also included posterior parietal cortex and the supplementary motor area as ROIs for the maximum choice probability contrast, areas shown previously to be involved in initiating and controlling voluntary action (Platt and Glimcher, 1999; Nachev et al., 2008). Changes in the blood oxygenation level-dependent (BOLD) contrast in these regions that exceeded p < 0.001 uncorrected and had a volume of >4 voxels (108 mm3) are reported. Otherwise only changes that exceeded p < 0.05 (familywise error rate corrected) with a volume of 4 voxels or greater are reported. Activation coordinates are given in Montreal Neurological Institute space as generated by SPM5.
Post hoc analyses. As a quality control for the activation patterns generated by our group-level analysis, we performed a post hoc analysis. We first divided trials according to whether the summed value of the items presented on that trial fell into the lower, middle, or upper third of the range in that session. We then modeled these as separate regressors in a simplified model containing only these events, the choice screen onsets, error trial onsets, and movement parameters. This model allowed us to directly inspect the response patterns in brain regions whose activity was modulated by LV. We then generated similar models for the AV, DV, and MP regressors. Regions of interest were extracted from the results of the primary model with a threshold of p < 0.001 (uncorrected) using the MarsBaR SPM toolbox (http://marsbar.sourceforge.net/), and the average parameter estimates were calculated, along with 90% confidence intervals.
Results
Behavioral results
Reaction time data demonstrated a significant difference between the gain and loss frames (Table 1). Reaction times were significantly longer in the loss frame (p = 0.051 for a two-tailed t test, p = 0.049 from the ANOVA used to analyze rejected offer value), where there was both a main effect of size for the rejected option (p < 0.00001) and a significant interaction between this and the gain or loss frame (p < 0.00001) (Fig. 2). Specifically, when a subject was forced to accept a larger loss, their reaction time increased by more than when they chose a larger gain (Fig. 2B). This is consistent with the well established finding that approach responses to aversive stimuli are slowed (Chen and Bargh, 1999), and strongly suggests that losses were treated differently from gains, in keeping with prospect theory (Kahneman and Tversky, 1979).
Table 1.
Reaction times in both conditions pooled across subjects show a significant difference between the gain and loss conditions
| Mean (ms) | 90% confidence interval | |
|---|---|---|
| Gain | 366.6 | 362.6–370.7 |
| Loss | 373.7 | 369.3–378.0 |
Figure 2.
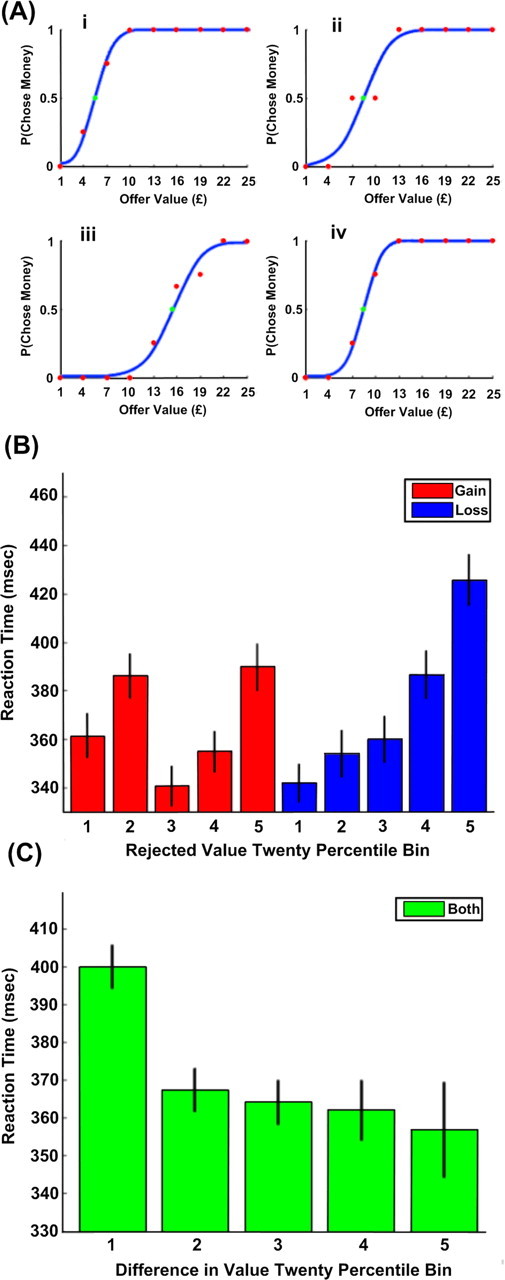
A, Money-offer choice probabilities (red dots) fitted with logistic sigmoids (blue lines) for four different offer types (i: one box of chocolates, ii: three USB sticks, iii: two boxes of biscuits, iv: two USB sticks) in four different subjects. The data in i and ii were collected under the gain condition, and those in iii and iv were collected under the loss condition. The green dot indicates the estimated indifference point (here £5.48, 8.47, 15.54, 8.48), used to infer the value of the item bundle. B, Reaction time data pooled between all subjects and binned in 20 percentiles according to the value of the rejected option. Bars in blue indicate reaction times from the gain frame, while bars in red indicate loss. Black lines represent 90% confidence intervals. Reaction times were significantly longer in the loss frame than in the gain frame. There was also a significant effect of rejected offer value, and a significant interaction between this and the frame, where larger values are more strongly correlated with longer reaction times in the loss frame. C, Reaction time data pooled between all subjects and in both frames and binned in percentiles of 20 according to the difference between the option values. Black lines represent 90% confidence intervals. The difference in value was inversely correlated with the reaction time, but this showed no interaction with the frame (gain or loss).
We also identified a significant negative correlation between the difference in value between the two offers and the reaction time (p < 0.00001), with a trend toward a significant interaction with condition (p = 0.094) (Fig. 2C), where reaction times in the loss frame were more strongly affected than gains. (The correlation with value ratio was also highly significant.) This correlation suggests that our value estimation procedure was broadly correct, based on the assumption that choices where option values are closer together are more difficult and hence take longer to make. The logistic sigmoid provided a good fit for the data (mean R2 = 0.9451, range 0.8718–0.9948). Examples are shown in Figure 2A. Note that bundle valuations did not differ significantly between gain and loss conditions (p = 0.6469).
Bundle valuations showed significant intersubject variation (supplemental Table S1, available at www.jneurosci.org as supplemental material). Subjects also displayed considerable nonlinearity in valuing bundles containing multiples of items both for same-item bundles (2A, 3A) and for mixed bundles (1A1B) (see supplemental Results, Figs. S1, S2, available at www.jneurosci.org as supplemental material). In other words, they valued bundles of multiple items lower than would have been predicted by summing the values of their constituents. These results suggest that their choices were made according to the bundles' subjective values and not any objective features such as perceived price. The significant undervaluing of mixed bundles (even when these were of different classes, e.g., one box of chocolates and one USB stick) is particularly striking, since it is difficult to explain either by an appeal to subjects' associations with the kind of “multipack” discounting prevalent in an everyday consumer environment or redundancy within the groups of offered items (there is no reason why having a box of chocolates should make a USB stick less useful).
Imaging results
Brain regions involved in assessment of value
Due to the simultaneous presentation format of the task, brain areas involved in option valuation need to be sensitive to the values of both the offers presented to the subject, hence we might expect to see the sum of these two values represented in the BOLD signal.
We first tested for regions where changes in the BOLD contrast were correlated with the sum of the presented values. No regions were significantly correlated with the main effect of LV, or with its interactions with the task frame once corrected for multiple comparisons, but two regions in the anterior cingulate ([0, 30, 27], z = 3.58) and dorsolateral prefrontal cortex ([18, 57, 24], z = 4.17) showed significant activation in the loss − gain interaction contrast at p < 0.001 uncorrected. No regions reached significance at this level in the opposite gain − loss interaction contrast, although a region of the ventral striatum ([9, 21, −6], z = 3.01) showed activation at a reduced significance level (p < 0.005 uncorrected). This may have been because subjects had no need to keep track of the value of the choice set presented on a given trial, since none of their subsequent decisions would depend on this.
We next tested for AV. Activity in medial orbitofrontal cortex ([−12, 33, −9], z = 3.74) and left ventral striatum ([−9, 6, −6], z = 3.96) correlated with this regressor (supplemental Fig. S3, available at www.jneurosci.org as supplemental material). We did not find a significant interaction with the task frame, but note that the post hoc analysis suggests that this correlation may have been driven largely by the activity during gain trials (supplemental Fig. S3, available at www.jneurosci.org as supplemental material). We note that this response profile is similar to that found in the ventral striatum in a study examining valuation of conditioned stimuli (O'Doherty et al., 2006). However, in the latter study, subjects' preferences were assessed ordinally and only using juice rewards. The inference here is that a more widespread set of regions demonstrate this sort of response to value during choice between incommensurable goods.
Comparative valuation
To decide between options, an agent needs to be able to compare their subjective expected value. A softmax decision rule predicts this comparison should be made by implementing a differencing operation applied to previously estimated values. On this basis, we tested for neural activity that correlated during choice with a difference in value of options offered to the subject. Activity in the medial orbitofrontal cortex ([−15, 30, −6], z = 3.71) and posterior cingulate ([−3, −36, 48], z = 4.48) significantly correlated with a difference in value (Fig. 3). Note that this pattern was evident both for gain and loss choices.
Figure 3.

A, Regions where activation correlated with the difference in value between presented options in the medial orbitofrontal cortex and posterior cingulate cortex (image is at x = 0) (yellow: p < 0.001, red: p < 0.005, clusters >100 mm3 in size shown). B, Parameter estimates for activation in the medial orbitofrontal cortex ROI at low (L), medium (M), and high (H) difference values. Estimates in the gain frame are in blue, and those for the loss frame are in red. Black lines indicate 90% confidence intervals.
We report the orbitofrontal activation with the caveat that precise anatomical localization and functional attribution in the medial orbitofrontal regions is difficult even when using optimized scanning protocols. We note that activation in similar locations is frequently described as mOFC (Plassmann et al., 2007; Hare et al., 2008), and we follow this convention for consistency. We acknowledge that in other contexts this region is referred to as the subgenual cingulate cortex.
It should also be noted that posterior cingulate cortex (PCC) activation was also found in other models using value ratio or chosen value regressors in place of DV, and that since they are both significantly correlated with it, we cannot claim with absolute confidence that PCC is involved in the differencing operation. No such caveat applies to the mOFC, however. PCC activation patterns differed between models 1 and 2, but this is inevitable, since in model 1 activation correlated with the common component of the MP and DV regressors is assigned to DV, while in model 2 it is not.
Maximum choice probability
Maximum choice probability was reflected in activation within the posteromedial frontal cortex ([0, −21, 51], z = 4.24) and, most strikingly, the body of right caudate nucleus (several clusters including [18, −21, 18], z = 3.96 and [21, 12, 18], z = 3.52) (Fig. 4). A separate region of the medial OFC ([12, 30, −15], z = 3.00) was also activated at a slightly lower threshold (p < 0.002). The posteromedial frontal activation peak falls within the supplementary motor area (SMA), but it is more posterior than in many motor tasks (Picard and Strick, 1996), and might conceivably encroach onto primary somatomotor cortices.
Figure 4.

A, Activity in the caudate nucleus and supplementary motor area correlated with the maximum choice probability as estimated by the logit analysis (left image is at y = 12, right is at x = −3) (yellow: p < 0.001, red: p < 0.005, clusters >100 mm3 in size shown). B, Parameter estimates for activation in the dorsal striatum (DS) ROI at low (L), medium (M), and high (H) maximum choice probabilities. Estimates in the gain frame are in blue, and those for the loss frame are in red. Black lines indicate 90% confidence intervals.
Value similarity (conflict)
A network of brain regions including the pre-SMA ([0, 33, 33], z = 4.23) and bilateral insula cortices ([−36, 18, 9], z = 3.94 and [30, 24, 6], z = 3.98) showed activity that was inversely correlated with the difference in value of the choice items (see supplemental Fig. S4, available at www.jneurosci.org as supplemental material). This is in line with the behavioral data, which showed a significant correlation between decreasing difference in value and reaction times, and fits well with the general notion of an increased role for these regions in conflicted (Botvinick et al., 2004; Rushworth et al., 2005) or uncertain (Grinband et al., 2006) choice.
Discussion
Humans are often faced with deciding between two courses of actions with entirely different characteristics. For instance, we often need to decide between spending money on a luxury such as a painting or a holiday, or between paying for piano lessons or better car insurance. That such incommensurable choice options are comparable with any consistency at all is remarkable, and suggests an efficient neural system that channels options into a core comparative valuation system.
Although our paradigm does not precisely replicate these choice conditions, it is most parsimonious to interpret our behavioral findings as evidence for the comparison of disparate alternatives based on an internal, subjective valuation scheme. Recall that these decisions are more difficult (take longer) to make when the values of the two options considered are similar, as well as when the chosen outcome is more aversive (comparing either gains to losses, or a greater foregone value to a lesser within either of the frames). This clearly demonstrates that the values we derived are highly relevant to choice behavior, and the intersubject and intrasubject patterns of variation in these strongly suggest that they were not the direct consequence of any objective features of the task items, but rather reflected their perceived worth to the subjects.
In support of our hypothesis related to valuation, we show that activation in the medial orbitofrontal and perhaps posterior cingulate cortices is correlated with the difference in value between presented options. This implicates these regions in encoding value comparisons, not simply of the form that one option is better than another, but assigning a quantity that reflects by how much. This finding echoes recent evidence for the existence of a cardinal, or cardinal-like, valuation scale in the orbitofrontal cortex of the macaque (Padoa-Schioppa and Assad, 2006; Padoa-Schioppa and Assad, 2008), and develops upon previous findings suggesting that activity in this area indexes simple (ordinal) preference (Tremblay and Schultz, 1999; Elliott et al., 2008; Seymour and McClure, 2008).
It is interesting to note that in a similar experimental paradigm in monkeys, OFC neurons were found to encode chosen value rather than DV. This discrepancy is difficult to resolve directly given the uncertainties about the relationship between the BOLD response and single-unit activity (Logothetis, 2008). We note that in this previous work, other cell classes were found with different patterns of responding to values of offered rewards, and that the DV signal seen here could conceivably be represented by some form of population coding (Averbeck et al., 2006). It would be interesting to address this issue more directly, perhaps using fMRI in macaques.
Recent imaging studies have found strong evidence that mOFC encodes the subjective value of foodstuffs in willingness-to-pay paradigms (Plassmann et al., 2007; Hare et al., 2008) and the net attractiveness of gambles (Tom et al., 2007). This kind of evaluative process is implied but not directly indexed by the task used here. Instead we look at a subsequent stage at which the values of evaluated option are compared with one another. Thus our findings represent a natural extension of these previous studies, and it is interesting that the same cortical region is involved in each. Put together with recent findings on temporal discounting (Kable and Glimcher, 2007) that suggest that valuations in this area incorporates alterations (discounting) effected upon goods by delay, there is a very strong case for suggesting that it is crucial for representing and manipulating subjective value (Schoenbaum et al., 2007; Rushworth and Behrens, 2008).
It is important to distinguish our aims and results from those of Hare et al. (2008). Here the authors use a willingness-to-pay paradigm by asking subjects whether or not they would like to purchase an item at a particular price. They derive a “decision value” metric by subtracting this price from the amount subjects indicated they would pay for that same item when tested outside the scanner. This is, as an approximation, a measure of the value of each trial to the subject (and can be negative, when the price is greater than the value they place on the object). In our paradigm, subjects are not asked to weigh a loss (the price) against a gain (the item). Rather, they are asked to compare goods within a (gain or loss) domain, and choose which item or bundle they prefer [the importance of distinguishing between gain and loss domains is a central tenet of prospect theory (Kahneman and Tversky, 1979), manifest in phenomena such as loss aversion and the endowment effect (Kahneman et al., 2000)]. Because we are specifically interested in this comparison process, and how it drives choice, we derive our DV (difference in value) regressor by subtracting the smaller option value from the larger. This is quite distinct from decision value (it cannot, for example, take on a negative value), and indeed correlates with neuronal activity in a separate region of frontal cortex [mOFC as opposed to central OFC as reported by Hare et al. (2008)]. Note that in our study the value of each trial to the subject is best modeled by the chosen value on each trial. We did not find any central OFC activation in response to this regressor (see supplemental Table S7, available at www.jneurosci.org as supplemental material), which may reflect a key experimental difference arising out of a simultaneous bundle presentation format of our task.
Similarly, it is important to make clear that although our paradigm involves both gains and losses, since subjects never make decisions that involve interdomain comparisons (never trade off a gain vs a loss) it does not speak to issues that might reflect either an endowment effect or loss aversion, despite the fact that we see an effect of decision frame (gain or loss) in our reaction time data. Instead what we did find was the involvement of the OFC in comparative valuation for choices that involved gains and losses. This suggests that options are compared in a similar manner whether the aim for the subject is to choose the smaller of two losses or the larger of two gains. Previous studies have found that neurons in macaque OFC encode preference for an appetitive as opposed to a neutral stimulus in the same way as preference for that same neutral stimulus over an aversive one (Hosokawa et al., 2007). There is also evidence from an instrumental learning paradigm of greater activation within mOFC for both attained rewards and avoided punishments (Kim et al., 2006). These findings can be subsumed under the general notion that orbitofrontal cortex encodes the relative subjective desirability of outcomes both between and within frames. This idea is attractive as it suggests a straightforward way that decision making could move beyond a monotonic gain/loss regime to more ecological, polyvalent contexts where options have both clear merits and demerits, many not obviously commensurable (Rudebeck et al., 2006; Rushworth et al., 2007).
We observed a network of regions sensitive to maximum choice probability that included the caudate nucleus. This accords with a suggestion that the caudate nucleus and posteromedial frontal cortex are activated specifically during action selection (Gerardin et al., 2004). This makes intuitive sense in terms of striatal anatomy: the dorsal striatum is more strongly connected to motor regions of the frontal cortex, while the ventral striatum is more strongly connected to OFC regions involved in valuation (Alexander et al., 1990; Haber et al., 2000, 2006). Studies in the macaque have suggested that neurons in this area are intimately involved in linking reward and motor behavior (Kawagoe et al., 1998; Lauwereyns et al., 2002; Ikeda and Hikosaka, 2003; Kobayashi et al., 2007). Our results suggest a more precise role, in biasing motor responses according to choice probabilities derived from a sigmoid decision kernel. This is important for understanding both normal corticostriatal function and its impairment. Dopamine is critically important for the caudate's role in influencing action (Nakamura and Hikosaka, 2006), and it is possible that decision-making deficits observed in patients with dopamine depletion (such as Parkinson's disease) might be related to dopamine depletion in the region impairing its ability to correctly bias action selection.
A recent study found that neuronal activity in ventral striatum predicted purchasing during a shopping task (Knutson et al., 2007). This differs from the MP regressor used here in that subjects were presented with a significantly different experimental paradigm (asking them about their willingness to pay a certain amount for something rather than to compare the value of two goods and express a preference). It also differs because the MP regressor is symmetrical and is a measure of how far subjects' choices were biased away from indifference, whichever option they preferred, rather than an index for their liking for the item per se.
It is interesting to speculate on how these findings relate to the body of evidence that exists relating neuronal activity in the parietal cortex to choice (Platt and Glimcher, 1999; Dorris and Glimcher, 2004; Sugrue et al., 2004). It is conceivable that the caudate nucleus acts either directly or indirectly on these regions to control firing such that a particular action is more or less likely to be initiated, in a similar manner to that posited to occur during reward guided saccades (Ikeda and Hikosaka, 2003). Although we found posterior parietal activation that correlated with the probability of choosing a particular side, it is difficult in the context of this task to distinguish this from simple motor preparation (represented by the “chosen side” regressor in our analysis).
It is difficult to be certain of the precise functional significance of the neural responses to AV, but it might plausibly relate either to monitoring of ongoing average reward levels in computational models that incorporate response vigor (Niv et al., 2007), or to implementational models that exploit opponent coding (Daw et al., 2002).
Our data provide neurobiological evidence that attributes a central role to the OFC in value comparison, where the critical weighting is based on the differences in value between presented options. These differences appear to be assessed using an abstract valuation scale that functions similarly in both gain and loss domains, and is used to influence choice probabilities. Thus, the findings speak to a growing understanding of the neural processes related to object valuation instantiated in this cortical region, processes that are essential in underpinning choice.
Footnotes
This work was funded by a Wellcome Trust Programme grant to R.J.D. T.H.B.F. was supported by a studentship from King's College London. We thank B. de Martino, A. Pine, and the members of the Emotion Group at the Wellcome Department of Imaging Neuroscience for valuable discussions and C. Doeller for assistance with scanning. T.H.B.F., B.S., and R.J.D. designed research, T.H.B.F. and B.S. performed experiments, T.H.B.F. analyzed data, and T.H.B.F., B.S., and R.J.D. wrote the paper.
The authors declare no competing financial interests.
References
- Alexander GE, Crutcher MD, DeLong MR. Basal ganglia-thalamocortical circuits: parallel substrates for motor, oculomotor, “prefrontal” and “limbic” functions. Prog Brain Res. 1990;85:119–146. [PubMed] [Google Scholar]
- Averbeck BB, Latham PE, Pouget A. Neural correlations, population coding and computation. Nat Rev Neurosci. 2006;7:358–366. doi: 10.1038/nrn1888. [DOI] [PubMed] [Google Scholar]
- Blavatsky PR. Stochastic utility theorem. J Math Econ. 2008;44:1049–1056. [Google Scholar]
- Botvinick MM, Cohen JD, Carter CS. Conflict monitoring and anterior cingulate cortex: an update. Trends Cogn Sci. 2004;8:539–546. doi: 10.1016/j.tics.2004.10.003. [DOI] [PubMed] [Google Scholar]
- Camerer C, Ho TH. Experience-weighted attraction learning in normal form games. Econometrica. 1999;67:827–874. [Google Scholar]
- Chen M, Bargh JA. Consequences of automatic evaluation: immediate behavioral predispositions to approach or avoid the stimulus. Pers Soc Psychol Bull. 1999;25:215–224. [Google Scholar]
- Corrado GS, Sugrue LP, Seung HS, Newsome WT. Linear-nonlinear-Poisson models of primate choice dynamics. J Exp Anal Behav. 2005;84:581–617. doi: 10.1901/jeab.2005.23-05. [DOI] [PMC free article] [PubMed] [Google Scholar]
- Daw ND, Kakade S, Dayan P. Opponent interactions between serotonin and dopamine. Neural Netw. 2002;15:603–616. doi: 10.1016/s0893-6080(02)00052-7. [DOI] [PubMed] [Google Scholar]
- Daw ND, O'Doherty JP, Dayan P, Seymour B, Dolan RJ. Cortical substrates for exploratory decisions in humans. Nature. 2006;441:876–879. doi: 10.1038/nature04766. [DOI] [PMC free article] [PubMed] [Google Scholar]
- Deichmann R, Gottfried JA, Hutton C, Turner R. Optimized EPI for fMRI studies of the orbitofrontal cortex. Neuroimage. 2003;19:430–441. doi: 10.1016/s1053-8119(03)00073-9. [DOI] [PubMed] [Google Scholar]
- Dorris MC, Glimcher PW. Activity in posterior parietal cortex is correlated with the relative subjective desirability of action. Neuron. 2004;44:365–378. doi: 10.1016/j.neuron.2004.09.009. [DOI] [PubMed] [Google Scholar]
- Elliott R, Agnew Z, Deakin JF. Medial orbitofrontal cortex codes relative rather than absolute value of financial rewards in humans. Eur J Neurosci. 2008;27:2213–2218. doi: 10.1111/j.1460-9568.2008.06202.x. [DOI] [PubMed] [Google Scholar]
- Gerardin E, Pochon JB, Poline JB, Tremblay L, Van de Moortele PF, Levy R, Dubois B, Le Bihan D, Lehéricy S. Distinct striatal regions support movement selection, preparation and execution. Neuroreport. 2004;15:2327–2331. doi: 10.1097/00001756-200410250-00005. [DOI] [PubMed] [Google Scholar]
- Gottfried JA, O'Doherty J, Dolan RJ. Encoding predictive reward value in human amygdala and orbitofrontal cortex. Science. 2003;301:1104–1107. doi: 10.1126/science.1087919. [DOI] [PubMed] [Google Scholar]
- Grinband J, Hirsch J, Ferrera VP. A neural representation of categorization uncertainty in the human brain. Neuron. 2006;49:757–763. doi: 10.1016/j.neuron.2006.01.032. [DOI] [PubMed] [Google Scholar]
- Haber SN, Fudge JL, McFarland NR. Striatonigrostriatal pathways in primates form an ascending spiral from the shell to the dorsolateral striatum. J Neurosci. 2000;20:2369–2382. doi: 10.1523/JNEUROSCI.20-06-02369.2000. [DOI] [PMC free article] [PubMed] [Google Scholar]
- Haber SN, Kim KS, Mailly P, Calzavara R. Reward-related cortical inputs define a large striatal region in primates that interface with associative cortical connections, providing a substrate for incentive-based learning. J Neurosci. 2006;26:8368–8376. doi: 10.1523/JNEUROSCI.0271-06.2006. [DOI] [PMC free article] [PubMed] [Google Scholar]
- Hare TA, O'Doherty J, Camerer CF, Schultz W, Rangel A. Dissociating the role of the orbitofrontal cortex and the striatum in the computation of goal values and prediction errors. J Neurosci. 2008;28:5623–5630. doi: 10.1523/JNEUROSCI.1309-08.2008. [DOI] [PMC free article] [PubMed] [Google Scholar]
- Hosokawa T, Kato K, Inoue M, Mikami A. Neurons in the macaque orbitofrontal cortex code relative preference of both rewarding and aversive outcomes. Neurosci Res. 2007;57:434–445. doi: 10.1016/j.neures.2006.12.003. [DOI] [PubMed] [Google Scholar]
- Ikeda T, Hikosaka O. Reward-dependent gain and bias of visual responses in primate superior colliculus. Neuron. 2003;39:693–700. doi: 10.1016/s0896-6273(03)00464-1. [DOI] [PubMed] [Google Scholar]
- Kable JW, Glimcher PW. The neural correlates of subjective value during intertemporal choice. Nat Neurosci. 2007;10:1625–1633. doi: 10.1038/nn2007. [DOI] [PMC free article] [PubMed] [Google Scholar]
- Kahneman D, Tversky A. Prospect theory: an analysis of decision under risk. Econometrica. 1979;47:263–292. [Google Scholar]
- Kahneman D, Knetsch JL, Thaler RH. Anomalies: the endowment effect, loss aversion, and status quo bias. In: Kahneman D, Tversky A, editors. Choices, values, and frames. New York: Cambridge UP; 2000. pp. 159–170. [Google Scholar]
- Kawagoe R, Takikawa Y, Hikosaka O. Expectation of reward modulates cognitive signals in the basal ganglia. Nat Neurosci. 1998;1:411–416. doi: 10.1038/1625. [DOI] [PubMed] [Google Scholar]
- Kim H, Shimojo S, O'Doherty JP. Is avoiding an aversive outcome rewarding? Neural substrates of avoidance learning in the human brain. PLoS Biol. 2006;4:e233. doi: 10.1371/journal.pbio.0040233. [DOI] [PMC free article] [PubMed] [Google Scholar]
- Knutson B, Rick S, Wimmer GE, Prelec D, Loewenstein G. Neural predictors of purchases. Neuron. 2007;53:147–156. doi: 10.1016/j.neuron.2006.11.010. [DOI] [PMC free article] [PubMed] [Google Scholar]
- Kobayashi S, Kawagoe R, Takikawa Y, Koizumi M, Sakagami M, Hikosaka O. Functional differences between macaque prefrontal cortex and caudate nucleus during eye movements with and without reward. Exp Brain Res. 2007;176:341–355. doi: 10.1007/s00221-006-0622-4. [DOI] [PubMed] [Google Scholar]
- Lau B, Glimcher PW. Dynamic response-by-response models of matching behavior in rhesus monkeys. J Exp Anal Behav. 2005;84:555–579. doi: 10.1901/jeab.2005.110-04. [DOI] [PMC free article] [PubMed] [Google Scholar]
- Lauwereyns J, Watanabe K, Coe B, Hikosaka O. A neural correlate of response bias in monkey caudate nucleus. Nature. 2002;418:413–417. doi: 10.1038/nature00892. [DOI] [PubMed] [Google Scholar]
- Logothetis NK. What we can do and what we cannot do with fMRI. Nature. 2008;453:869–878. doi: 10.1038/nature06976. [DOI] [PubMed] [Google Scholar]
- Nachev P, Kennard C, Husain M. Functional role of the supplementary and pre-supplementary motor areas. Nat Rev Neurosci. 2008;9:856–869. doi: 10.1038/nrn2478. [DOI] [PubMed] [Google Scholar]
- Nakamura K, Hikosaka O. Role of dopamine in the primate caudate nucleus in reward modulation of saccades. J Neurosci. 2006;26:5360–5369. doi: 10.1523/JNEUROSCI.4853-05.2006. [DOI] [PMC free article] [PubMed] [Google Scholar]
- Niv Y, Daw ND, Joel D, Dayan P. Tonic dopamine: opportunity costs and the control of response vigor. Psychopharmacology (Berl) 2007;191:507–520. doi: 10.1007/s00213-006-0502-4. [DOI] [PubMed] [Google Scholar]
- O'Doherty JP, Buchanan TW, Seymour B, Dolan RJ. Predictive neural coding of reward preference involves dissociable responses in human ventral midbrain and ventral striatum. Neuron. 2006;49:157–166. doi: 10.1016/j.neuron.2005.11.014. [DOI] [PubMed] [Google Scholar]
- Padoa-Schioppa C, Assad JA. Neurons in the orbitofrontal cortex encode economic value. Nature. 2006;441:223–226. doi: 10.1038/nature04676. [DOI] [PMC free article] [PubMed] [Google Scholar]
- Padoa-Schioppa C, Assad JA. The representation of economic value in the orbitofrontal cortex is invariant for changes of menu. Nat Neurosci. 2008;11:95–102. doi: 10.1038/nn2020. [DOI] [PMC free article] [PubMed] [Google Scholar]
- Picard N, Strick PL. Motor areas of the medial wall: a review of their location and functional activation. Cereb Cortex. 1996;6:342–353. doi: 10.1093/cercor/6.3.342. [DOI] [PubMed] [Google Scholar]
- Plassmann H, O'Doherty J, Rangel A. Orbitofrontal cortex encodes willingness to pay in everyday economic transactions. J Neurosci. 2007;27:9984–9988. doi: 10.1523/JNEUROSCI.2131-07.2007. [DOI] [PMC free article] [PubMed] [Google Scholar]
- Platt ML, Glimcher PW. Neural correlates of decision variables in parietal cortex. Nature. 1999;400:233–238. doi: 10.1038/22268. [DOI] [PubMed] [Google Scholar]
- Rudebeck PH, Walton ME, Smyth AN, Bannerman DM, Rushworth MF. Separate neural pathways process different decision costs. Nat Neurosci. 2006;9:1161–1168. doi: 10.1038/nn1756. [DOI] [PubMed] [Google Scholar]
- Rushworth MF, Behrens TE. Choice, uncertainty and value in prefrontal and cingulate cortex. Nat Neurosci. 2008;11:389–397. doi: 10.1038/nn2066. [DOI] [PubMed] [Google Scholar]
- Rushworth MF, Kennerley SW, Walton ME. Cognitive neuroscience: resolving conflict in and over the medial frontal cortex. Curr Biol. 2005;15:R54–R56. doi: 10.1016/j.cub.2004.12.054. [DOI] [PubMed] [Google Scholar]
- Rushworth MF, Behrens TE, Rudebeck PH, Walton ME. Contrasting roles for cingulate and orbitofrontal cortex in decisions and social behaviour. Trends Cogn Sci. 2007;11:168–176. doi: 10.1016/j.tics.2007.01.004. [DOI] [PubMed] [Google Scholar]
- Schoenbaum G, Saddoris MP, Stalnaker TA. Reconciling the roles of orbitofrontal cortex in reversal learning and the encoding of outcome expectancies. Ann N Y Acad Sci. 2007;1121:320–335. doi: 10.1196/annals.1401.001. [DOI] [PMC free article] [PubMed] [Google Scholar]
- Seymour B, McClure SM. Anchors, scales and the relative coding of value in the brain. Curr Opin Neurobiol. 2008;18:173–178. doi: 10.1016/j.conb.2008.07.010. [DOI] [PubMed] [Google Scholar]
- Sugrue LP, Corrado GS, Newsome WT. Matching behavior and the representation of value in the parietal cortex. Science. 2004;304:1782–1787. doi: 10.1126/science.1094765. [DOI] [PubMed] [Google Scholar]
- Sutton RS, Barto AG. Reinforcement learning: an introduction. IEEE Trans Neural Netw. 1998;9:1054. [Google Scholar]
- Tom SM, Fox CR, Trepel C, Poldrack RA. The neural basis of loss aversion in decision-making under risk. Science. 2007;315:515–518. doi: 10.1126/science.1134239. [DOI] [PubMed] [Google Scholar]
- Tremblay L, Schultz W. Relative reward preference in primate orbitofrontal cortex. Nature. 1999;398:704–708. doi: 10.1038/19525. [DOI] [PubMed] [Google Scholar]
- Vulkan N. An economist's perspective on probability matching. J Econ Surv. 2000;14:101–118. [Google Scholar]