

Abstract
Aβ42 has been found to associate rapidly to neuronal cells and is the primary constituent of senile plaques. In this study we monitored the aggregation of Aβ42 with living PC12 cells. Using photobleaching Förster resonance energy transfer, we observed one set of aggregates that displayed colocalization and another that displayed energy transfer. Cell surface aggregates were found to become resistant to potassium iodide (KI)-induced quenching. Exposed Aβ42 regions were probed with three monoclonal antibodies directed against the N-terminus, an internal sequence, and the C-terminus of Aβ42. Two populations of aggregates were revealed: one that bound all three antibodies, and one that bound all but the C-terminus antibody. Of interest, using fluorescent recovery after photobleaching, we observed no Aβ42 exchange within either type of aggregate. These findings offer what we believe is new insight into the conformations of Aβ42 that accumulate on the surface of living cells. One conformation is incapable of energy transfer, is sensitive to KI, and binds C-terminus-specific antibodies. The other conformation increases in number over time, is capable of energy transfer, is quencher-resistant, and has a sequestered C-terminus. With further studies to characterize Aβ aggregation on live cells, the underlying mechanisms leading to Alzheimer's disease may be revealed.
Introduction
Alzheimer's disease (AD) is a progressive neurological disorder resulting from the deposition of amyloid β (Aβ) peptide into amyloid deposits, the appearance of neurofibrillary tangles, and selective neuronal loss. The most abundant forms of Aβ are 40 and 42 amino acid residues long and referred to as Aβ40 and Aβ42, respectively (1). Aβ is produced from sequential endoproteolytic cleavage of the amyloid precursor protein (APP). Aβ40 is the primary product of proteolytic cleavage from APP (2), but it has been shown that Aβ40 displays relatively slow association kinetics with neuronal cells, whereas Aβ42 associates rapidly with neuronal cells (3). Studies have shown that Aβ42 has a higher propensity to aggregate than Aβ40 (2–5) and is the primary constituent of senile plaques (6,7).
Many Aβ conformations have been proposed and characterized as intermediates in the pathway to formation of the amyloid fiber. Some of these structures include dimers, trimers, pentamers, high-molecular-weight Aβ-derived diffusible ligands, protofibrils, and fibrils (8–13). However, the mechanism underlying formation of Aβ aggregates within neuronal cells still remains unclear.
We previously established a versatile method for studying Aβ aggregation (3), in which Aβ is fluorescently labeled at the N-terminus and then added to live cells. This approach allowed us to monitor the rate of association with cells as well as their intrinsic aggregation rate (3). Here we sought to monitor structural aspects of the aggregation of Aβ42 with living cells. Using photobleaching Förster resonance energy transfer (pbFRET), specific domain-directed monoclonal antibodies, and a fluorescence quencher, we identified two distinct conformations of Aβ42 that form with living cells. Using fluorescent recovery after photobleaching (FRAP), we also noted the absence of peptide unit exchange within aggregates located on the cell surface.
Materials and Methods
Peptide synthesis and purification
Aβ42 was prepared by solid-phase synthesis on a PS-3 peptide synthesizer (Protein Technologies, Tucson, AZ) using Ala-PEG-PS resin (PerSeptive Biosystems, Ramsey, MN). An active ester coupling procedure employing O-(7-azabenzotriazol-1-yl)-1,1,3,3-tetramethyl-uronium hexafluorophosphate of 9-fluorenylmethoxycarbonyl amino acids was used. For fluorophore addition, before cleavage from the resin either Nα-(9-Fluorenylmethoxycarbonyl)-Nɛ-tetramethylrhodamine-(5-carbonyl)-L-lysine (TMR, F11830; Molecular Probes, Eugene, OR) or 6-carboxyfluorescein (FAM, C0662; Sigma, St. Louis, MO) were coupled to the N-terminus via a glycine linker. The peptides were cleaved from the resin with a mixture of trifluoroacetic acid, thioanisole, m-cresol, and ethanedithiol (81:13:1:5 v/v). After incubation for 45 min at 25°C, the resin was removed by filtration. After incubation for an additional 3 h at 25°C, the volume was reduced and peptides were precipitated and washed in cold ethyl ether. The crude peptides were dissolved in 6.5 M guanidine hydrochloride (pH 10) and purified by high-performance liquid chromatography using a Superdex Tricorn 10/300 GL Peptide column (Amersham Biosciences, Piscataway, NJ) with 30 mM NH4OH running buffer. To maintain stock peptide solutions free from fibril seeds, solutions were stored at pH 10 and 4°C immediately after chromatographic separation of monomeric peptides. These conditions were previously shown to maintain the monomeric state (10,14,15). Peptide purity and identity was confirmed with the use of both matrix-assisted laser desorption/ionization mass spectrometry and amino acid analysis. Concentrations of stock peptide solutions that were free of fibril seeds were determined by amino acid analysis and confirmed by either tyrosine absorbance (275 nm, ɛ = 1390 cm−1 M−1), TMR absorbance (550 nm, ɛ = 92000 cm−1 M−1), or FAM absorbance (488 nm, ɛ = 87000 cm−1 M−1) for labeled peptides.
Cell culture
Cell lines were maintained in Dulbecco's modified Eagle's medium (nutrient mixture F-12 1:1 (DMEM/F12), 12500; Gibco, Burlington, Ontario, Canada) containing 10% fetal bovine serum (HyClone, Logan, UT) with 100 U/mL penicillin and 100 μg/mL of streptomycin. To induce differentiation of PC12 cells to resemble sympathetic neurons, the cells were plated at 2.2 × 10⁴ cells/cm2 in Lab-tech chambered coverglass chambers and suspended in phenol red free DMEM/F12 (21041; Gibco) containing N2 supplement and 10 ng/mL nerve growth factor. Cells were differentiated for 72 h before media was replaced and peptide treatments were performed. Cells were maintained at 37°C in a humidified incubator with 5% carbon dioxide.
Fluorimeter FRET measurements
The FAM-only sample was prepared using 10 μM unlabeled Aβ42 and 10μM FAM-Aβ42, with pH 5 reduction using 2 mM HCl. The TMR-only sample was prepared using 10 μM unlabeled Aβ42 and 10μM TMR-Aβ42, with pH 5 reduction using 2 mM HCl. The Mix sample was prepared using 10 μM TMR-Aβ42 and 10μM FAM-Aβ42, with pH 5 reduction using 2 mM HCl. Emission wavelength spectra were collected using 488 nm excitation on a PTI fluorimeter with 3-nm slit widths after peptide incubation at 20°C for 90 min.
pbFRET measurements
When an acceptor fluorophore is in close proximity to a donor fluorophore, the photobleaching of that donor proceeds more slowly than in the absence of the acceptor; this is the basis behind pbFRET (16,17). The two photobleaching rates for the donor under the same conditions are used to calculate the FRET efficiency (16,17). PC12 cells were treated with 1 μM unlabeled Aβ42 and 1μM FAM-Aβ42 (for the FAM-only sample) or 1 μM TMR-Aβ42 and 1μM FAM-Aβ42 (for the Mix sample) for 1, 6, 12, and 24 h. Fluorescent images were taken with a Zeiss LSM 510 META confocal laser-scanning microscope with a 40× water immersion objective and a 1.2 numerical aperture. Images were initially collected using a 488 nm Argon laser at 2% power with a band-pass (BP) filter 500–550 nm (FAM-only and Mix samples) and 543 nm HeNe laser at 75% power with a BP filter 565–615 nm (Mix samples). For pbFRET data sets, λ mode was selected for monitoring at spectral wavelengths 527 nm and 591 nm with 458 nm and 488 nm Argon laser lines at 45% power for 527 s with 60 collected frames. At least two aggregate regions were selected per cell from fields of view with at least 20 cells from three independent experiments performed in duplicate, resulting in >300 aggregates analyzed per condition. Fluorescent decay was calculated over the time series using ImageJ version 1.37v. Single exponential curve fits and graphs were prepared using Microcal Origin 7.0 SR4 with the following equation:
where A is the amplitude of the curve and t is the time constant. The transfer efficiency (E) was calculated using the following equation:
where tFam is the time constant calculated for the FAM-Aβ42-only sample at a given treatment time, and tMix is the time constant calculated for the Mix sample at the same treatment time. Histograms and bar graphs were prepared using Microsoft Excel. The displayed images represent a single cross section through the center of the cells.
Immunoblotting
Aβ42 (concentrations 500 ng to 10 pg) was spotted onto polyvinylidene fluoride (PVDF) membranes. Membranes were blocked in 5% (w/v) powdered milk, 0.05% (v/v) Tween 20 in PBS for 2 h, followed by 1-h treatment with 2 μg/mL of either 6E10 antibody (A1474; Sigma), 4G8 antibody (MAB1561; Chemicon, Billerica, MA), or 12F4 antibody (05-831; Upstate). For detection, 1:5000 dilution of secondary goat anti-rabbit peroxidase conjugated antibody (401353; Calbiochem, La Jolla, CA) was used and visualized with enhanced chemiluminescence reagent plus (RPN2132; Amersham, Buckinghamshire, UK). Exposed films were developed for 10 min.
Immunostaining Aβ on the surface of live PC12 cells
PC12 cells treated with unlabeled Aβ42 (2 μM) for 2 h at 37°C were washed once with cold blocking solution containing 1% BSA (Fisher Scientific, Nepean, ON) and 0.1% sodium azide in phosphate-buffered saline without calcium and magnesium (D-PBS), followed by incubation for 15 min at 4°C in cold blocking solution. The N-terminus region was detected by 10 μg/mL of 6E10 antibody (A1474; Sigma), an internal peptide sequence was detected by 10 μg/mL of 4G8 antibody (MAB1561; Chemicon), and the C-terminus region was detected using 10 μL/mL of 12F4 antibody (05-831; Upstate). Cells were incubated for 25 min with primary antibody followed by washing with cold blocking solution, and for 25 min with 10 μg/mL secondary antibody, rabbit anti-mouse Alexa fluor 488 conjugated antibody (A-11059; Gibco-Invitrogen) at 4°C in cold blocking solution. After antibody removal and washing with cold blocking solution, cells were mechanically detached with D-PBS. Collected cells were centrifuged (200 × g for 1 min) and resuspended in cold flow buffer containing 5 mM EDTA and 1% BSA (Fisher Scientific, Nepean, ON) in D-PBS. Samples were immediately analyzed with a FACS Calibur flow cytometer (Becton Dickinson, Mississauga, ON). Alexa fluor 488 fluorescence was detected, with 2.5 × 10⁴ live events collected per sample with a 100–300 events/s flow rate. Cell viability was assessed and gated with exclusion of 25 μg/mL 7-Aminoactinomycin D (7-AAD) treatment for 5 min. Data collection and analysis were performed using Cell Quest version 3.3, and figures were created using WinMDI version 2.8 software.
Potassium iodide quenching
PC12 cells were treated with 2 μM TMR-Aβ42 for 1, 6, 12, and 24 h. Media were removed and replaced with D-PBS, and fluorescent image stacks were collected before and after 30-min treatment with 300 mM potassium iodide using a Zeiss LSM 510 META confocal laser-scanning microscope. The displayed images represent a single cross section through the center of the cells and were prepared using ImageJ version 1.37v.
FRAP measurements
PC12 cells were treated with 2 μM FAM-Aβ42 for 1, 6, 12, and 24 h. Two initial images were collected using a 488 nm Argon laser at 2% power with a BP filter (500–550 nm). Selected aggregate regions were photobleached for 20 s using 458 nm and 488 nm Argon laser lines at 50% power. Images were then collected using a 488 nm Argon laser at 2% power, with 100 images acquired for total of 638 s. Fluorescence was calculated over the time series using ImageJ version 1.37v. The graphs were prepared using Microcal Origin 7.0 SR4 with an average of 10 photobleached regions and 10 nonphotobleached regions, and all were normalized to the same initial fluorescent value.
Results
Colocalization and energy transfer
To study Aβ on the surface of live cells, we synthesized and fluorescently labeled Aβ42. Of importance, synthesized Aβ was maintained in solution from synthesis to purification and storage, as these conditions are known to significantly reduce the formation of large Aβ aggregates (10,14,15). We covalently attached either FAM or TMR to the N-terminus of Aβ via a flexible glycine linker to generate FAM-Aβ42 or TMR-Aβ42, respectively. The N-terminus is highly accessible (18,19), and it has been shown that attaching a fluorescent label does not alter its amyloidogenic properties (3,10,20) or solubility behavior (21,22). FAM and TMR fluorophores were selected because they do not selectively partition into any particular subcellular organelle or microenvironment (23,24) and their fluorescence properties are ideal for confocal microscopy (16,25).
We compared the effects of treating live differentiated PC12 cells (which are derived from a pheochromocytoma of the rat adrenal medulla) with FAM-Aβ42 alone or in combination with TMR-Aβ42 (Mix). After 24-h treatments with either FAM-Aβ42 or Mix, confocal microscopy of a plane within individual PC12 cells was imaged. The distinct staining pattern of Aβ42 was observed on the cell body, neuritic extensions, and within the cell (Fig. 1). Similar staining patterns were observed when imaging was performed with lasers and filters specific for FAM (shown in green, Fig. 1 A) and for TMR (shown in red, Fig. 1 B), with the merged image highlighting colocalization (shown in yellow, Fig. 1 C). Using a Zeiss spectral META detector and specific FAM lasers, we monitored the specific emission wavelength for FAM (Fig. 1 D) and TMR (Fig. 1 E). Highlighted in yellow (Fig. 1 F) are regions where strong energy transfer between these fluorophores was detected. FAM- and TMR-labeled Aβ42 appeared to make an excellent donor/acceptor FRET pair. In the Mix sample we observed quenching of FAM emission and increased TMR fluorescence when only FAM was excited (see Fig. S1 in the Supporting Material). pbFRET was observed for specific aggregates (Fig. 1 g) where the excited FAM transferred its energy to TMR, reducing its photodegradation rate. Selecting two aggregates that displayed colocalization (Fig. 1, A and B) and photobleaching for 527 s, we observed that the first aggregate photobleached at a rate similar to that of FAM alone, as reflected by similar time constants (Fig. 1 J). The second aggregate photobleached much more slowly with a longer time constant, indicating energy transfer (Fig. 1 K). Similar time constants were observed for treatment of living PC12 cells with FAM alone over various treatment times (Fig. 2). For the Mix samples, we observed increasing average time constants with increasing treatment time (Fig. 2). Monitoring aggregates on the cell body versus the cell neurite revealed that the average transfer efficiency for the aggregates located on the cell body after 24 h of treatment was similar to that for aggregates on the neurites after only 6 h of treatment (Fig. 2). However, the distribution of transfer efficiency for the various time points seemed to indicate two key populations: aggregates that have no energy transfer, and aggregates that transfer energy to varying degrees (Fig. 3). The presence of these two aggregate populations on the cell surface indicates that there is a population of aggregates in which the peptide units are closely packed to allow energy transfer, and another aggregate population in which the peptide units are spaced apart and incapable of energy transfer. A very different distribution was observed when we compared aggregates on the surface of living PC12 cells with internalized aggregates (Fig. 4). The internalized aggregates were observed to have an average transfer efficiency of 0.6, with most of the observed aggregates allowing for energy transfer (Fig. 4). This finding suggests that the process of internalization causes increased compaction of the aggregates.
Figure 1.

Colocalization and pbFRET aggregates of Aβ42 with live PC12 cells treated for 24 h. All images were taken through the center of the cells. Scale bars are 10 μm. (A) Mix sample monitoring with a BP filter for the total FAM signal. (B) Mix sample monitoring with a BP filter for the total TMR signal. (C) Merged imaged of FAM and TMR total signals. (D) Mix sample exciting FAM and monitoring the initial FAM signal at a spectral wavelength of 527 nm. (E) Mix sample exciting FAM and monitoring the initial TMR signal at a spectral wavelength of 591 nm. (F) Merge of initial FAM and TMR signals. (G) Mix sample exciting FAM and monitoring the final FAM signal at a spectral wavelength of 527 nm. (H) Mix sample exciting FAM and monitoring the final TMR signal at a spectral wavelength of 591 nm. (I) Merge of final FAM and TMR signals after 527 s of bleaching. (J) Fluorescent decay curve for Mix region 1 compared with FAM-alone decay curve. (K) Fluorescent decay curve for Mix region 2 compared with FAM-alone decay curve.
Figure 2.
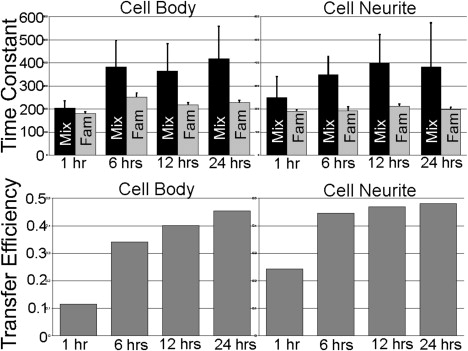
Time constant and transfer efficiency averages calculated for Aβ42 over time. The time constants for FAM-Aβ42 were similar for all treatments. Error bars are indicated as the standard deviation from at least three independent experiments. For each cell, two to five aggregate regions were selected from fields of view, with at least 20 cells from three independent experiments performed in duplicate, resulting in over 300 aggregates analyzed for each Aβ42 time point.
Figure 3.
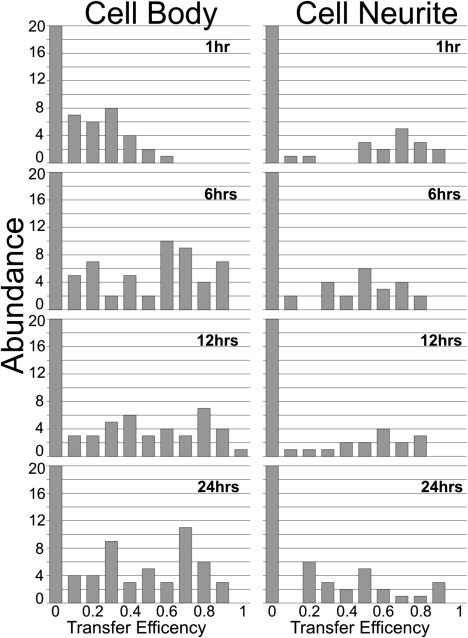
Transfer efficiency histograms obtained for all Aβ42 time samples. For each cell, 2–5 aggregate regions were selected from fields of view, with at least 20 cells from three independent experiments performed in duplicate, resulting in over 300 aggregates analyzed for each Aβ42 time point.
Figure 4.
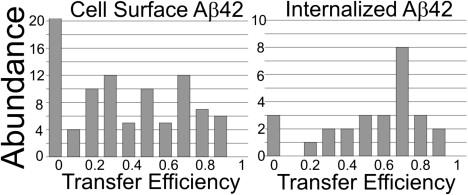
Comparison of transfer efficiencies for cell surface versus internalized Ab42 aggregates. Three independent experiments were performed in duplicate, yielding fields of view with at least 20 cells. For each cell, 2–5 aggregate regions were selected, resulting in ∼300 surface aggregates and 100 internalized aggregates analyzed for each 24-h Aβ42 treatment.
Accessible and restricted aggregates
To investigate which regions of Aβ42 within the aggregates were exposed, we treated live PC12 cells with unlabeled Aβ42 for 2 h, followed by treatment with one of three monoclonal mouse antibodies targeted to a specific region of Aβ42. Antibodies were added in high excess to PC12 cells because their detection concentration was observed to vary by dot blot analysis (Fig. S2). Using flow cytometry, we also observed two key populations of aggregates: one that stained with all three antibodies, and one that stained primarily with the internal sequence and N-terminus-specific antibodies (Fig. 5). The exclusion of the C-terminus antibody indicates that these aggregates may be more compact with the C-termini buried and represent a smaller fraction of the total number of observed events (Fig. 5). The population that stained with the C-terminus antibody may correlate with the population that is incapable of energy transfer, as both observations are consistent with the larger fraction of the total number of observed events.
Figure 5.
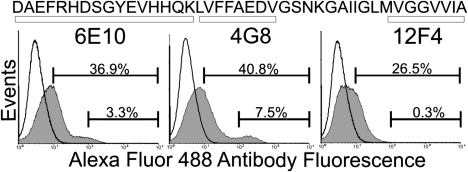
Accessibility of aggregates to region-specific monoclonal antibodies. The Aβ42 sequence is indicated with box regions specifying the recognition regions for each antibody. Flow cytometry histograms indicate signals from untreated cells (thick black line) and specific antibody-treated cells (solid gray area).
To further assess the level of aggregate compaction, we utilized potassium iodide (KI), which is a small molecule quencher of fluorescence (26,27). After using KI to treat aggregates that formed on the surface of PC12 cells, we found that the majority of the aggregates were quenched (Fig. 6). With increasing exposure time of the cells to Aβ42, there were visually more KI resistant aggregates on the surface of living PC12 cells (Fig. 6). However, a distribution of surface aggregates was observed with KI-sensitive aggregates and KI-resistant aggregates, even for the 24-h Aβ42 treatment (Fig. 6).
Figure 6.

Susceptibility of Aβ42 aggregates to small molecular quencher KI over time. All images were taken through the center of the cells with 10 μm scale bars. The length of time the cells were exposed to Aβ42 is indicated on the left.
Nonexchanging aggregates
We monitored the peptide unit exchange rate within an aggregate using photobleaching (i.e., the rate of FRAP indicates unbleached peptides exchanging for photobleached peptides within an aggregate). Over all the treatment times during which FAM-Aβ42 was added to PC12 cells, no recovery from photobleaching was observed (Fig. 7). The global fluorescence within the aggregates did not recover from the photobleaching event (Fig. 7). This may indicate that very few peptide units exchange within the aggregates, or that the period for peptide exchange is much greater than the period monitored. Alternatively, these results may indicate that once the peptide associates into an aggregate, it is locked into place, allowing for further deposition of peptide units into this aggregate.
Figure 7.
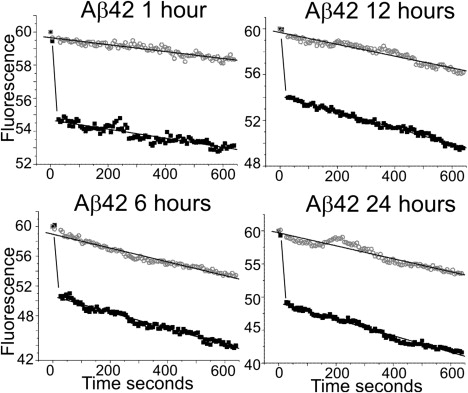
Peptide exchange within Aβ42 aggregates is absent over all treatment times. The normalized fluorescent signal was plotted versus time for each average fluorescent recovery experiment. The bleached sample slopes (black box) are approximately equal to the nonbleached sample slopes (open gray circle), indicating lack of fluorescent recovery.
Discussion
To model AD at the cellular and molecular levels, many investigators have used dyes, radioactive Aβ, and antibodies to study the interactions of Aβ with cell cultures (28–36). However, these approaches carry certain limitations, including the inability to easily monitor aggregation progression in real time on live cells. To overcome such limitations, we developed a versatile approach that involves treating live cells with Aβ that has been N-terminally linked with fluorophores. Using this approach, we previously showed a correlation between the aggregation propensity of Alzheimer amyloid-β peptides and their cell surface association kinetics with neuronal cells (3). In addition, our findings revealed a punctate staining pattern that is similar to images collected with antibodies directed specifically against oligomeric structural forms of Aβ (33,34). Furthermore, our technique allows images to be obtained with live cells throughout the progression of Aβ aggregation and its multitude of intermediate states.
In this study, we adapted our fluorescence imaging technique to further understand how Aβ42 aggregates during its interaction with living cells. Treating live PC12 cells with a combination of FAM-Aβ42 and TMR-Aβ42, we observed colocalization of fluorescent signals (Fig. 1 C), energy transfer (Fig. 1 F), and pbFRET (Fig. 1 I). In addition, our transfer efficiency analyses showed that there were two major aggregate populations at all of the analyzed treatment times (Fig. 3), and these populations could be distinguished based on whether they were or were not transferring energy. After comparing the histograms from cell surface versus internalized aggregates (Fig. 4), we observed that the latter were more prone to transfer energy. This finding may indicate that the more compact aggregates that are capable of energy transfer are internalized, or that the act of cell internalization allows for aggregate compaction and greater energy transfer. These results indicate the existence of two aggregate conformations that differ in their level of compaction for energy transfer.
To further investigate the compaction of the cell surface aggregates, we probed them with KI. This set of experiments revealed two populations that were either sensitive or resistant to KI, and showed that the resistance to KI increased over the time that PC12 cells were treated (Fig. 6). To determine which regions of the surface aggregates were exposed, we used flow cytometry to test whether monoclonal antibodies specific for one of three Aβ42 regions could stain the aggregates. Again, we uncovered two key aggregate populations (Fig. 5): a large population that stained with all three domain-specific antibodies, and a small population that did not stain with the C-terminus-specific antibody. These experiments were conducted with an extreme excess of antibodies, as varied Aβ42 detection concentration was observed (Fig. S2). This observed variation could have been due to either the antibody detection limit or the availability of the exposed region against which the antibody was directed.
Strikingly, we observed the absence of FRAP with all of the varied Aβ42 treatment times (Fig. 7). These results may indicate that once the aggregation seeds have formed on the surface of cells, the addition of peptide units is essentially irreversible. However, it may also be possible that the rate of exchange for individual peptide units is on the order of hours and hence would not be detected with our method. Alternatively, the number of peptide units capable of exchange within an aggregate may be extremely small, and even though the units may exchange, the actual number may be below our detection limit.
These findings offer what we believe is new insight into the conformations of Aβ42 accumulating on the surface of living cells. With further live cell studies and continued characterization of the aggregation events, the underlying mechanisms leading to Alzheimer's disease may be elucidated, allowing for the development of novel therapeutics against specific conformational targets.
Acknowledgments
We thank Miriam Mossoba for helpful suggestions and proofreading the manuscript.
This study was supported by the Neuromuscular Research Partnership-Canadian Institute of Health Research, ALS Society (Canada), and Muscular Dystrophy Association (Canada) (A.C.). D.A.B. was supported by a scholarship from the Natural Sciences and Engineering Research Council of Canada and a Scace graduate fellowship.
Supporting Material
References
- 1.Glenner G.G., Wong C.W. Alzheimer's disease: initial report of the purification and characterization of a novel cerebrovascular amyloid protein. Biochem. Biophys. Res. Commun. 1984;120:885–890. doi: 10.1016/s0006-291x(84)80190-4. [DOI] [PubMed] [Google Scholar]
- 2.Selkoe D.J. Alzheimer's disease: genes, proteins, and therapy. Physiol. Rev. 2001;81:741–766. doi: 10.1152/physrev.2001.81.2.741. [DOI] [PubMed] [Google Scholar]
- 3.Bateman D.A., McLaurin J., Chakrabartty A. Requirement of aggregation propensity of Alzheimer amyloid peptides for neuronal cell surface binding. BMC Neurosci. 2007;8:29. doi: 10.1186/1471-2202-8-29. [DOI] [PMC free article] [PubMed] [Google Scholar]
- 4.Kim W., Hecht M.H. Sequence determinants of enhanced amyloidogenicity of Alzheimer A{β}42 peptide relative to A{β}40. J. Biol. Chem. 2005;280:35069–35076. doi: 10.1074/jbc.M505763200. [DOI] [PubMed] [Google Scholar]
- 5.Pawar A.P., Dubay K.F., Zurdo J., Chiti F., Vendruscolo M. Prediction of “aggregation-prone” and “aggregation-susceptible” regions in proteins associated with neurodegenerative diseases. J. Mol. Biol. 2005;350:379–392. doi: 10.1016/j.jmb.2005.04.016. [DOI] [PubMed] [Google Scholar]
- 6.Roher A.E., Lowenson J.D., Clarke S., Woods A.S., Cotter R.J. β-Amyloid-(1–42) is a major component of cerebrovascular amyloid deposits: implications for the pathology of Alzheimer disease. Proc. Natl. Acad. Sci. USA. 1993;90:10836–10840. doi: 10.1073/pnas.90.22.10836. [DOI] [PMC free article] [PubMed] [Google Scholar]
- 7.Gravina S.A., Ho L., Eckman C.B., Long K.E., Otvos L.J. Amyloid β protein (A β) in Alzheimer's disease brain. Biochemical and immunocytochemical analysis with antibodies specific for forms ending at A β 40 or A β 42(43) J. Biol. Chem. 1995;270:7013–7016. doi: 10.1074/jbc.270.13.7013. [DOI] [PubMed] [Google Scholar]
- 8.Stine W.B.J., Snyder S.W., Ladror U.S., Wade W.S., Miller M.F. The nanometer-scale structure of amyloid-β visualized by atomic force microscopy. J. Protein Chem. 1996;15:193–203. doi: 10.1007/BF01887400. [DOI] [PubMed] [Google Scholar]
- 9.Lambert M.P., Barlow A.K., Chromy B.A., Edwards C., Freed R. Diffusible, nonfibrillar ligands derived from Aβ 1–42 are potent central nervous system neurotoxins. Proc. Natl. Acad. Sci. USA. 1998;95:6448–6453. doi: 10.1073/pnas.95.11.6448. [DOI] [PMC free article] [PubMed] [Google Scholar]
- 10.Huang T.H., Yang D.S., Plaskos N.P., Go S., Yip C.M. Structural studies of soluble oligomers of the Alzheimer β-amyloid peptide. J. Mol. Biol. 2000;297:73–87. doi: 10.1006/jmbi.2000.3559. [DOI] [PubMed] [Google Scholar]
- 11.Podlisny M.B., Walsh D.M., Amarante P., Ostaszewski B.L., Stimson E.R. Oligomerization of endogenous and synthetic amyloid β-protein at nanomolar levels in cell culture and stabilization of monomer by Congo red. Biochemistry. 1998;37:3602–3611. doi: 10.1021/bi972029u. [DOI] [PubMed] [Google Scholar]
- 12.Walsh D.M., Hartley D.M., Kusumoto Y., Fezoui Y., Condron M.M. Amyloid β-protein fibrillogenesis Structure and biological activity of protofibrillar intermediates. J. Biol. Chem. 1999;274:25945–25952. doi: 10.1074/jbc.274.36.25945. [DOI] [PubMed] [Google Scholar]
- 13.Klyubin I., Betts V., Welzel A.T., Blennow K., Zetterberg H. Amyloid β protein dimer-containing human CSF disrupts synaptic plasticity: prevention by systemic passive immunization. J. Neurosci. 2008;28:4231–4237. doi: 10.1523/JNEUROSCI.5161-07.2008. [DOI] [PMC free article] [PubMed] [Google Scholar]
- 14.Fezoui Y., Hartley D.M., Harper J.D., Khurana R., Walsh D.M. An improved method of preparing the amyloid β-protein for fibrillogenesis and neurotoxicity experiments. Amyloid. 2000;7:166–178. doi: 10.3109/13506120009146831. [DOI] [PubMed] [Google Scholar]
- 15.Teplow D.B. Preparation of amyloid β-protein for structural and functional studies. Methods Enzymol. 2006;413:20–33. doi: 10.1016/S0076-6879(06)13002-5. [DOI] [PubMed] [Google Scholar]
- 16.Young R.M., Arnette J.K., Roess D.A., Barisas B.G. Quantitation of fluorescence energy transfer between cell surface proteins via fluorescence donor photobleaching kinetics. Biophys. J. 1994;67:881–888. doi: 10.1016/S0006-3495(94)80549-1. [DOI] [PMC free article] [PubMed] [Google Scholar]
- 17.Kubitscheck U., Kircheis M., Schweitzer-Stenner R., Dreybrodt W., Jovin T.M. Fluorescence resonance energy transfer on single living cells. Application to binding of monovalent haptens to cell-bound immunoglobulin E. Biophys. J. 1991;60:307–318. doi: 10.1016/S0006-3495(91)82055-0. [DOI] [PMC free article] [PubMed] [Google Scholar]
- 18.Kheterpal I., Williams A., Murphy C., Bledsoe B., Wetzel R. Structural features of the Aβ amyloid fibril elucidated by limited proteolysis. Biochemistry. 2001;40:11757–11767. doi: 10.1021/bi010805z. [DOI] [PubMed] [Google Scholar]
- 19.Petkova A.T., Yau W., Tycko R. Experimental constraints on quaternary structure in Alzheimer's β-amyloid fibrils. Biochemistry. 2006;45:498–512. doi: 10.1021/bi051952q. [DOI] [PMC free article] [PubMed] [Google Scholar]
- 20.Huang T.H., Fraser P.E., Chakrabartty A. Fibrillogenesis of Alzheimer Aβ peptides studied by fluorescence energy transfer. J. Mol. Biol. 1997;269:214–224. doi: 10.1006/jmbi.1997.1050. [DOI] [PubMed] [Google Scholar]
- 21.Sengupta P., Garai K., Sahoo B., Shi Y., Callaway D.J.E. The amyloid β peptide (Aβ (1–40)) is thermodynamically soluble at physiological concentrations. Biochemistry. 2003;42:10506–10513. doi: 10.1021/bi0341410. [DOI] [PubMed] [Google Scholar]
- 22.Tjernberg L.O., Pramanik A., Björling S., Thyberg P., Thyberg J. Amyloid β-peptide polymerization studied using fluorescence correlation spectroscopy. Chem. Biol. 1999;6:53–62. doi: 10.1016/S1074-5521(99)80020-9. [DOI] [PubMed] [Google Scholar]
- 23.Hazum E., Cuatrecasas P., Marian J., Conn P.M. Receptor-mediated internalization of fluorescent gonadotropin-releasing hormone by pituitary gonadotropes. Proc. Natl. Acad. Sci. USA. 1980;77:6692–6695. doi: 10.1073/pnas.77.11.6692. [DOI] [PMC free article] [PubMed] [Google Scholar]
- 24.Smith M.L., Carski T.R., Griffin C.W. Modification of fluorescent-antibody procedures employing crystalline tetramethylrhodamine isothiocyanate. J. Bacteriol. 1962;83:1358–1359. doi: 10.1128/jb.83.6.1358-1359.1962. [DOI] [PMC free article] [PubMed] [Google Scholar]
- 25.Slavik J. CRC Press; Boca Raton, FL: 1994. Fluorescent Probes in Cellular and Molecular Biology. [Google Scholar]
- 26.Baneyx G., Vogel V. Self-assembly of fibronectin into fibrillar networks underneath dipalmitoyl phosphatidylcholine monolayers: role of lipid matrix and tensile forces. Proc. Natl. Acad. Sci. USA. 1999;96:12518–12523. doi: 10.1073/pnas.96.22.12518. [DOI] [PMC free article] [PubMed] [Google Scholar]
- 27.Umberger J.Q., LaMer V.K. The kinetics of diffusion controlled molecular and ionic reactions in solution as determined by measurements of the quenching of fluorescence. J. Am. Chem. Soc. 1945;67:1099–1109. [Google Scholar]
- 28.Klunk W.E., Bacskai B.J., Mathis C.A., Kajdasz S.T., McLellan M.E. Imaging Aβ plaques in living transgenic mice with multiphoton microscopy and methoxy-X04, a systemically administered Congo red derivative. J. Neuropathol. Exp. Neurol. 2002;61:797–805. doi: 10.1093/jnen/61.9.797. [DOI] [PubMed] [Google Scholar]
- 29.Kung M., Hou C., Zhuang Z., Zhang B., Skovronsky D. IMPY: an improved thioflavin-T derivative for in vivo labeling of β-amyloid plaques. Brain Res. 2002;956:202–210. doi: 10.1016/s0006-8993(02)03436-4. [DOI] [PubMed] [Google Scholar]
- 30.Maggio J.E., Stimson E.R., Ghilardi J.R., Allen C.J., Dahl C.E. Reversible in vitro growth of Alzheimer disease β-amyloid plaques by deposition of labeled amyloid peptide. Proc. Natl. Acad. Sci. USA. 1992;89:5462–5466. doi: 10.1073/pnas.89.12.5462. [DOI] [PMC free article] [PubMed] [Google Scholar]
- 31.Burdick D., Kosmoski J., Knauer M.F., Glabe C.G. Preferential adsorption, internalization and resistance to degradation of the major isoform of the Alzheimer's amyloid peptide, A β 1–42, in differentiated PC12 cells. Brain Res. 1997;746:275–284. doi: 10.1016/s0006-8993(96)01262-0. [DOI] [PubMed] [Google Scholar]
- 32.Lambert M.P., Viola K.L., Chromy B.A., Chang L., Morgan T.E. Vaccination with soluble Aβ oligomers generates toxicity-neutralizing antibodies. J. Neurochem. 2001;79:595–605. doi: 10.1046/j.1471-4159.2001.00592.x. [DOI] [PubMed] [Google Scholar]
- 33.Kayed R., Head E., Thompson J.L., McIntire T.M., Milton S.C. Common structure of soluble amyloid oligomers implies common mechanism of pathogenesis. Science. 2003;300:486–489. doi: 10.1126/science.1079469. [DOI] [PubMed] [Google Scholar]
- 34.Lacor P.N., Buniel M.C., Chang L., Fernandez S.J., Gong Y. Synaptic targeting by Alzheimer's-related amyloid β oligomers. J. Neurosci. 2004;24:10191–10200. doi: 10.1523/JNEUROSCI.3432-04.2004. [DOI] [PMC free article] [PubMed] [Google Scholar]
- 35.Kokubo H., Kayed R., Glabe C.G., Yamaguchi H. Soluble Aβ oligomers ultrastructurally localize to cell processes and might be related to synaptic dysfunction in Alzheimer's disease brain. Brain Res. 2005;1031:222–228. doi: 10.1016/j.brainres.2004.10.041. [DOI] [PubMed] [Google Scholar]
- 36.Lee E.B., Leng L.Z., Zhang B., Kwong L., Trojanowski J.Q. Targeting amyloid-β peptide (Aβ) oligomers by passive immunization with a conformation-selective monoclonal antibody improves learning and memory in Aβ precursor protein (APP) transgenic mice. J. Biol. Chem. 2006;281:4292–4299. doi: 10.1074/jbc.M511018200. [DOI] [PubMed] [Google Scholar]
Associated Data
This section collects any data citations, data availability statements, or supplementary materials included in this article.