

Abstract
Fluorescent protein voltage sensors are recombinant proteins that are designed as genetically encoded cellular probes of membrane potential using mechanisms of voltage-dependent modulation of fluorescence. Several such proteins, including VSFP2.3 and VSFP3.1, were recently reported with reliable function in mammalian cells. They were designed as molecular fusions of the voltage sensor of Ciona intestinalis voltage sensor containing phosphatase with a fluorescence reporter domain. Expression of these proteins in cell membranes is accompanied by additional dynamic membrane capacitance, or “sensing capacitance”, with feedback effect on the native electro-responsiveness of targeted cells. We used recordings of sensing currents and fluorescence responses of VSFP2.3 and of VSFP3.1 to derive kinetic models of the voltage-dependent signaling of these proteins. Using computational neuron simulations, we quantitatively investigated the perturbing effects of sensing capacitance on the input/output relationship in two central neuron models, a cerebellar Purkinje and a layer 5 pyramidal neuron. Probe-induced sensing capacitance manifested as time shifts of action potentials and increased synaptic input thresholds for somatic action potential initiation with linear dependence on the membrane density of the probe. Whereas the fluorescence signal/noise grows with the square root of the surface density of the probe, the growth of sensing capacitance is linear. We analyzed the trade-off between minimization of sensing capacitance and signal/noise of the optical read-out depending on kinetic properties and cellular distribution of the probe. The simulation results suggest ways to reduce capacitive effects at a given level of signal/noise. Yet, the simulations indicate that significant improvement of existing probes will still be required to report action potentials in individual neurons in mammalian brain tissue in single trials.
Introduction
The electrical properties of single neurons can be studied in great detail by electrophysiological methods in vitro and in vivo. However, for a simultaneous readout of electrical activity from large numbers of neurons in brain tissue, noninvasive optical imaging techniques are advantageous over microelectrode assemblies. Whereas optical potentiometric probes based on electrochromic organic dyes (1–4) are capable to report electrical events in excitable cells on a millisecond timescale (5–8), their use in mammalian tissue is restricted because of nonspecific labeling of membranes and dye phototoxicity (9,10). Recombinant proteins designed as optical sensors of membrane voltage (voltage-sensitive fluorescent proteins (VSFPs)) (11–16) can potentially overcome these problems. As they are encoded into DNA, these probes are introduced into cells through methods of gene transfer. By placing the expression under control of cell-specific promoters, the probes can be targeted to subtypes of neurons with the aim to differentiate membrane voltage signals from genetically dissected elements of neuronal circuits (17,18).
The first protein based voltage probe with reliable function in mammalian cells, named VSFP2.1, was constructed as a fusion between the voltage sensing domain of Ci-VSP (Ciona intestinalis voltage sensor containing phosphatase) and a fluorescence reporter composed of a pair of cyan and yellow fluorescent proteins (FPs) (14) (Fig. 1 A). An improved version, VSFP2.3, was derived from VSFP2.1 by optimization of the interdomain linker (15,18,19). A further development, VSFP3.1, differs from VSFP2.3 by having only a single cyan FP reporter, instead of the cyan/yellow FP pair in VSFP2.3 and a shortened domain linker (S4 to FP) (15). The voltage-sensing domain (S1 to S4) of Ci-VSP (and hence of VSFP2.3 and VSFP3.1) is homologous to voltage sensing domains (VSDs) of voltage-gated potassium channels. In particular, it includes a series of arginine repeats on every third position in S4 (20) known to be essential for ion channel voltage sensitivity (21–26). Activation of the Ci-VSP voltage sensor is accompanied by an outward sensing current (15,20,27) analogous to gating currents of ion channels (28). All this suggests a homologous mechanism of voltage sensing by voltage-activated S4 movement and concurrent displacement of sensing charge between the cytosolic and the external face of the membrane (Fig. 1 B).
Figure 1.
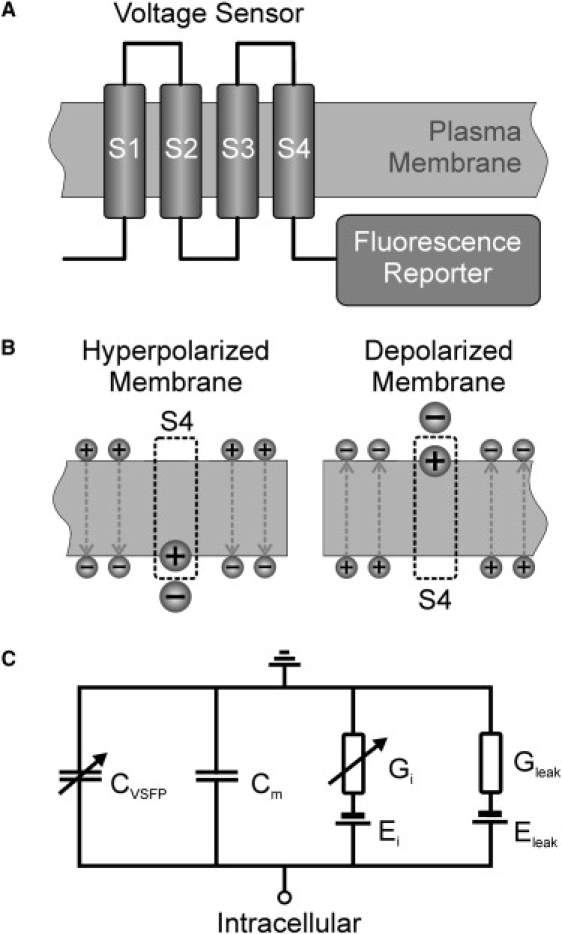
Capacitive sensing currents are inherent to the function of voltage sensor domain (VSD)-based fluorescent protein (FP) voltage sensors. (A) Principal topology of voltage-sensitive fluorescent proteins (VSFPs): a voltage sensor comprising four transmembrane segments (S1–S4) is linked at its C-terminal end to a FP reporter domain consisting of either a single or a pair of fluorescent proteins. (B) Schematic illustration of the membrane charge distribution emphasizing the depolarization-induced translocation of S4 sensing charge from the cytosolic to the extracellular side together with the change of ionic surface charge. (C) Electrical equivalent circuit of a patch of neuronal membrane including a dynamic sensing capacitance, CVSFP, to account for the sensing currents of VSFP membrane proteins. Cm is the linear membrane capacitance, Gi represents active membrane conductances with reversal potentials Ei (i = Na+, K+, Cl−, Ca2+), Gleak the membrane leak conductance with reversal potential Eleak.
Mobile intrinsic charges directly impact on the biophysics of membranes (29). In particular, they contribute to dielectric polarization in the presence of external electric fields which increases the ionic surface charge required to bias the membrane to a given voltage (30–32). As a consequence, protein voltage sensors, characterized by nonlinear voltage activation of charge movement (28), attribute a voltage and time dependent capacitance (sensing capacitance; CVSFP in Fig. 1 C) to the plasma membrane, which adds to the voltage independent capacitance (Cm in Fig. 1 C) of the lipid bilayer, see Fig. 1 C. If the voltage sensor is part of an ion channel, sensing capacitive effects are mostly negligible, because the pore current usually exceeds the capacitive sensing current by orders of magnitude (33,34). For proteins, like Ci-VSP or VSFPs, comprising voltage sensing domains that are not coupled to ion channels, the physiological effect of sensing capacitance will depend on their expression level versus other active membrane mechanisms. A gross estimation shows that a neuronal cell body needs to hold >100 VSFP units/μm2 for the probe to report a fast electrical event above detection limit set by photon shot noise (Supporting Material, Supplements 1 and 3), which is probably higher than typical VSD densities in dendro-somatic neuronal membranes resulting from ion channel expression (e.g., 2–4 Na+ channels/μm2, giving 4–16 VSDs/μm2 in CA1 (35) and subicular pyramidal neurons (36)). This raises the question as to what extent recombinant VSFP expression affects the native electro-response of neuronal membranes and hence the input/output relationship of targeted neurons. Evidently, the answer to this question is of great importance for the anticipated application of VSFP sensors in voltage imaging of neurons and neuron assemblies (37).
In this study, we estimate the capacitive effects of VSFP expression in neurons. On the basis of experimental data of VSFP probes (VSFP2.3 and VSFP3.1) we developed a simple framework to model the dynamics of voltage sensing and fluorescence readout of these probes in neuronal membranes. We then characterized the capacitive effects of VSFP probes in simulations of two rodent central neurons, a cerebellar Purkinje neuron and a layer 5 pyramidal neuron of the somato-sensory cerebral cortex, using computational models of these neurons established previously.
Materials and Methods
Measurement of sensing currents and fluorescence responses of VSFP2.3 and VSFP3.1 in PC12 cells
We used a compilation of new together with already published (15,19) recordings from VSFP2.3 and VSFP3.1 to obtain a characterization of the sensing and signaling properties of these FP voltage sensor variants suitable for realistic modeling. All experimental data were acquired from transfected PC12 cells using protocols described previously (14,15,19). In brief, PC12 cells (ATCC, Manassas, VA) were grown in high-glucose DMEM (Gibco-Invitrogen, Carlsbad, CA) including 5% fetal calf serum and 10% horse serum on poly-D-lysine coated coverslips. Recordings from VSFP2.3 were obtained either from a PC12 cell line stably expressing this construct (sensing current recordings), or from acutely transfected cells (fluorescence recordings at 35°C bath temperature). Recordings from VSFP3.1 were obtained from acutely transfected cells. The membrane potential was controlled in whole-cell voltage clamp using an Axopatch 200B amplifier (Axon Instruments, Sunnyvale, CA) and an inverted fluorescence microscope (Eclipse TE-2000, Nikon, Tokyo, Japan; 50× oil immersion objective). Fluorescence was excited at 440 ± 5 nm (Polychrome IV, T.I.L.L. Photonics, Gräfelfing, Germany) and measured by photodiodes (Viewfinder, T.I.L.L. Photonics) with optical pass bands of 480/40 and 505 LP. Borosilicate glass electrodes were coated with Sylgard after pulling on a two-stage vertical puller (PP-830, Narishige, Tokyo, Japan) to a resistance of 3–5 MΩ when filled with internal solution (in mM): 140 NMDG (N-methyl-D-glucamine), 10 HEPES, 1 MgCl2, 1.8 CaCl2, 10 dextrose, pH 7.2 using HCl. The external solution (perfused at 2 mL/min; 25°C) was: 140 NMDG, 10 HEPES, 5 EGTA, 1 MgCl2, pH 7.4. In a subset of measurements, fluorescence responses were recorded at 35° bath temperature using as internal solution: 130 CsCl, 1 MgCl2, 5 EGTA, 3 Mg-ATP, 20 HEPES, pH 7.2 (with CsOH) and external: 150 NaCl, 4 KCl, 2 CaCl2, 1 MgCl2, 5 D-glucose, 5 HEPES, pH 7.4. Current responses were recorded from 20 ms potential steps from a holding potential of either −140 or −70 mV to a maximum depolarization of +80 mV in 20 mV differential steps and 5s interpulse interval. A step to −160 mV (from −140 hold) or −90 mV (from −70 hold) was used to determine the linear capacitance and leak conductance of recorded cells. For each cell 3–7 current traces and 2–4 fluorescence traces were averaged. Sensing currents were obtained by subtraction of linear capacitive currents and leak currents from the experimental traces. Integration of the current transients caused by depolarizing voltage steps (ON-currents) yielded the transferred sensing charge as function of membrane voltage. ON-time constants were obtained by mono-exponential fits to the decay of ON-sensing currents. Fluorescence responses were recorded from a −70 mV holding potential with 20 mV differential steps of 500 ms to a −140 mV minimum and +110 mV maximum potentials with 10s interpulse intervals. ON-fluorescence traces were fit with single-exponential or double-exponential functions after correction for photo-bleaching. From these data we obtained the steady state activation of the reporter (from the pre-exponential amplitudes) and reporter ON time constants as function of membrane voltage.
Simulation of model neurons including VSFP sensing currents
Two model neurons were simulated using computational models of these neurons established previously. Briefly, first-order rate equations are used to model transitions between states of ion channels. For a voltage-gated channel X with state variables for activation (0 ≤ nX ≤ 1) and noninactivation (0 ≤ hX ≤ 1) the dynamical evolution of the states are described by (38)
| (1) |
with voltage-dependent rate coefficients for activation (αn), de-activation (βn), inactivation (βh), and de-inactivation (αh). Ionic currents were obtained as
| (2) |
with the current flux, I, the maximum open conductance per unit membrane area, G, the gate multiplicity, m, and the channel equilibrium potential, E. Gating currents were calculated as (39)
| (3) |
where Igate is the current flux produced by the gating of channel X, g the unitary channel conductance, zn and zh are the valences of the n- and h-gating charges, respectively, and e0 the elementary charge. According to Eqs. 2 and 3, the polarity of membrane current is defined as: negative for inward current (movement of positive charges from the extra- to the intracellular space), positive for outward current (movement of positive charges from the intra- to the extracellular space).
The membrane voltage V in each cellular compartment was obtained by solving the membrane equation:
| (4) |
with Cm, the linear membrane capacitance, IVSFP, the flux of VSFP sensing current as calculated from Eq. 6 (see below) and Iinj, the flux of current injected through a simulated point source (Iinj = 0 for all compartments except the cell body). By default, ion channel gating currents as calculated from Eq. 3 were not included into the membrane equation (Eq. 4) because the neuron models used in this study (Purkinje neuron model, L5 pyramidal neuron model, see below) were originally validated without including these currents. Additionally, we carried out a smaller set of simulations with gating currents included and confirmed that their presence/absence does not impact on the effects of VSFP sensing capacitance studied in this work. The system of differential equations Eqs. 1–4 over all cellular compartments was solved numerically by backward Euler integration using the NEURON 6.2 simulator (40,41) with fixed time steps (Purkinje model, HH-model: 5 μs; L5 pyramidal neuron model: 25 μs) and temperature (37°C) on a Xeon (3.2 GHz; Intel, Santa Clara, CA) double processor workstation (Dell Precision PW 670, Dell, Round Rock, TX).
Purkinje neuron model
This is a single compartment model identical to the Purkinje neuron model by Akemann and Knöpfel (42) that included several channels from the work of Khaliq et al. (43). The original model is available for download at http://senselab.med.yale.edu/modeldb/. For this study a few, relatively minor, modifications were introduced as follows:
-
1.
At high depolarizing potentials (>−20 mV) Purkinje neurons show strong outward rectification caused by a high expression of Kv3.3 and, at lower levels, Kv3.4 channel units (44) in the somatic and dendritic membrane (45–47). In the original model Kv3 channels were implemented by a generic model, termed bKv3, with step-like activation and deactivation (42). For this study the bKv3 model was replaced by a Hodgkin-Huxley mechanism with m = 4 derived from a least-square fit to recent experimental data of Martina et al. (48). The resulting rate coefficients at 22°C are αn(V) = 0.22/ms × exp[(V + 16 mV)/26.5 mV] and βn(V) = 0.22/ms × exp[−(V + 16 mV)/26.5 mV]. This model reaches half activation at +6 mV (steady-state) with a time constant (at 22°C) of 1.5 ms at +10 mV and 0.7 ms at +30 mV.
-
2.
The original model was developed with the idea to reproduce the physiological effects resulting from the existence of Na+ ion channels with resurgent (Nav1.6) and nonresurgent (Nav1.1 and Nav1.2) kinetics in Purkinje neurons. In this study we simplified the Na+ kinetics by omitting the Nav1.6 channel and increasing the density of the Nav1.1/1.2 channel from 14 to 38 mS/cm2.
-
3.
To elevate the kinetics of all channels to be consistent with a temperature of 37°C, as used in this study, rate coefficients were temperature-corrected using a q10 of 2.7.
-
4.
Gating currents were calculated using Eq. 3 with parameters specified as (g, m, zn, zh): Nav1.1/1.2 (15 pS, 4, 2.54, 0), Kv1 (16 pS, 4, 2.80, 0), Kv3 (16 pS, 4, 1.92, 0), Kv4 (16 pS, 4, 1.47, −5.47), KCa1.1(BK) (182 pS, 3, 4.10, −4.38), Cav2.1(P-type) (10 pS, 1, 4.62, 0), HCN1(Ih) (0.68 pS, 1, −2.57, 0). Values of gating valences were derived from the rate constant expressions of each channel. Unitary conductances were taken from single-channel recording data as found in the literature (35,49–51).
Layer 5 pyramidal neuron model
This model of a rat somato-sensory layer 5 pyramidal neuron by Mainen et al. (52) and Mainen and Sejnowski (53) involves a full morphological reconstruction of the dendrite together with a generalized axon geometry. The original model (provided at http://www.cnl.salk.edu/Simulations/) was extended to include calculation of ion channel gating currents using expression Eq. 3 together with the following parameters: Na (15 pS, 3, 1.88, −2.73), Kv (16 pS, 1, 1.88, 0), Km (muscarine) (16 pS, 1, 1.88, 0), and Ca(P-type) (10 pS, 2, 5.44, −0.94). Synaptic input was simulated by introducing a synaptic conductance with fixed rise time constant (0.3 ms), decay time constant (3 ms), and reversal potential (0 mV) into section 23 of the apical dendrite.
VSFP models
The response behavior of VSFP proteins was approximated by Markov chain models where the protein moves between different states of the sensor (S) and of the reporter domain (R) (Fig. 2). The rate coefficients SON and SOFF of transitions between sensor states are assumed to obey Arrhenius-type voltage-dependence:
| (5) |
Figure 2.
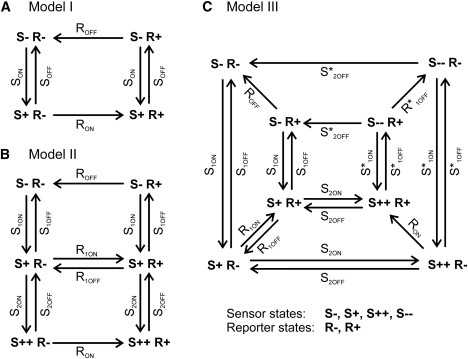
Rate models of the voltage-sensitive fluorescent proteins VSFP2.3 and VSFP3.1. (A) Four-state model (Model I): SON and SOFF are the voltage-dependent ON and OFF rate coefficients of the voltage sensor, RON and ROFF, the ON and OFF rate coefficients of the fluorescence reporter. (B) Six-state model (Model II): the voltage sensing domain undergoes fast (rate coefficients: S1ON, S1OFF) and slow (rate coefficients: S2ON, S2OFF) ON/OFF transitions. (RON, R1OFF, R2ON, ROFF) are voltage-independent rate coefficients for transitions of the fluorescence reporter. (C) Eight-state model (Model III): the voltage sensing domain moves between four states, the deactivated state (S−), the primary activated state (S+), the secondary activated state (S++), and the secondary deactivated state (S−−) (see text for details).
With z, the valence of sensing charge associated with this transition, e0, the elementary charge, δ, the coordinate (0 ≤ δ ≤ 1) of the transition state between the internal (δ = 0) and the external (δ = 1) face of the membrane, kB, the Boltzmann constant and T, the absolute temperature. The ON and OFF rate coefficients of transitions between reporter states (RON, ROFF) were considered voltage-independent. The VSFP sensing current, IVSFP, and optical fluorescence signal, F, were calculated according to:
| (6) |
With nS,R the probability of occupancy of the state (S, R), ρ, the membrane density of VSFP, zS,S′, the valence of the sensing charge transferred on transition from (S, R) to (S′, R), SON(S,S′) and SOFF(S,S′), the rate coefficients for ON and OFF transitions from state (S, R) to (S′, R), F1/2, the amplitude of the fluorescence signal at half activation and ΔFmax, the maximum range of fluorescence modulation. Effects of photobleaching were not implemented. Because we are only interested in differential fluorescence responses, F1/2 was conveniently set to 1. To align the models with existing VSFP proteins, the model parameters were determined by fitting the models to experimental data obtained from VSFP2.3 and VSFP3.1 using the multiple run fitter routine of the NEURON simulator.
Model I
In this model (Fig. 2 A) the sensor (S) and the reporter (R) domain can each move between two stable equilibrium states, the activated state (+) and the deactivated state (−), resulting in the following states (S, R) of the protein: (−,−), (+,−), (−,+) and (+,+). Simultaneous fits to measured sensing currents and fluorescence responses of the VSFP2.3 protein (recorded at 25°; see Results) yielded the following parameters (values in brackets): SON(0) (0.48/ms), SOFF(0) (0.074/ms), z (1.2), δ (0.35), RON (0.0095/ms), ROFF (0.0095/ms). The activation kinetics at 37°C was obtained by q10 correction (sensor: 1.43; reporter: 1.67) to the rate coefficients (A. Lundby et al., unpublished).
Model II
In this model the voltage sensor assumes three stable states, the deactivated state (S−), the primary activated state (S+) and the secondary activated state (S++), giving rise to a total of six states (S, R): (−,−), (+,−), (++,−), (++,+), (+,+), and (−,+) as given in Fig. 2 B. Fits to experimental data of VSFP2.3 (sensing currents recorded at 25°; fluorescence at 35°; see the Supporting Material, Supplement 4) yielded (at V = 0): S1,ON (0.48/ms), S1,OFF (0.13/ms), z1 (1.2), δ1 (0.35), S2,ON (0.013/ms), S2,OFF (0.0022/ms), z2 (0.5), δ2 (0.35), RON (1/ms), ROFF (1/ms), R1,ON (0.28/ms), R1,OFF (0.5/ms), ΔFmax (0.051) and in the case of VSFP3.1 (sensing and gating currents recorded at 25°C): S1,ON (0.48/ms), S1,OFF (0.05/ms), z1 (1.2), δ1 (0.35), S2,ON (0.006/ms), S2,OFF (0.005/ms), z2 (0.3), δ2 (0.85), RON (1/ms), ROFF (1/ms), R1,ON (1/ms), R1,OFF (0.6/ms), ΔFmax (−0.01). The kinetics at 37°C was obtained by q10 correction to the rate coefficients as given above.
Model III
In model III the sensor motion involves four stable states, the deactivated state (S−), the primary activated state (S+), the secondary activated state (S++) and the secondary deactivated state (S−−) giving a total of eight states (S, R): (−, −), (+,−), (++,−), (−−,−), (−−,+), (++,+), (+,+), (−,+) (Fig. 2 C). The transitions between (S++) and (S−−) were modeled to pass through a stable intermediate state (Sint) located at a position δ∗int of the membrane (0 < δ∗int <1). An energy barrier separates (S++) from (Sint) and a second barrier (Sint) from (S−−) with the associated transition states located at δ∗1,1 (0 ≤ δ∗1,1 ≤ δ∗int) and δ∗1,2 (δint ≤ δ∗1,2 ≤ 1), respectively. The rate coefficients of transitions between (S++) and (Sint) are given as: S∗1,ON,1(0) exp(z1 e0 δ∗1,1 V/ kBT), S∗1,OFF,1(0) exp(−z1 e0 (δ∗int − δ∗1,1) V/ kBT), and between (Sint) and (S−−) as: S∗1,ON,2(0) exp(z1 e0 (δ∗1,2 − δ∗int) V/ kBT), S∗1,OFF,2(0) exp(−z1 e0 (1 − δ∗1,2) V/ kBT). Fits to experimental data (Supporting Material, Supplement 4) yielded for VSFP2.3 (values at V = 0): S1,ON (0.48/ms), S1,OFF (0.074/ms), z1 (1.2), δ1 (0.35), S2,ON (0.013/ms), S2,OFF (0.0016/ms), z2 (0.5), δ2 (0.75), S∗1,ON,1 (0.4/ms), S∗1,OFF,1 (0.38/ms), S∗1,ON,2 (2.5/ms), S∗1,OFF,2 (0.06/ms), δ∗1,1 (0.1), δ∗int (0.2), δ∗1,2 (0.25), S∗2,OFF (0.012/ms), δ∗2 (0.9), RON (2/ms), ROFF (2/ms), R1,ON (0.4/ms), R1,OFF (1/ms), R∗1,OFF (0.07/ms), ΔFmax (0.05), and for VSFP3.1: S1,ON (0.48/ms), S1,OFF (0.074/ms), z1 (1.2), δ1 (0.35), S2,ON (0.014/ms), S2,OFF (0.0066/ms), z2 (0.3), δ2 (0.4), S∗1,ON,1 (0.4/ms), S∗1,OFF,1 (0.38/ms), S∗1,ON,2 (2/ms), S∗1,OFF,2 (0.1/ms), δ∗1,1 (0.1), δ∗int (0.2), δ∗1,2 (0.3), S∗2,OFF (0.002/ms), δ∗2 (0.2), RON (2/ms), ROFF (2/ms), R1,ON (1/ms), R1,OFF (0.7/ms), R∗1,OFF (0.028/ms), ΔFmax (−0.01). The kinetics at 37°C was obtained by correction of the rate coefficients as given above.
Generic model
The kinetic scheme of the generic model is identical to Model I. The motion of the voltage sensor involves a single symmetrical transition state (δ = 0.5) separating the activated and deactivated state. The reporter is assumed to track transitions of the sensor with a time constant of 0.5 ms (RON = ROFF = 2/ms). Hence, the kinetics of fluorescence responses is limited by the sensor in the practically relevant range. The remaining kinetic constants, SON(0) and SOFF(0), or, equivalently, V1/2 and τ1/2, the voltage and time constant of half-activation, together with z and ΔFmax are considered as free parameters and were individually fixed according to the purpose of each simulation. Values for time constants are given for 25°C. Their values at 37°C were obtained by temperature correction using q10 values as given above. Formulas for the steady state charge transfer, sensing capacitance and voltage sensitivity are given in the Supporting Material, Supplement 2.
Fluorescence signal/noise estimations
VSFP fluorescence responses were obtained as deviation of the total fluorescence signal F(t) from the baseline signal F0 (fluorescence signal before stimulus onset) and expressed as ΔF/F0 = (F − F0)/F0. To emphasize the effect of photon statistics on VSFP fluorescence traces, some traces are shown together with simulated photon shot noise. In these cases the noise was added to the mean fluorescence signal 〈F〉 in each sampling interval of length Δt:
| (7) |
with rN, a computer-generated random number with standard normal distribution and nT, the total number of photons detected per sampling interval. The mean number of detected photons, <nT>, sampled from a single neuron during Δt was calculated according to our earlier estimations (17) as summarized in the Supporting Material, Supplement 1, using the following parameters (values in brackets): diameter of perisomatic membrane sphere, D (25 μm), the fraction of nonresponsive background, fB (0), the fraction of emission light collected by a NA (1.0) water immersion objective, fC (0.17), the fraction of emission spectrum transmitted to the detector, fem (0.8), the detector quantum yield, qD (0.6), and the quantum yield of photon emission, qem (0.6). The intensity of excitation light was adjusted to a level that is expected to photo-bleach eGFP (quantum yield of photo-bleaching 8.3 × 10⁻⁶ (55)) with a probability of (e − 1)/e ∼ 63% after 10 s of illumination. Values of other parameters are given in the Results section.
Action potential-induced fluorescence responses were analyzed in the following way: at first, spike events were identified in the simulated voltage trace by means of a −30 mV event threshold. For each spike event the fluorescence baseline value F0 was taken as the fluorescence signal 0.3 ms earlier to the time point when the membrane potential reached the event threshold. Spike-evoked fluorescence responses (spike responses) were then evaluated as time integral of (F − F0) between half response amplitudes divided by the response width (at half amplitude) and normalized by F0. The signal/noise (S/N) ratio of spike responses was calculated as:
| (8) |
under the assumption of a sampling interval equal or shorter than the half width of the response. The mean number of detected photons per sampling interval, 〈nT〉, was evaluated as before. All S/N calculations were carried out using MATLAB 7.4 (The MathWorks, Natick, MA) software. Figures were prepared using Origin 7.0 (OriginLab, Northampton, MA) software.
Results
Voltage dependent rearrangement of a voltage sensing protein is associated with redistribution of charges within the membrane electric field giving rise to dielectric membrane polarization and, consequently, additional membrane capacitance, which we term sensing capacitance. Quantification of this capacitance is straightforward when changes of the membrane potential occur on a timescale slower than the intrinsic response kinetics of the charge movements. Under such conditions, the charge displacement tracks the membrane potential in quasi steady state and sensing capacitance is a function of the membrane voltage without explicit time-dependence. Furthermore assuming an intramolecular gate that allows the voltage sensing protein to transit between two states with Arrhenius rates (e.g., ON/OFF with different external/internal position of charges), the capacitance takes the form of a bell shaped function with a peak at V1/2 (voltage of half-maximal activation; Fig. 3 A). Although the width of this function decreases linearly with increasing sensing charge, its peak value grows with the square of the charge (Fig. 3 A and the Supporting Material, Eq. S2.4). The quasi-static sensing capacitance resulting from VSFP membrane expression at a level of several 100 VSDs/μm2 with 0.8 to 2 charges per unit can attain peak values close to the linear capacitance of lipid bilayers (0.6–0.8 μF/cm2 (56)) or neuronal plasma membranes (0.9–1.1 μF/cm2 (57)) (Fig. 3 B). The quasi-static capacitance approximation is most useful for estimating the effect of recombinant sensing charge on slow subthreshold membrane potential transients. However, some electrical events in neurons are extremely fast. Most importantly, this concerns action potentials with typical half-durations (width at half maximum spike amplitude) of 180 μs to 4 ms when recorded at the cell body of central neurons (58). Evaluation of the effects of additional sensing capacitance in simulations including fast neuronal events requires a dynamical model of the recombinant probe. In the following we use experimental data to develop models capable of reproducing the kinetic properties of published VSFPs in neuronal simulations, and we estimate the effect of these VSFPs on neuronal excitability.
Figure 3.
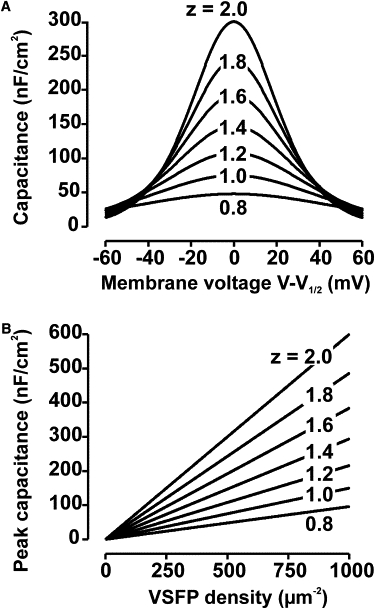
VSFP sensing capacitance for slow membrane potential changes. (A)CVSFP as function of membrane voltage close to half activation for VSFP sensing charges with valences between 0.8 and 2 and an assumed membrane expression of 500 VSFP units/μm2. (B) CVSFP at half activation (membrane voltage equal to V1/2) versus density of VSFP membrane expression for sensing charge valences between 0.8 and 2. The capacitance was calculated from a generic two-state VSFP model in quasi-steady-state approximation (see text). The temperature is set to 37°C.
VSFP2.3 and VSFP3.1 simulation models
The dynamic behavior of VSFPs results from voltage-dependent state transitions of the VSFP proteins. For our modeling purpose, the region of the state space that governs the activation of sensing charge motion and fluorescence response is represented by a few discrete stable states assumed to be separated by simple energy barriers with single intermediate transition states. Each state comprises a specific state of the sensor (S) and of the reporter domain (R) and is referred to by the concatenated notion (S, R) (Fig. 2). To designate the forward and backward transition between states (and the associated Arrhenius rate coefficients) we use SON, SOFF or RON, ROFF to indicate whether the transition involves a change in the state of the sensor or reporter, respectively. The rate coefficients for reporter transitions (RON, ROFF) are constants and unaffected by changes of the membrane voltage. In this study we consider three configurations of the VSFP state space giving rise to the three kinetic models referred to by Roman numbers I, II, and III (Fig. 2).
One of the essential ingredients motivating the design of these models came from the experimental measurement of the sensing currents in the VSFP2.3 protein, in particular the following observations: 1), the decay of the ON sensing currents of VSFP2.3 recorded in response to depolarizing step voltages were sufficiently described by single-exponential time constants (15); and 2), the activation curve of the charge transfer was well fitted with two-state Boltzmann functions. The Boltzmann-fits showed a half-activation voltage (V1/2) of −40 mV and a nominal sensing charge (z) of 1.2 for VSFP2.3 (Fig. 4, A1–4). These findings suggest that the essential part of the sensing charge moves in a single conformational transition involving 1.2 elementary charges. This charge transfer transition corresponds to the reaction from (S−) to (S+) in models I–III (Fig. 2). A priori we assign a charge of 1.2 e0 to this transition while using parameter fitting to determine the remaining parameters of the models.
Figure 4.
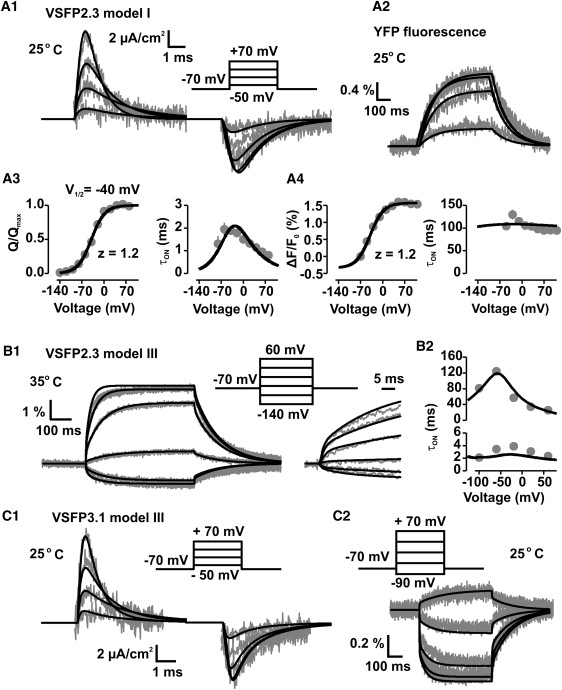
Kinetics of charge transfer and fluorescence response of the voltage-sensitive fluorescent proteins VSFP2.3 and VSFP3.1. Experimental data measured from PC12 cells expressing these proteins (gray) are overlaid with the predictions obtained from the simulation models (black). (A1) Sensing currents of VSFP2.3 measured at 25° and evoked by the voltage-step protocol given as inset with 40 mV step depolarizations (20 ms) from a holding potential of −70 mV, together with simulated traces using model I. The finite response time of the experimental voltage clamp was accounted for in the simulations by a 150 μs charging time constant. (A2) Fluorescence response (ΔF/F0) recorded together with the traces in (A1) using same voltage steps, but 500 ms step durations. The traces refer to the emission by YFP of the cyan/yellow FP reporter pair. (A3) Normalized steady-state charge transfer (Q/Qmax; left panel) and ON time constant (τON; right panel) obtained for VSFP2.3 and model I. (A4) Normalized fluorescence response amplitude ΔF/F0 (left panel) and fluorescence ON time constant (right panel) derived from the recordings in (A2) and model I. (B1) YFP fluorescence responses of VSFP2.3 recorded at 35° and averaged over 10 cells, together with simulated traces using model III. (B2) Fluorescence ON time constants derived from dual-exponential fits of the traces shown in (B1). (C1) Sensing currents of VSFP3.1 measured at 25° with the voltage-step protocol given as inset (same as in A1), together with simulated traces using model III including a 150 μs charging time constant. (C2) Fluorescence response (ΔF/F0) recorded together with the traces in (C1) using same voltage steps, but 500 ms step durations. The traces refer to the emission by cyan fluorescent protein.
In model I activation of the sensor into (S+) prompts the reporter to transit from (R−) to (R+) through the RON transition. The reporter will remain in the (R+) state until the sensor is deactivated. Deactivation of the sensor drives the protein from the (S+ R+) to the (S− R+) state and further to (S− R−) that closes the reaction cycle of the protein (Fig. 2 A). When fitting model I to measured sensing current traces of VSFP2.3 in PC12 cells (Fig. 4 A1), we obtained good agreement with the experimental activation curve (Q/Qmax versus V; Fig. 4 A3, left panel) and the measured ON time constants (τON versus V; Fig. 4 A3, right panel). Model I was also sufficient to fit the yellow fluorescent protein (YFP) fluorescence traces that we recorded simultaneously (at 25°C) with the sensing currents (Fig. 4 A2), showing slow, essentially mono-exponential ON activation (Fig. 4 A4). However, several results indicate a more complex behavior of the VSFP fluorescence response. First, a dual exponential time course of ON activation was resolved in the donor cyan fluorescent protein emission of VSFP2.3 in PC12 cells (15). Furthermore, high S/N fluorescence recordings of VSFP2.3 in Xenopus oocytes showed very clearly the existence of two voltage-dependent time constants in the acceptor emission (YFP), with the fast process tracking the motion of the sensing charge (59). This principally accords with observations made in earlier recordings of the original VSFP2.1 variant in PC12 cells where a fast initial component was noted in the fluorescence responses when the recording temperature was 35°C, although multi-exponential fits to these traces remained ambiguous, presumably because of insufficient S/N in these recordings (14). Recently, however, by extensive trail averaging at physiological recording temperature (35°C), the two ON time constants of the VSFP2.3 fluorescence response were determined successfully in PC12 cells (19). Converging evidence from all advanced VSFP variants (19), including VSFP3.1 (Fig. 4 C2), hence points toward a multi-step process of VSFP fluorescence activation exhibiting at least two distinct time constants. To create a pathway for multi-step fluorescence activation we extended model I by a secondary activated state (S++) that is reached through a slow transition (through S2ON and S2OFF) from the primary activated state (S+) (Fig. 2 B). The resulting model II provides a fast pathway, by activation from (S− R−) via (S+ R−) to (S+ R+), and a slow pathway, by activation from (S− R−) via (S+ R−) and (S++ R−) to (S++, R+), of ON fluorescence activation. To account for the experimentally observed voltage-dependence of the slow fluorescence ON time constant (Fig. 4 B2), we assigned a small charge of 0.3 (VSFP3.1) to 0.5 e0 (VSFP2.3) to the (S+) to (S++) transition. Model II gives overall reasonable fits of the fluorescence traces recorded from VSFP2.3 and VSFP3.1, as well as of ON sensing currents. OFF sensing currents, however, are less well approximated (Supporting Material, Fig. S2, A1 and B1). Model II implicates that the protein deactivates by moving through the same sequence of sensor states (in reverse order) as for activation. As a consequence, the deactivation decay of the (S++) state contributes little to the OFF sensing current as (S++) decays by the slow S2ON/S2OFF transition. To increase the contribution of (S++) to the OFF sensing current we modified model II by introducing a fourth sensor state, the secondary deactivated state (S−−), which is reached from (S++) through a fast, voltage-gated transition that parallels the transition between (S−) and (S+) (Fig. 2 C). This modification gave rise to model III that endows the protein with an alternative pathway of deactivation: instead of decaying through (S+) back to (S−), proteins in state (S++) can now transit with substantial weight into (S−−) and from (S−−) back to (S−). Model III allows for better fits of the OFF sensing currents of VSFP2.3 (Fig. S2 A2) and VSFP3.1 (Fig. 4 C1), and approximates well the measured fluorescence traces (Fig. 4, B1 and C2) including the voltage-dependence of the time constants (Fig. 4 B2). Furthermore, model III, is motivated by recent data of Villalba-Galea et al. (59) who reported a −42 mV shift of the charge activation curve (Q-V curve) of VSFP2.3 induced by conditioning the membrane with long depolarization prepulses. Notably, the reaction scheme of the sensor in model III is identical to the four-state sensor model proposed by Villalba-Galea et al. (60) to explain this so-called Cole-Moore shift behavior of the Q-V relationship (see Discussion). We will use model I as the default model to explore the effects of VSFP2.3 sensing capacitance on neuronal membrane functions given the overall good approximation of measured sensing currents achieved by this model (Fig. 4, A1–A3). Models II and III will be used at times to ascertain that the conclusions are robust and independent of the model applied. For simulations of VSFP2.3 and VSFP3.1 fluorescence responses we will apply model III.
Effect of VSFP expression on the timing of neuronal spikes
To study the effects of VSFP expression on the electro-responsive behavior of neurons we chose to simulate two central neurons: a cerebellar Purkinje neuron and a neocortical layer 5 (L5) pyramidal neuron. Both neurons are among the largest projection neurons in the mammalian brain providing large membrane surface areas suitable for cellular voltage imaging. They also represent distinct electrophysiological phenotypes. The distinct spiking behavior is evident in simulated spike trains using computational models of these neurons (see Materials and Methods). Whereas the Purkinje neuron responds to relief from a negative silencing current with a regular train of spontaneous single spikes (Fig. 5 A, left), the L5 pyramidal neuron discharges in a series of high-frequency spike bursts with long burst-to-burst periods when stimulated with positive current injection into the cell body (Fig. 5 A, right). How are these endogenous spike behaviors affected by the presence of high density of VSFPs in the plasma membrane? To address this question we inserted the VSFP2.3 model (Model I) at variable homogenous density into all compartments and compared the spike responses in the VSFP-including and the VSFP-void neuron models (Controls). In the Purkinje model addition of VSFP2.3 resulted in the following effects (Fig. 5, A and B, left): 1), the model cell continues to discharge with a regular spike train throughout the investigated density range but the first spike after stimulus onset is delayed with respect to the first control spike and this time lag increases with VSFP density; and 2), the spikes after the first spike are shifted forward in time such that interspike intervals are shortened uniformly. For the L5 neuron the effects are (Fig. 5, A and B, right): 1), like the Purkinje model, the L5 neuron model generates action potential spikes for all VSFP densities investigated; 2), the first spike after stimulus onset is delayed with a VSFP density-dependent time lag, consistent with the behavior of the Purkinje model; and 3), the burst pattern remains relatively undisturbed for VSFP densities up to 500 VSDs/μm2. At higher VSFP density the repetitive bursts are replaced by an initial spike burst followed by low-frequency regular spikes. We confirmed that other VSFP reaction models (Models II, III) give rise to similar shifts in the timing of spikes as model I used in above simulations (Supporting Material, Supplement 5).We also carried out simulations using a simple model cell with Hodgkin-Huxley (HH)-type Na+ and K+ channels as the only active mechanisms and observed VSFP-caused shifts in the timing of elicited spikes similar to those seen in the Purkinje neuron model (Supporting Material, Supplement 6). With regard to these observations the effect of VSFP on first spike latencies is most easily explained because extra time is required for charging the membrane under conditions of increased membrane capacitance. Therefore, as expected for a membrane capacitive effect, the spike latency increases as a linear function of VSFP density (Fig. 6, A and B). As membrane voltage changes are small and slow during the subthreshold transient leading to the first spike, the sensing capacitance is nearly constant (Fig. 6 A) and quantitatively well predicted by the quasi-static capacitance given in Fig. 3 B. However, the capacitance strongly varies at times close to stimulus onset and spike upstroke (Fig. 6 A, bottom). Obviously, this is the regime where the dynamic properties of the sensing capacitance become dominant, as discussed in detail below.
Figure 5.
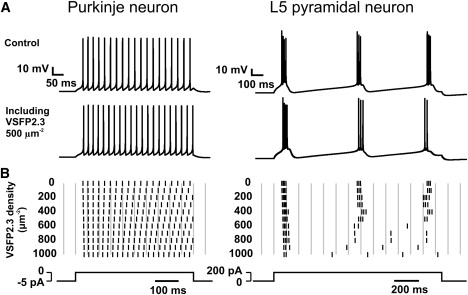
Simulated effect of VSFP2.3 sensing capacitance on the spiking behavior of a Purkinje and a layer 5 pyramidal neuron. (A) Somatic voltage transients obtained by applying an extended current pulse (in B, bottom) to the cell body. Control responses (top row) are displayed together with responses obtained after including the VSFP2.3 model (Model I) at a constant membrane density of 500 VSDs/μm2 (bottom row). (B) Raster plot showing the occurrence of spike events in simulations as in A for VSFP2.3 densities from 0 to 1000 VSDs/μm2. Each spike is represented by a vertical bar at the time when the voltage rises above a −30 mV event threshold. The simulations were carried out at 37°C.
Figure 6.
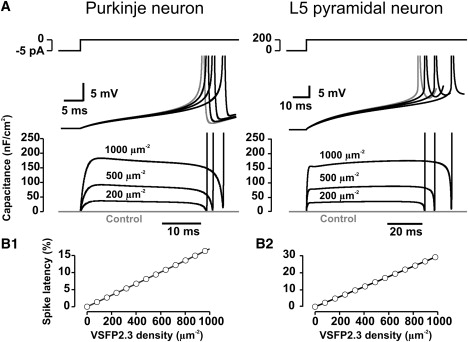
Effect of VSFP2.3 sensing capacitance on spike timing in simulations of Purkinje and layer 5 pyramidal neurons. (A) Time courses of somatic voltage transients (middle row) and VSFP2.3-induced sensing capacitance (lower row) from the onset of a constant current stimulus (shown on top, same stimulus as in Fig. 4) to the first action potential with 0 (control; gray), 200, 500, and 1000 VSDs/μm2 of VSFP2.3 (Model I). (B1) Delay of first-spike latency as function of VSFP2.3 expression density in the Purkinje neuron model. (B2) Same as B1 in the layer 5 pyramidal neuron model.
Effects of VSFP sensing capacitance on action potential initiation and somatic EPSP waveform
When neuronal membranes that include VSFPs generate action potentials, the total membrane current includes a component with a bipolar time course representing VSFP sensing current (Fig. 7 E). Whereas linear capacitive current (due to linear capacitance Cm) follows the first derivative of the voltage waveform (Fig. 7 A), the VSFP sensing current (Fig. 7 E) has a nontrivial time course reflecting dynamic properties of the VSFP. It is instructive to compare the VSFP sensing currents with the gating currents of ion channels intrinsic to the membrane as they both originate in the same biophysical mechanism of voltage-activated motion of sensing charge. First, it is important to recall that the neuron models used in this study were developed and validated without explicitly including gating currents of ion channels. However, because these models were derived from electrophysiological recordings (that obviously include the effects of channel gating) they implicitly account for the net contribution of gating currents of ion channels through other model parameters as, for instance, kinetic parameters of implemented ion channels. To maintain the integrity of these models, therefore, we calculated gating currents without feeding them back into the membrane equation (see Materials and Methods). The peak amplitude of outward gating current of the Na+ channel in these simulations was ∼30–70 times smaller than the maximum inward Na+ current during action potential discharge (Fig. 7, B and C) consistent with experimental data from the Na+ channel in the squid axon (61). In the Purkinje neuron expressing 1000 VSFP2.3 units/μm2 the VSFP sensing current reaches a positive (outward) peak value close to the peak value of ion channel gating current (Fig. 7, D and E). In the L5 neuron VSFP2.3 sensing current (1000 VSDs/μm2) is ∼15 times larger (peak value) than ion channel gating current in the somatic compartment, whereas it is 100 times smaller in the axon initial segment. Notably, Fig. 7 shows that VSFP2.3-induced sensing currents (expression <1000 VSDs/μm2) have very little effect on the waveform of the action potential in these neurons, in contrast to their marked influence on spike timing (Fig. 7 A, black and gray traces).
Figure 7.
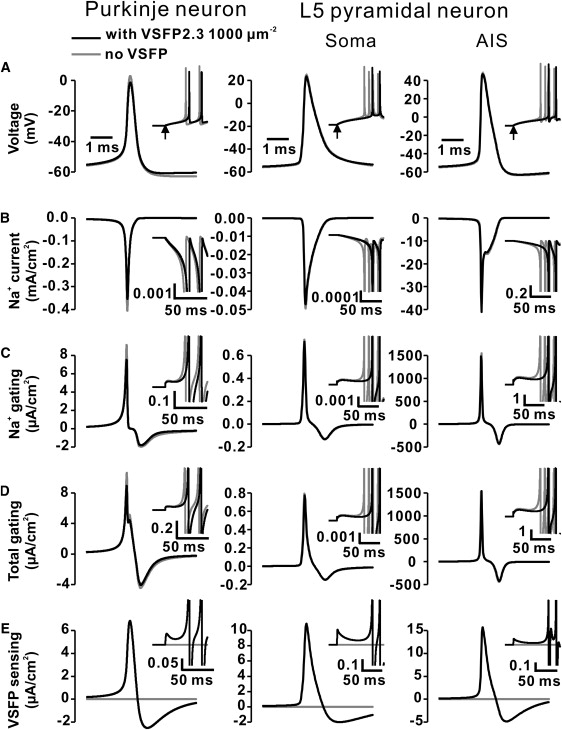
VSFP2.3 sensing currents have little effect on fast action potential waveforms in simulations of Purkinje and layer 5 pyramidal neurons. (A) Overlaid action potential waveforms (aligned to the time of peak maximum) in the Purkinje neuron (left panel) and the soma (middle panel) and axon initial segment (right panel) of the layer 5 neuron including 1000 units /μm2 (black traces) of VSFP2.3 (Model I) as compared to control waveforms (no VSFP; gray traces). The potentials were taken from the first spike in voltage transients evoked by a constant current step (same as in Fig.5) as shown in the inset with the stimulus onset marked by arrow. (B) Na+ currents flowing through voltage-gated sodium channels during membrane voltage traces in A. Inset traces are plotted at enlarged y-scale (given by separate scale bars; same units as main y-scale) to emphasize the subthreshold regime (peak currents truncated). (C) Gating currents associated with Na+ channel gating. (D) Summed total gating currents of voltage-gated ion channels. (E) VSFP2.3 sensing currents during membrane voltage traces in A. Timescales in B–E identical to A.
Although prolonged artificial current stimuli show linear shifts in the timing of spikes as a consequence of VSFP sensing capacitance (Fig. 6), additional nonlinear threshold effects can occur in the case of synaptic potentials that result from a brief activation of a synaptic conductance. To investigate this issue we simulated the propagation of distally evoked synaptic potentials (excitatory postsynaptic potentials; EPSPs) along the apical-dendritic arbor to the cell body of the L5 neuron model (Fig. 8 A). In the presence of VSFP in the membrane the amplitude of a sub-threshold somatic EPSP is significantly reduced (Fig. 8 B1) and whereas a synaptic stimulus 20% above action potential threshold evokes two somatic spikes in the control case it yields one spike at 200 or 500 VSFP2.3 units/μm2 of membrane and fails to evoke a spike at 1000 units/μm2 (Fig. 8 B2). In contrast, action potential waveforms are largely unaffected by the presence of VSFP in the membrane (Fig. 7 A). VSFP2.3 sensing capacitance thus influences action potential initiation of near-threshold stimuli without affecting the ability of the membrane to fire normal spikes once the membrane voltage exceeds the firing threshold. The dynamical behavior of the sensing capacitance is immediately apparent in the phase portrait of the voltage sensor (Fig. 8, C1 and C2), because the sensing capacitance corresponds to the first derivative of the phase curve (Supporting Material, Eq. S2.2). The phase curve remains close to the steady state (Fig. 8 C1, gray line) during sub-threshold EPSPs (Fig. 8 C1) and hence the sensing capacitance deviates little from the quasi-static response. In the case of a supra-threshold potential the capacitance is strongly diminished during spike upstroke (Fig. 8 C2, phase 2) and very high close to the action potential peak. During the spike repolarization, the sensing dynamics first enters a regenerative phase of negative dynamic capacitance characterized by outward sensing current (ON current) and rapidly decreasing membrane polarization (phase 3), followed by a phase of high capacitance with inward sensing current (OFF current; phase 4). Thus, the sensing capacitance is most effective during the sub-threshold transient and during the late re-polarization phase of the spike (phases 1 and 4), but much less effective (phase 2) or even regenerative (phase 3) during spike discharge. The obvious reason for this behavior is that the action potential voltage transient is so fast that the VSFP2.3 sensor is unable to keep track and therefore is moved far away from its quasi-static equilibrium. Among the dynamic performance of the VSFP sensor, phase 4 is particularly interesting, because this phase coincides with the time window where typically active membrane conductances, in particular K+ conductances, critical for the control of the refractory period between spikes are activated. To test the effect of phase 4 sensing capacitance on Purkinje neuron action potentials, we removed phase 4 capacitance by truncating the sensor OFF current and observed the firing behavior in simulations analogous to the data in Fig. 5. In the presence of VSFP lacking phase 4 capacitance Purkinje neuron spike trains no longer showed increased spike rates, but rates below control (Fig. S5).
Figure 8.
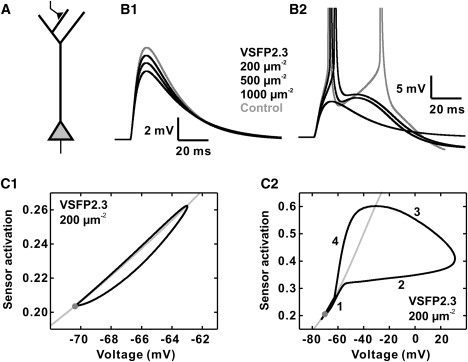
Effect of VSFP2.3 sensing capacitance on the amplitude of sub- and suprathreshold synaptic potentials and action potential initiation in simulations of a layer 5 pyramidal neuron. (A) Schematic representation of the simulated layer 5 pyramidal neuron. An excitatory synaptic conductance (time constant rise: 0.3 ms; decay: 3 ms; zero reversal potential) was activated in a compartment of the distal dendrite. (B1) Synaptic potentials at the cell body for a synaptic peak conductance of 10% below spike threshold and increasing densities (0, 200, 500, 1000 VSDs/μm2) of VSFP2.3 (Model 1). (B2) Same as B1, but for a synaptic conductance 20% above spike threshold. (C1) State of activation (nS+; 0 ≤ nS+ ≤ 1) of the VSFP2.3 voltage sensing domain in the somatic membrane as function of membrane voltage (black) for the same stimulus as in B1 compared to steady-state (gray) with 200 VSFP2.3 units/μm2. (C2) Same as C1, but applying a stimulus 20% above threshold. Numbers 1–4 indicate the different phases of sensor activation during action-potential firing as referred to in the text.
The simulations described so far provide insight into phenomena that arise as a consequence of VSFP sensing capacitance and alter the native electro-response behavior of neurons that express a voltage probe based on the specific properties of the Ci-VSD voltage-sensing domain. The primary question of practical importance concerns the minimal degree of probe-induced distortion that must be accepted to realize an optical readout of electrical signals from neuronal membranes with sufficient signal/noise. To address this question we first analyzed the fluorescence readout provided by present generation VSFPs.
VSFP readout of action potentials in neurons
The fluorescence response of VSFPs to abrupt changes of the membrane potential consists of a slow and a fast kinetic response with distinguished time constants differing by more than an order of magnitude (15,19,59). Obviously, for any membrane voltage transient rising faster than the slow kinetic component of the VSFP response the resulting VSFP fluorescence readout will critically depend on the relative weighting of the slow versus the fast kinetic component. In simulations of Purkinje and L5 neurons firing multiple action potentials (Fig. 9 A) single potentials are apparent as narrow peaks superimposed on a slowly rising envelop representing the state of activation of the VSFP2.3 (Fig. 9 B1) and VSFP3.1 (Fig. 9 C1) reporter, respectively. The differential activation of the reporter by action potentials is slightly higher in VSFP3.1, consistent with the higher weight of the fast process in VSFP3.1 (∼55% at 20 mV) as compared to VSFP2.3 (∼25% at 20 mV). One important question concerns the likelihood of VSFP probes to report action potential events in optical recordings from neuronal membranes in the presence of experimental noise. To answer this question we simulated the fluorescence signal of VSFP2.3 and VSFP3.1 with and without including photon shot noise under the assumption of a membrane area equivalent to a 25-μm diameter membrane sphere, a density of the VSFP probe of 500 VSDs/μm2 and 1.5 kHz sampling speed (see Materials and Methods for details). In this context we should like to recall that our modeling of the VSFP voltage response is based on fluorescence data representing the integral light intensity measured over whole single PC12 cells. Other experimental arrangements such as selective integration of photon rates from membrane areas of high differential fluorescence response and/or subtraction of signal offsets (to reduce the contribution of cellular autofluorescence and/or other sources of background light) may yield higher values of fluorescence sensitivity. However, from an application point of view, under conditions of high speed imaging of cellular networks in complex tissue, gains in sensitivity based on optical resolution of subcellular structures are not a realistic scenario, whereas background light reduces the S/N of the detected response signal irrespective of whether or not offsets are subtracted (Supporting Material, Supplement 1). We therefore estimate that our modeling of integrated cellular fluorescence responses is appropriate and predictive for the envisioned application of the VSFP probes.
Figure 9.
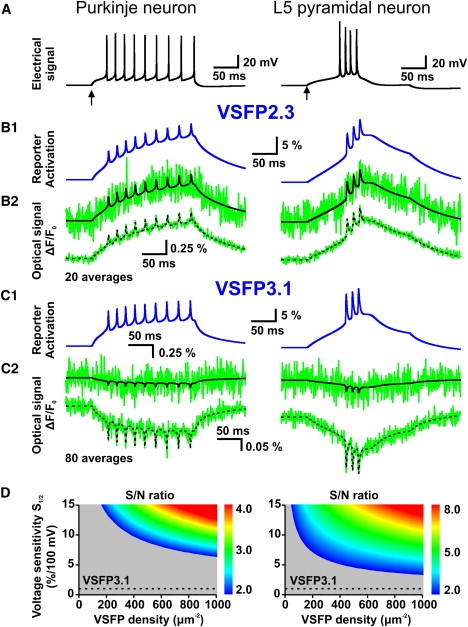
VSFP reporter kinetics and signal/noise of action-potential-induced fluorescence responses. (A) Spike pattern evoked by injection of a constant current pulse into the cell body of the Purkinje neuron (holding current: −20 pA; pulse: 0 pA; 200 ms) and of the layer 5 pyramidal neuron (holding current: 0 pA; pulse: +200 pA). Start of current pulses indicated by arrows. (B1) Activation state (nR+ in %; somatic compartment) of the VSFP reporter in the Purkinje (left) and L5 neuron models including VSFP2.3 (Model III) at 500 VSDs/μm2 using the same stimulus as in A. (B2) Optical response signal ΔF/F0 corresponding to B1 with (green) and without (black) photon shot noise in the case of a single trail (upper trace) and a 20 trial average (lower trace). Shot noise was simulated for a single spherical cell body (25 μm diameter) at 1.5 kHz sampling rate. (C1) Activation state (nR+; in %) of the VSFP reporter in the Purkinje and L5 neuron models including VSFP3.1 (Model III) at 500 VSDs/μm2 applying the same stimulus as in A. (C2) Optical response signal ΔF/F0 corresponding to C1 with (green) and without (black) photon shot noise in the case of a single trail (upper trace) and a 80 trial average (lower trace). Shot noise simulated as in B2. (D) S/N ratio for the optical detection of the first action potential in spike trains as in A by a VSFP probe with kinetics identical to VSFP3.1 as function of indicator sensitivity at half activation S1/2 and VSFP membrane density on a 40 × 50 parameter grid. S/N values above 2 are coded according to the color scale to the right. The dashed line indicates the voltage sensitivity of VSFP3.1 for comparison.
Our simulations of the optical response signal indicate that action potentials in Purkinje and L5 neurons are likely to fall below detection threshold in single-trial recordings using VSFP2.3 (Fig. 9 B2), and most certainly in the case of VSFP3.1 (Fig. 9 C2). The obvious reason is that the differential fluorescence responses produced by the action potential transients (VSFP2.3: 0.1%–0.25% per spike; VSFP3.1: 0.05%–0.1% per spike) are too small to overcome the photon noise amplitude, despite robust reporter activation (3%–10% per spike; see Fig. 9, B1 and C1). The spikes become apparent in the optical traces only after averaging a number of trials, e.g., 20 trials (VSFP2.3; Fig. 9 B2, bottom) or 80 trials (VSFP3.1; Fig. 9 C2, bottom). This leads to the prediction that present generation VSFP probes (at the simulated expression level) can report population action potentials in single sweeps when summed over 20 to 80 synchronously discharging neurons, or, that a gain of voltage sensitivity by a factor 4 to 10 would suffice to overcome the noise limit in single trial recordings from individual neurons. Fig. 9 D shows the S/N ratio for action potential detection (single trial) in Purkinje and L5 neurons by a probe with kinetics identical to VSFP3.1 as function of VSFP expression density and voltage sensitivity at half activation S1/2 (defined as fluorescence gain per 100 mV voltage increment at half activation; see the Supporting Material, Eq. 2.6). From these simulations we conclude that with an expression of 500 VSFP units/μm2, for instance, an apparent probe sensitivity of 5%/100 mV (L5 neuron) or 10%/100 mV (Purkinje neuron) can be predicted to reach S/N of 2.
The simulations described above thus lead to the following conclusions: 1), present generation of VSFP indicators offer a sufficiently fast mechanism of activation to track fast neuronal action potentials; and 2), to overcome the detection limit set by photon shot noise a probe with kinetics similar to VSFP3.1 must provide a sensitivity (determined under appropriate conditions, as stated above) of the order of 5%/100 mV or more, depending on expression level and neuron cell type, to report action potentials in single cells.
Trade-off between undesired sensing capacitance and fluorescence S/N
To explore the directions for future improvements of VSFPs, we investigated a parametric model of a generic VSFP indicator that combines the following kinetic properties (see Materials and Methods for details). The model includes a 2-state voltage sensing mechanism (V1/2 = −40 mV; τ1/2 = 2 ms; z = 1.2; δ = 0.5), fast sensor-reporter coupling that allows the charge transfer to be closely tracked by the reporter (RON = ROFF = 2/ms), and a voltage sensitivity (S1/2) of 5%/100 mV. Using the generic VSFP model we carried out simulations designed to elucidate the relationship between sensing capacitance and fluorescence S/N for the example of EPSP-evoked spikes in the L5 neuron model. Because undesired capacitive effects grow linearly with increasing VSFP density (Figs. 3 B and 6 B) one would expect that kinetic parameters that achieve a given S/N at minimal probe expression are advantageous. However, fast charge movements may be deteriorative to action potential initiation (62). We first investigated how the speed of the voltage sensor affects the initiation and reporting of action potentials. For this we plotted the S/N ratio for the first action potential in the soma evoked by a suprathreshold distal-dendritic EPSP (50% above threshold) in the L5 neuron model (Fig. 10 A; same type of simulation as in Fig. 8) as function of VSFP density and VSFP sensing time constants in the range 0.5–10 ms (Fig. 10 B; see Materials and Methods for details). S/N ratios were calculated for a fixed sensitivity S1/2 (5%/100 mV) of the probe. As a measure of the effect of sensing capacitance we evaluated the time lag of the first spike (shift of spike latency in per cent versus control; black contour lines in Fig. 10 B). The data show that, within the simulated parameter range, a gain in S/N always correlates with an increase of spike shift. For a given S/N ratio, on the other hand, the time lag of the spike is minimized by the shortest response time (set to 0.5 ms in these simulations; Fig. 10 B). However, it is important to emphasize that the gain in S/N by faster sensors comes at a price, which is apparent from the VSFP responses to near-threshold EPSPs. To show this, we carried out simulations for synaptic stimuli between 0 to 50% above threshold at fixed VSFP densities of 200, 500, and 1000 units/μm2 (Fig. 10 C). Apparently, the range of EPSPs that produce spike discharges in the absence of VSFPs but fail to elicit a spike in the presence of VSFPs (Fig. 10 C, gray areas) grows with decreasing time constant of the sensor. Furthermore, the range of EPSPs with VSFP-induced spike failure increases almost linearly with VSFP density. We next asked for the most suitable half activation voltage (V1/2) of the sensor by comparing different models with V1/2 values between −120 and +40 mV (sensing time constant 2 ms; 500 VSDs/μm2; Fig. 10 D). These simulations show that shifts in spike timing are largest when V1/2 is between −70 and −60 mV (Fig. 10 D1), whereas the optical response is maximal for V1/2 close to −40 mV (Fig. 10 D2). Thus, a sensor V1/2 of −40 mV (or higher) enables optimal report of action potentials with reduced effect on the timing of EPSP-initiated spikes. Furthermore, the simulations reveal a supra-linear increase of maximum spike shift as function of gating valence, as expected for an effect caused by VSFP sensing capacitance (see Fig. 3 and related text) versus a linear increase of the fluorescence signal (Fig. 10 D3). Therefore, small sensing charges are preferable over larger values as long as the fluorescence response surpasses the detection threshold. For a VSFP to report an action potential with sufficient S/N, the amplitude of the fluorescence response ΔF/F0 is crucial as the S/N of the optical signal grows linearly with the response amplitude, whereas S/N varies with the square root of probe expression (Eq. 8). The absolute value of spike-induced ΔF/F0 amplitude will depend on the kinetic properties of the probe (given by the time constants of all relevant transitions), as well as on the dynamic range of the reporter (given as ΔFmax/F1/2 in our model). Increasing the dynamic range of VSFP probes is an important optimization goal because of the associated linear gain in S/N of the optical response signal. This is illustrated by Fig. 10 E showing the S/N for spike detection as function of reporter dynamic range or voltage sensitivity, respectively, in the generic model (2 ms time constant) at fixed (200 VSDs/μm2; Fig. 10 E1) and variable membrane expression (z =1.2; Fig. 10 E2).
Figure 10.
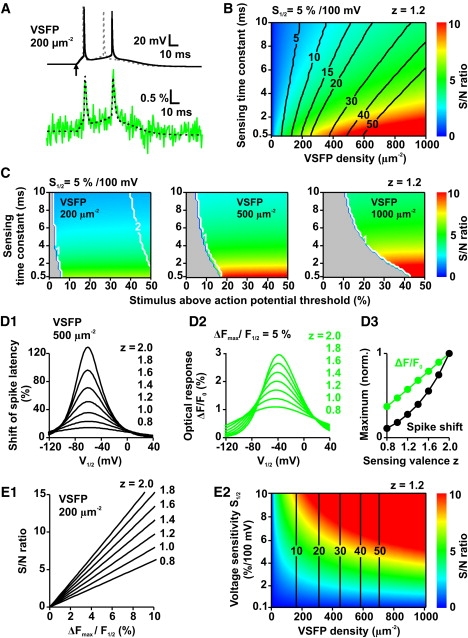
Trade-offs between VSFP S/N and adverse effects of VSFP sensing capacitance analyzed for the case of action potential detection in the layer 5 (L5) pyramidal neuron model. (A) Electrical (top) and fluorescence response (bottom) of the somatic membrane in the L5 neuron model including 200 units/μm2 of a generic VSFP with 1.2 sensing charges (z), −40 mV half activation (V1/2), 5% per 100 mV voltage sensitivity (S1/2) and a sensing time constant (at V1/2) of 2 ms. The stimulus is realized by activation of a distal synaptic conductance (time constant rise: 0.3 ms; decay: 3 ms) with peak conductance 50% above action potential threshold. Onset of the stimulus is indicated by arrow. Also shown are the electrical control response (top; no VSFP included; gray dashed line) and the fluorescence response including simulated photon shot noise (bottom; green) corresponding to 1.5 kHz sampling from a spherical membrane of 25 μm diameter. (B) Fluorescence S/N (color scale given at the right) and VSFP-induced shift of spike latency (in % versus control; black lines) of the first action potential in simulation traces analogous to A as function of the sensing time constant and VSFP density (50 × 40 parameter grid). (C) Values of fluorescence S/N ratio produced by the first action potential in traces analogous to A as function of sensing time constant and synaptic peak conductance (as % deviation from the threshold of action potential generation in absence of VSFP) for 200 (left), 500 (middle), and 1000 (right) VSFP units/μm2. The number of elicited spikes is indicated by white contour lines. Gray areas delimit the range of subthreshold potentials. (D1) Shift of latency of the first spike (in % versus control) in simulations analogous to A with 500 VSFP units/μm2 and a synaptic peak conductance 100% above control spike threshold as function of the voltage of VSFP half activation (V1/2) and for values of gating valence between 0.8 (bottom curve) and 2.0 (top curve) as labeled in the figure. The VSFP sensing time constant was 2 ms. (D2) Fluorescence responses ΔF/F0 produced by the first spike in the same set of simulations as in (D1) assuming a maximum fluorescence dynamic range ΔFmax/F0 of 5%. (D3) Normalized shift of first spike latency (black dots) and fluorescence spike response (green dots) as function of the sensing valence z evaluated from the peak values in D1 and D2. (E1) S/N for spike detection as a function of VSFP dynamic range ΔFmax/F0 in the generic model (2 ms time constant; V1/2 equal −40 mV; 200 VSDs/μm−2). (E2) S/N for spike detection as a function of VSFP voltage sensitivity (S1/2) and VSFP density using the generic model (like in E1; z = 1.2) mapped to the color code to the right. Vertical contour lines represent VSFP-induced shifts of spike latency as in B.
Discussion
Capacitive effects of membrane proteins and voltage sensors
Integral membrane proteins can affect the capacitance of lipid membranes by introducing local changes to the thickness, surface area and/or the dielectric constant of the membrane. As the neuronal plasma membrane holds a large set of membrane-embedded proteins for functions of external signaling, cell homeostasis and adhesion, its capacitance differs from pure lipid bilayers with possible variations between neuron cell types and subcellular compartments (57,63,64). Similarly, expression of nonnative membrane proteins can increase membrane capacitance, e.g., up to 30% as reported previously for the expression of ChR2 (channelrhodopsin-2) at 103–104 units/μm2 in HEK cells (65). Membrane proteins that contain a voltage sensing domain are highly polarizable and confer mobile sensing charge to the membrane dielectric response (28). The physiological effect of recombinant sensing charges in membranes is evidenced in experiments where membranes were loaded with lipophilic anionic molecules like dipicrylamine (DPA) at high membrane concentrations (30,32). Experiments using the hybrid hVOS probe (66) showed reduced and broadened action potentials in mouse skeletal muscle fibers after 5 μM DPA application (67). Furthermore, action potentials were quenched in olfactory receptor neurons of the Drosophila antennal lobe after loading in 1–2 μM DPA solution to an estimated density of 8300 molecules/μm2 and 0.6–1 effective charges per molecule (62). Together with estimated values of up to 370% capacitance increase induced by FlaSH-type of voltage reporter proteins these results have encouraged skepticism with regard to the applicability of genetically encoded voltage probes in neuronal preparations (37). Because FlaSH-type fluorescent protein sensors are based on the complete channel assembly of the Shaker K+ ion channel, they comprise four VSDs with a total of 13 sensing charges per FP sensor unit (11). In this study we simulate the behavior of proteins similar to VSFP2.3 that confer 1.2 nominal sensing charges per FP sensor unit and find more moderate physiological manifestations of probe-induced sensing capacitance. In particular, we find that simulated neuronal excitability is not quenched even in presence of high densities (∼1000 VSDs/μm2) of VSFP-type probes in the neuronal membrane, rather we detect shifts in the timing of action potentials and their initiation thresholds. In the following we will discuss the mechanisms behind these effects and possible ways to minimize them.
Modeling of VSFP kinetics
In this study we considered three reaction models to describe the activation and signaling behavior of VSFPs. The models reflect different degrees of complexity associated with an increasing number of independent kinetic parameters. In our simulations we took a heuristic approach by adopting the simplest model that accurately represented the biophysical aspects of VSFP relevant in a given context. The analysis of VSFP sensing capacitance and its physiological consequences was based on model I that provides a valid approximation of measured sensing currents, irrespective of its shortcoming to reproduce the multi-state dynamics of fluorescence activation seen in the experimental data. Model III gives the most versatile representation of VSFP reaction dynamics in this line of models. Model III is based on the four-state reaction scheme originally conceived by Villalba-Galea et al. (60) to explain the hysteresis behavior of the Q-V activation curve of the VSD from Ci-VSP that manifests as a shift of the Q-V curve dependent on the initial holding potential and activation history. According to this model, long depolarization at high positive potentials greatly increases the likelihood of the protein to settle in the (S++) state and subsequent probing of the membrane reveals the S∗1ON/S∗1OFF charge transfer transition between the (S−−) and (S++) states, because the decay of (S++) to (S+) is slow. Holding the membrane at negative potentials and subsequent probing with positive test pulses will, on the other hand, show the S1ON/S1OFF charge transfer between states (S−) and (S+). Thus, depending on the initial conditions, VSFP sensing currents reflect distinct transitions of the protein. When VSFP2.3 is expressed in Xenopus oocytes, the midpoint of charge activation (V1/2) shifts from −30 mV to −72 mV after prolonged initial polarization of the membrane at +20 mV (59). There are at present no comparable data available from PC12 cells, but model III of VSFP2.3 (derived from fits to experimental data in PC12 cells; Fig. 4 and related text) exhibits a negative shift of V1/2 from −40 mV (holding potential: −90 mV) to −70 mV (holding potential +20 mV) consistent with the observed behavior of VSFP2.3 in oocyte expression. Another consequence of model III concerns the ON and OFF time constants of the sensing current as probed in the classical pulse protocol with positive voltage pulses starting from a negative holding potential as also used in this study (Fig. 4). Whereas the ON process reflects the kinetics of the (S−) to (S+) transition, the OFF process is complex and contains contributions from the (S+) to (S−) and (S++) to (S−−) transitions with the relative weights depending on the height and duration of the test pulse. In the context of this work the question arises as to the implication of the intrinsic VSFP hysteresis for the dynamics of VSFP sensing capacitance in neuronal membranes. Because, in neurons, positive membrane potentials are only attained intermittently for very brief durations, a transient buildup of the protein in the secondary, or “relaxed”, configuration seems unlikely under nonpathological conditions. In our view, because of the stability of the neuron resting state, hysteretic properties of VSFP are therefore not expected to play a major role in shaping the sensing current responses of VSFPs in neurons, under most circumstances. Instead, a single transition of sensing charge transfer, as represented in model I, seems to cover the relevant operational range of VSFP charge activation in neuronal membranes. In model II and III additional sensing charge is implicated in the S2ON/S2OFF transitions as a consequence of the observed voltage-dependence of these transitions. However, the rates for the movement of these charges are slower by order of magnitude than the S1ON/S1OFF rates and the resulting sensing currents thus contribute little to the total sensing capacitance and most likely remain below detection limit in the sensing current measurement.
Sensing capacitive effects of VSFP
Our simulations emphasize the influence on subthreshold electrical transients as the dominant adverse effect of sensing capacitance in VSFP expressing neuronal membranes. By decrementing amplitudes of individual synaptic potentials, sensing capacitance increases the synaptic input threshold for spike initiation in the neuron cell body. This effect on synaptic integration is caused by the higher current that is required to charge the membrane to the level of spike threshold. On the other hand the simulations show that sensors based on the VSD from Ci-VSP exert little effect on supra-threshold discharge behavior of membranes (for expression <1000 VSDs/μm2). Because of the high activation speed of the Na+ current the sensing current lags behind during the spike upstroke and contributes to the repolarization of the potential in a regenerative manner. In addition to this mechanism the robustness of the spike discharge is also supported by the compartmental organization of the cell. Experimental data indicate that action potentials in neurons are generated in the axon initial segment (68–71) where the density of Na+ channels is very high (72). Consistent with these results, the L5 neuron model contains 2000 Na+ channels/μm2 in the axon hillock and axon initial segment (52). Hence, even at high VSFP expression density, e.g., 1000 VSDs/μm2, VSFP sensing currents turn out to be negligible with respect to ion channel gating currents in the axonic membrane (Fig. 7).
Minimizing VSFP sensing capacitance
Because capacitive effects of recombinant sensing charges grow linearly with the membrane density of the recombinant probe, overexpression increasingly perturbs the electrical identity of the targeted neuron. Furthermore, with increasing membrane density of the probe, the capacitive effects increase faster than the associated gain in S/N of the optical recording growing with the square root of the probe density (Supporting Material, Eq. S1.7). In applications of these probes it is therefore advantageous to keep the expression low which limits the S/N of the recorded probe signal. Generally, the suitable S/N in experimental recordings depends on the desired degree of certainty to detect an event of interest in the presence of noise. In optical recordings the most fundamental source of noise arises from the quantum statistics of the molecular photo-absorption and -emission process (photon shot noise; see Supporting Material, Supplement 1). Using threshold event detection the probability of true-positive events in shot noise-limited recordings is a simple function of S/N and detection threshold (Supporting Material, Eq. S1.8). If the detection threshold is set at 1.5 times above baseline noise, for instance, a signal with S/N above 2.8 will be detected with a true positive probability better than 0.90 or, in other words, 90 of 100 events will on average be detected. Under these conditions the false-positive probability will be ∼7% (Fig. S1 B). The inverse relationship between minimization of probe-induced distortion of electrical membrane signaling and the fidelity of discrimination of these events is a fundamental attribute of neuron voltage imaging using VSFP probes. However, various designs can influence the trade-off balance. Using a parameterized generic version of a VSFP probe we documented how the balance is shifted by changes to the VSFP activation curve and response time constants. According to these results, optimized detection of action potentials with minimized disturbance of the membrane mechanisms triggering these potentials is achieved with probes providing ON time constants shorter than 2 ms and voltages of half activation between −40 to −20 mV. In addition, a large voltage sensitivity (S1/2) of the probe is critical to permit lower levels of probe expression and thus reduce sensor capacitive load. In our simulations the dynamic range (ΔFmax/F1/2) of the probe (or, equivalently, the voltage sensitivity S1/2 at fixed sensing charge) appears as an independent parameter in the VSFP models. Within these models, therefore, increasing the dynamic range of the probe does not affect probe kinetics and capacitive load but linearly increases S/N (Fig. 10 E1). Intuitively, one would expect that protein modifications yielding faster kinetics and extended dynamic range of the probe signal will involve changes in VSD properties, in particular if they specifically target to the coupling between the VSD and the FP reporter domain. Other modifications, however, may achieve larger probe sensitivity by optimizing the FP reporter with limited backlash on VSD operation and thus without increase of VSFP sensing capacitance. In addition to the possibility to select for kinetically optimized probes, another efficient strategy to optimize the trade-off balance could be to explicitly target the probe to subcompartments in neurons. If, for instance, the main application of the probe is to detect the action potential output of a neuron, as we have assumed in our simulation study, targeting of the sensor to the perisomatic membrane of the cell would eliminate the probe-induced capacitance from dendritic membranes that account for the largest fraction of total surface area of the cell. Simulations using the L5 neuron model with insertion of VSFP2.3 into sub-compartments indeed showed that the largest contribution to probe-induced perturbation originates from VSFP in the apical dendritic arbor, whereas the contributions from VSFP in basal dendrites, cell body and axon remain very small (Fig. S6).
Perspectives
The trade-off between probe-induced interference with native cell functions and the information content delivered by the probe is not limited to voltage indicators, but also applies to other exogenous or genetically encoded probes. Most notably this includes indicators of intracellular Ca2+ concentration that act as chelators of free cytosolic Ca2+ and thus interfere with the function of intrinsic buffer systems of the cell (see Yasuda et al. (73) and references cited therein). Although these optical probes provide the experimental advantage of being noninvasive in the traditional sense, by avoiding macroscopic tissue damage, they must be considered micro-invasive on the cellular level. Understanding the mechanisms of interference with intrinsic cell functions is therefore an important prerequisite for an adequate use of these indicators. Although the simulations in this study are based on experimental data of VSFP probes in PC12 cells and realistic computational models of neurons, ultimately an understanding of their impact in complex living neurons is required. Given the parameters established here, future studies using whole-cell dynamic clamp to add the VSFP sensing capacitance to living neurons could prove particularly insightful. Lastly, it should be noted that detection of action potentials from individual central neurons using a genetically encoded voltage probe, as simulated in this work, has not yet been convincingly demonstrated experimentally in intact neuronal issue under physiological conditions. The most likely reason, as suggested in this study, is that fluorescence responses provided by present generation probes, which includes VSFP2.3, VSFP2.4 (19), VSFP3.1, and the VSFP2.1-derived “Mermaid” (16), are too small to be extracted from single-trial fluorescence recordings. In this situation of ongoing development of these probes, neuron simulations, as presented in this study, help to define adequate target values of improved signaling by future generations of these proteins.
Acknowledgments
We thank Dimitar Dimitrov for the preparation of PC12 cell cultures, Ruth Empson for comments on the manuscript, and Lawrence Cohen for a discussion after a presentation of this work.
The work was supported by an intramural grant from the RIKEN Brain Science Institute (T.K.), by National Institutes of Health grant NS057631 (under a subaward granted by Yale University to T.K.) and a stipend from the Danish Cardiovascular Research Academy (A.L.).
Supporting Material
References
- 1.Cohen L.B., Salzberg B.M., Davila H.V., Ross W.N., Landowne D. Changes in axon fluorescence during activity: molecular probes of membrane potential. J. Membr. Biol. 1974;19:1–36. doi: 10.1007/BF01869968. [DOI] [PubMed] [Google Scholar]
- 2.Loew L.M., Cohen L.B., Salzberg B.M., Obaid A.L., Bezanilla F. Charge-shift probes of membrane potential. Characterization of aminostyrylpyridinium dyes on the squid giant axon. Biophys. J. 1985;47:71–77. doi: 10.1016/S0006-3495(85)83878-9. [DOI] [PMC free article] [PubMed] [Google Scholar]
- 3.Huebner G., Lambacher A., Fromherz P. Anellated hemicyanine dyes with large symmetrical solvatochromism of absorption and fluorescence. J. Phys. Chem. B. 2003;107:7896–7902. [Google Scholar]
- 4.Fromherz P., Hubener G., Kuhn B., Hinner M.J. ANNINE-6plus, a voltage-sensitive dye with good solubility, strong membrane binding and high sensitivity. Eur. Biophys. J. 2008;37:509–514. doi: 10.1007/s00249-007-0210-y. [DOI] [PMC free article] [PubMed] [Google Scholar]
- 5.Antic S., Major G., Zecevic D. Fast optical recordings of membrane potential changes from dendrites of pyramidal neurons. J. Neurophysiol. 1999;82:1615–1621. doi: 10.1152/jn.1999.82.3.1615. [DOI] [PubMed] [Google Scholar]
- 6.Shoham D., Glaser D.E., Arieli A., Kenet T., Wijnbergen C. Imaging cortical dynamics at high spatial and temporal resolution with novel blue voltage-sensitive dyes. Neuron. 1999;24:791–802. doi: 10.1016/s0896-6273(00)81027-2. [DOI] [PubMed] [Google Scholar]
- 7.Slovin H., Arieli A., Hildesheim R., Grinvald A. Long-term voltage-sensitive dye imaging reveals cortical dynamics in behaving monkeys. J. Neurophysiol. 2002;88:3421–3438. doi: 10.1152/jn.00194.2002. [DOI] [PubMed] [Google Scholar]
- 8.Ferezou I., Haiss F., Gentet L.J., Aronoff R., Weber B. Spatiotemporal dynamics of cortical sensorimotor integration in behaving mice. Neuron. 2007;56:907–923. doi: 10.1016/j.neuron.2007.10.007. [DOI] [PubMed] [Google Scholar]
- 9.Grinvald A., Hildesheim R., Farber I.C., Anglister L. Improved fluorescent probes for the measurement of rapid changes in membrane potential. Biophys. J. 1982;39:301–308. doi: 10.1016/S0006-3495(82)84520-7. [DOI] [PMC free article] [PubMed] [Google Scholar]
- 10.Kalyanaraman B., Feix J.B., Sieber F., Thomas J.P., Girotti A.W. Photodynamic action of merocyanine 540 on artificial and natural cell membranes: involvement of singlet molecular oxygen. Proc. Natl. Acad. Sci. USA. 1987;84:2999–3003. doi: 10.1073/pnas.84.9.2999. [DOI] [PMC free article] [PubMed] [Google Scholar]
- 11.Siegel M.S., Isacoff E.Y. A genetically encoded optical probe of membrane voltage. Neuron. 1997;19:735–741. doi: 10.1016/s0896-6273(00)80955-1. [DOI] [PubMed] [Google Scholar]
- 12.Sakai R., Repunte-Canonigo V., Raj C.D., Knöpfel T. Design and characterization of a DNA-encoded, voltage-sensitive fluorescent protein. Eur. J. Neurosci. 2001;13:2314–2318. doi: 10.1046/j.0953-816x.2001.01617.x. [DOI] [PubMed] [Google Scholar]
- 13.Ataka K., Pieribone V.A. A genetically targetable fluorescent probe of channel gating with rapid kinetics. Biophys. J. 2002;82:509–516. doi: 10.1016/S0006-3495(02)75415-5. [DOI] [PMC free article] [PubMed] [Google Scholar]
- 14.Dimitrov D., He Y., Mutoh H., Baker B.J., Cohen L. Engineering and characterization of an enhanced fluorescent protein voltage sensor. PLoS ONE. 2007;2:e440. doi: 10.1371/journal.pone.0000440. [DOI] [PMC free article] [PubMed] [Google Scholar]
- 15.Lundby A., Mutoh H., Dimitrov D., Akemann W., Knöpfel T. Engineering of a genetically-encodable fluorescent voltage sensor exploiting fast Ci-VSP voltage-sensing movements. PLoS ONE. 2008;3:e2514. doi: 10.1371/journal.pone.0002514. [DOI] [PMC free article] [PubMed] [Google Scholar]
- 16.Tsutsui H., Karasawa S., Okamura Y., Miyawaki A. Improving membrane voltage measurements using FRET with new fluorescent proteins. Nat. Methods. 2008;5:683–685. doi: 10.1038/nmeth.1235. [DOI] [PubMed] [Google Scholar]
- 17.Knöpfel T., Diez-Garcia J., Akemann W. Optical probing of neuronal circuit dynamics: genetically encoded versus classical fluorescent sensors. Trends Neurosci. 2006;29:160–166. doi: 10.1016/j.tins.2006.01.004. [DOI] [PubMed] [Google Scholar]
- 18.Baker B.J., Mutoh H., Dimitrov D., Akemann W., Perron A. Genetically encoded fluorescent sensors of membrane potential. Brain Cell Biol. 2008;36:53–67. doi: 10.1007/s11068-008-9026-7. [DOI] [PMC free article] [PubMed] [Google Scholar]
- 19.Mutoh H., Perron A., Dimitrov D., Iwamoto Y., Akemann W., Chudakov D.M., Knöpfel T. Spectrally-resolved response properties of the three most advanced FRET based fluorescent protein voltage probes. PLoS ONE. 2009;4:e4555. doi: 10.1371/journal.pone.0004555. [DOI] [PMC free article] [PubMed] [Google Scholar]
- 20.Murata Y., Iwasaki H., Sasaki M., Inaba K., Okamura Y. Phosphoinositide phosphatase activity coupled to an intrinsic voltage sensor. Nature. 2005;435:1239–1243. doi: 10.1038/nature03650. [DOI] [PubMed] [Google Scholar]
- 21.Logothetis D.E., Movahedi S., Satler C., Lindpaintner K., Nadal-Ginard B. Incremental reductions of positive charge within the S4 region of a voltage-gated K+ channel result in corresponding decreases in gating charge. Neuron. 1992;8:531–540. doi: 10.1016/0896-6273(92)90281-h. [DOI] [PubMed] [Google Scholar]
- 22.Perozo E., Santacruz-Toloza L., Stefani E., Bezanilla F., Papazian D.M. S4 mutations alter gating currents of Shaker K channels. Biophys. J. 1994;66:345–354. doi: 10.1016/s0006-3495(94)80783-0. [DOI] [PMC free article] [PubMed] [Google Scholar]
- 23.Seoh S.A., Sigg D., Papazian D.M., Bezanilla F. Voltage-sensing residues in the S2 and S4 segments of the Shaker K+ channel. Neuron. 1996;16:1159–1167. doi: 10.1016/s0896-6273(00)80142-7. [DOI] [PubMed] [Google Scholar]
- 24.Larsson H.P., Baker O.S., Dhillon D.S., Isacoff E.Y. Transmembrane movement of the Shaker K+ channel S4. Neuron. 1996;16:387–397. doi: 10.1016/s0896-6273(00)80056-2. [DOI] [PubMed] [Google Scholar]
- 25.Aggarwal S.K., MacKinnon R. Contribution of the S4 segment to gating charge in the Shaker K+ channel. Neuron. 1996;16:1169–1177. doi: 10.1016/s0896-6273(00)80143-9. [DOI] [PubMed] [Google Scholar]
- 26.Ahern C.A., Horn R. Specificity of charge-carrying residues in the voltage sensor of potassium channels. J. Gen. Physiol. 2004;123:205–216. doi: 10.1085/jgp.200308993. [DOI] [PMC free article] [PubMed] [Google Scholar]
- 27.Hossain M.I., Iwasaki H., Okochi Y., Chahine M., Higashijima S. Enzyme domain affects the movement of the voltage sensor in ascidian and zebrafish VSPs. J. Biol. Chem. 2008;283:18248–18259. doi: 10.1074/jbc.M706184200. [DOI] [PubMed] [Google Scholar]
- 28.Bezanilla F. The voltage sensor in voltage-dependent ion channels. Physiol. Rev. 2000;80:555–592. doi: 10.1152/physrev.2000.80.2.555. [DOI] [PubMed] [Google Scholar]
- 29.Weiss T.F. MIT Press; Cambridge, MA: 1966. Cellular Biophysics. [Google Scholar]
- 30.Fernandez J.M., Taylor R.E., Bezanilla F. Induced capacitance in the squid giant axon. Lipophilic ion displacement currents. J. Gen. Physiol. 1983;82:331–346. doi: 10.1085/jgp.82.3.331. [DOI] [PMC free article] [PubMed] [Google Scholar]
- 31.Oberhauser A.F., Fernandez J.M. Hydrophobic ions amplify the capacitive currents used to measure exocytotic fusion. Biophys. J. 1995;69:451–459. doi: 10.1016/S0006-3495(95)79918-0. [DOI] [PMC free article] [PubMed] [Google Scholar]
- 32.Zimmermann D., Kiesel M., Terpitz U., Zhou A., Reuss R. A combined patch-clamp and electrorotation study of the voltage- and frequency-dependent membrane capacitance caused by structurally dissimilar lipophilic anions. J. Membr. Biol. 2008;221:107–121. doi: 10.1007/s00232-007-9090-4. [DOI] [PMC free article] [PubMed] [Google Scholar]
- 33.Bezanilla F., Armstrong C.M. Gating currents of the sodium channels: three ways to block them. Science. 1974;183:753–754. doi: 10.1126/science.183.4126.753. [DOI] [PubMed] [Google Scholar]
- 34.Stefani E., Toro L., Perozo E., Bezanilla F. Gating of Shaker K+ channels: I. Ionic and gating currents. Biophys. J. 1994;66:996–1010. doi: 10.1016/S0006-3495(94)80881-1. [DOI] [PMC free article] [PubMed] [Google Scholar]
- 35.Magee J.C., Johnston D. Characterization of single voltage-gated Na+ and Ca2+ channels in apical dendrites of rat CA1 pyramidal neurons. J. Physiol. 1995;487:67–90. doi: 10.1113/jphysiol.1995.sp020862. [DOI] [PMC free article] [PubMed] [Google Scholar]
- 36.Colbert C.M., Johnston D. Axonal action-potential initiation and Na+ channel densities in the soma and axon initial segment of subicular pyramidal neurons. J. Neurosci. 1996;16:6676–6686. doi: 10.1523/JNEUROSCI.16-21-06676.1996. [DOI] [PMC free article] [PubMed] [Google Scholar]
- 37.Sjulson L., Miesenböck G. Optical recording of action potentials and other discrete physiological events: a perspective from signal detection theory. Physiology (Bethesda) 2007;22:47–55. doi: 10.1152/physiol.00036.2006. [DOI] [PubMed] [Google Scholar]
- 38.Hille B. Sinauer Associates; Sunderland, MA: 2001. Ionic Channels of Excitable Membranes. [Google Scholar]
- 39.Schmid G., Goychuk I., Hanggi P. Capacitance fluctuations causing channel noise reduction in stochastic Hodgkin-Huxley systems. Phys. Biol. 2006;3:248–254. doi: 10.1088/1478-3975/3/4/002. [DOI] [PubMed] [Google Scholar]
- 40.Hines M.L., Carnevale N.T. The NEURON simulation environment. Neural Comput. 1997;9:1179–1209. doi: 10.1162/neco.1997.9.6.1179. [DOI] [PubMed] [Google Scholar]
- 41.Hines M.L., Carnevale N.T. NEURON: a tool for neuroscientists. Neuroscientist. 2001;7:123–135. doi: 10.1177/107385840100700207. [DOI] [PubMed] [Google Scholar]
- 42.Akemann W., Knöpfel T. Interaction of Kv3 potassium channels and resurgent sodium current influences the rate of spontaneous firing of Purkinje neurons. J. Neurosci. 2006;26:4602–4612. doi: 10.1523/JNEUROSCI.5204-05.2006. [DOI] [PMC free article] [PubMed] [Google Scholar]
- 43.Khaliq Z.M., Gouwens N.W., Raman I.M. The contribution of resurgent sodium current to high-frequency firing in Purkinje neurons: an experimental and modeling study. J. Neurosci. 2003;23:4899–4912. doi: 10.1523/JNEUROSCI.23-12-04899.2003. [DOI] [PMC free article] [PubMed] [Google Scholar]
- 44.Weiser M., Vega-Saenz d.M., Kentros C., Moreno H., Franzen L. Differential expression of Shaw-related K+ channels in the rat central nervous system. J. Neurosci. 1994;14:949–972. doi: 10.1523/JNEUROSCI.14-03-00949.1994. [DOI] [PMC free article] [PubMed] [Google Scholar]
- 45.Chang S.Y., Zagha E., Kwon E.S., Ozaita A., Bobik M. Distribution of Kv3.3 potassium channel subunits in distinct neuronal populations of mouse brain. J. Comp. Neurol. 2007;502:953–972. doi: 10.1002/cne.21353. [DOI] [PubMed] [Google Scholar]
- 46.Martina M., Yao G.L., Bean B.P. Properties and functional role of voltage-dependent potassium channels in dendrites of rat cerebellar Purkinje neurons. J. Neurosci. 2003;23:5698–5707. doi: 10.1523/JNEUROSCI.23-13-05698.2003. [DOI] [PMC free article] [PubMed] [Google Scholar]
- 47.McMahon A., Fowler S.C., Perney T.M., Akemann W., Knöpfel T. Allele-dependent changes of olivocerebellar circuit properties in the absence of the voltage-gated potassium channels Kv3.1 and Kv3.3. Eur. J. Neurosci. 2004;19:3317–3327. doi: 10.1111/j.0953-816X.2004.03385.x. [DOI] [PubMed] [Google Scholar]
- 48.Martina M., Metz A.E., Bean B.P. Voltage-dependent potassium currents during fast spikes of rat cerebellar Purkinje neurons: inhibition by BDS-I toxin. J. Neurophysiol. 2007;97:563–571. doi: 10.1152/jn.00269.2006. [DOI] [PubMed] [Google Scholar]
- 49.Korngreen A., Sakmann B. Voltage-gated K+ channels in layer 5 neocortical pyramidal neurones from young rats: subtypes and gradients. J. Physiol. 2000;525:621–639. doi: 10.1111/j.1469-7793.2000.00621.x. [DOI] [PMC free article] [PubMed] [Google Scholar]
- 50.Kang J., Huguenard J.R., Prince D.A. Two types of BK channels in immature rat neocortical pyramidal neurons. J. Neurophysiol. 1996;76:4194–4197. doi: 10.1152/jn.1996.76.6.4194. [DOI] [PubMed] [Google Scholar]
- 51.Kole M.H., Brauer A.U., Stuart G.J. Inherited cortical HCN1 channel loss amplifies dendritic calcium electrogenesis and burst firing in a rat absence epilepsy model. J. Physiol. 2007;578:507–525. doi: 10.1113/jphysiol.2006.122028. [DOI] [PMC free article] [PubMed] [Google Scholar]
- 52.Mainen Z.F., Joerges J., Huguenard J.R., Sejnowski T.J. A model of spike initiation in neocortical pyramidal neurons. Neuron. 1995;15:1427–1439. doi: 10.1016/0896-6273(95)90020-9. [DOI] [PubMed] [Google Scholar]
- 53.Mainen Z.F., Sejnowski T.J. Influence of dendritic structure on firing pattern in model neocortical neurons. Nature. 1996;382:363–366. doi: 10.1038/382363a0. [DOI] [PubMed] [Google Scholar]
- 54.Reference deleted in proof.
- 55.Swaminathan R., Hoang C.P., Verkman A.S. Photobleaching recovery and anisotropy decay of green fluorescent protein GFP-S65T in solution and cells: cytoplasmic viscosity probed by green fluorescent protein translational and rotational diffusion. Biophys. J. 1997;72:1900–1907. doi: 10.1016/S0006-3495(97)78835-0. [DOI] [PMC free article] [PubMed] [Google Scholar]
- 56.Fettiplace R., Andrews D.M., Haydon D.A. The thickness, composition and structure of some lipid bilayers and natural membranes. J. Membr. Biol. 1971;5:277. doi: 10.1007/BF01870555. [DOI] [PubMed] [Google Scholar]
- 57.Gentet L.J., Stuart G.J., Clements J.D. Direct measurement of specific membrane capacitance in neurons. Biophys. J. 2000;79:314–320. doi: 10.1016/S0006-3495(00)76293-X. [DOI] [PMC free article] [PubMed] [Google Scholar]
- 58.Bean B.P. The action potential in mammalian central neurons. Nat. Rev. Neurosci. 2007;8:451–465. doi: 10.1038/nrn2148. [DOI] [PubMed] [Google Scholar]
- 59.Villalba-Galea C.A., Sandtner W., Dimitrov D., Mutoh H., Knöpfel T. Charge movement of a voltage sensitive fluorescent protein. Biophys. J. 2009;96:L19–L21. doi: 10.1016/j.bpj.2008.11.003. [DOI] [PMC free article] [PubMed] [Google Scholar]
- 60.Villalba-Galea C.A., Sandtner W., Starace D.M., Bezanilla F. S4-based voltage sensors have three major conformations. Proc. Natl. Acad. Sci. USA. 2008;105:17600–17607. doi: 10.1073/pnas.0807387105. [DOI] [PMC free article] [PubMed] [Google Scholar]
- 61.Armstrong C.M., Bezanilla F. Charge movement associated with the opening and closing of the activation gates of the Na channels. J. Gen. Physiol. 1974;63:533–552. doi: 10.1085/jgp.63.5.533. [DOI] [PMC free article] [PubMed] [Google Scholar]
- 62.Sjulson L., Miesenböck G. Rational optimization and imaging in vivo of a genetically encoded optical voltage reporter. J. Neurosci. 2008;28:5582–5593. doi: 10.1523/JNEUROSCI.0055-08.2008. [DOI] [PMC free article] [PubMed] [Google Scholar]
- 63.Thurbon D., Luscher H.R., Hofstetter T., Redman S.J. Passive electrical properties of ventral horn neurons in rat spinal cord slices. J. Neurophysiol. 1998;80:2485–2502. doi: 10.1152/jn.1998.79.5.2485. [DOI] [PubMed] [Google Scholar]
- 64.Chitwood R.A., Hubbard A., Jaffe D.B. Passive electrotonic properties of rat hippocampal CA3 interneurons. J. Physiol. 1999;515:743–756. doi: 10.1111/j.1469-7793.1999.743ab.x. [DOI] [PMC free article] [PubMed] [Google Scholar]
- 65.Zimmermann D., Zhou A., Kiesel M., Feldbauer K., Terpitz U. Effects on capacitance by overexpression of membrane proteins. Biochem. Biophys. Res. Commun. 2008;369:1022–1026. doi: 10.1016/j.bbrc.2008.02.153. [DOI] [PubMed] [Google Scholar]
- 66.Chanda B., Blunck R., Faria L.C., Schweizer F.E., Mody I. A hybrid approach to measuring electrical activity in genetically specified neurons. Nat. Neurosci. 2005;8:1619–1626. doi: 10.1038/nn1558. [DOI] [PubMed] [Google Scholar]
- 67.DiFranco M., Capote J., Quinonez M., Vergara J.L. Voltage-dependent dynamic FRET signals from the transverse tubules in mammalian skeletal muscle fibers. J. Gen. Physiol. 2007;130:581–600. doi: 10.1085/jgp.200709831. [DOI] [PMC free article] [PubMed] [Google Scholar]
- 68.Stuart G., Hausser M. Initiation and spread of sodium action potentials in cerebellar Purkinje cells. Neuron. 1994;13:703–712. doi: 10.1016/0896-6273(94)90037-x. [DOI] [PubMed] [Google Scholar]
- 69.Stuart G., Spruston N., Sakmann B., Hausser M. Action potential initiation and back propagation in neurons of the mammalian CNS. Trends Neurosci. 1997;20:125–131. doi: 10.1016/s0166-2236(96)10075-8. [DOI] [PubMed] [Google Scholar]
- 70.Khaliq Z.M., Raman I.M. Relative contributions of axonal and somatic Na channels to action potential initiation in cerebellar Purkinje neurons. J. Neurosci. 2006;26:1935–1944. doi: 10.1523/JNEUROSCI.4664-05.2006. [DOI] [PMC free article] [PubMed] [Google Scholar]
- 71.Palmer L.M., Stuart G.J. Site of action potential initiation in layer 5 pyramidal neurons. J. Neurosci. 2006;26:1854–1863. doi: 10.1523/JNEUROSCI.4812-05.2006. [DOI] [PMC free article] [PubMed] [Google Scholar]
- 72.Kole M.H., Ilschner S.U., Kampa B.M., Williams S.R., Ruben P.C. Action potential generation requires a high sodium channel density in the axon initial segment. Nat. Neurosci. 2008;11:178–186. doi: 10.1038/nn2040. [DOI] [PubMed] [Google Scholar]
- 73.Yasuda R., Nimchinsky E.A., Scheuss V., Pologruto T.A., Oertner T.G. Imaging calcium concentration dynamics in small neuronal compartments. Sci. STKE. 2004;2004:l5. doi: 10.1126/stke.2192004pl5. [DOI] [PubMed] [Google Scholar]
Associated Data
This section collects any data citations, data availability statements, or supplementary materials included in this article.