

Abstract
Neutrophils have a remarkable ability to detect the direction of chemoattractant gradients and move directionally in response to bacterial infections and tissue injuries. For their role in health and disease, neutrophils have been extensively studied, and many of the molecules involved in the signaling mechanisms of gradient detection and chemotaxis have been identified. However, the cellular-scale mechanisms of gradient sensing and directional neutrophil migration have been more elusive, and existent models provide only limited insight into these processes. Here, we propose a what we believe is a novel adaptive-control model for the initiation of cell polarization in response to gradients. In this model, the neutrophils first sample the environment by extending protrusions in random directions and subsequently adapt their sensitivity depending on localized, temporal changes in stimulation levels. Our results suggest that microtubules may play a critical role in integrating all the sensing events from the cellular periphery through their redistribution inside the neutrophils, and may also be involved in modulating local signaling. An unexpected finding was that model neutrophils exhibit significant randomness in timing and directionality of activation, comparable to our experimental observations in microfluidic devices. Moreover, their responses are robust against alterations of the rate and amplitude of the signaling reactions, and for a broad range in chemoattractant concentrations and spatial gradients.
Introduction
Neutrophils have an amazing capacity for finding the location of specific infection or inflammation targets and protecting the body against bacteria and other microorganisms, and are emerging as important players in many immune responses (1). To accomplish their important functions, neutrophils have to navigate effectively in complex environments by making use of specific chemical gradients usually centered at the target location (2). Although many of the molecules involved in these processes have been identified through molecular biology techniques, we still know very little about how the overall signaling circuits and individual pieces act together effectively (3,4).
How neutrophils are able to polarize themselves and establish the internal “compass” that would direct their movement is a fundamental question not yet fully answered. To address this problem, several models have been proposed that bridge the existing knowledge of the polarization processes from signaling molecules to global circuits and integrate sometimes disparate molecular interactions into cohesive functional strategies. However, most of these models are limited to particular aspects of the gradient sensing and molecular mechanisms involved. Several models are able to describe how polarization is maintained, yet most of these do not provide satisfactory explanations about how the polarization is initially achieved. For example, a mechanism proposed by Xu and others (5) emphasizes the reciprocal inhibitory interaction between actin and actomyosin, but it is limited to the maintenance of polarization, and cannot fully explain how the two components of cytoskeleton are divergently distributed in the beginning. Other models have been developed based on reaction-diffusion principles (6). These models combine local excitation and global inhibition mechanisms (7), or two second messengers with distinct dynamics (8), to produce polarization of cells in the direction of the gradient. More recently, it has been demonstrated that models combining local excitation and global inhibition mechanisms and autocatalytic reactions (9) or positive feedback loops (10) have bistable kinetics and replicate symmetry breaking during cell polarization in the presence of chemotactic gradients. A general limitation of these models is that although a number of locally generated inhibitors have been suggested that can diffuse in the whole cell, no fast-diffusing inhibitor required by these models has yet been identified inside neutrophils. Other models based on known molecular interactions (11), “first hit” mechanisms (12), or “fast and slow positive feedback loops” (13) can also predict cell polarization in asymmetric chemical fields but are not able to adapt adequately to changes in conditions around cells. Finally, phenomenological models have been proposed for eukaryotic cells based on responses to temporal changes in chemoattractant concentrations (14) analogous to sensing mechanisms in bacteria (15), assuming preexistent asymmetry inside the cells (16) or random walk biased by noisy receptor signaling (17,18), but their potential molecular substrate remains elusive.
The lack of adequate experimental systems for precise control of environment and quantitative observations of neutrophil responses has been for a long time one important limitation to developing adequate biophysical models for neutrophil gradient sensing and polarization functions. In this context, new experimental tools that can generate precisely controlled gradients are increasingly being used in biology laboratories to systematically characterize cellular responses to chemical gradients. These new tools, built using microfluidic technologies, allow unmatched control over specific gradient features such as concentration and gradient profile and enable quantitative studies of cellular responses (for a comprehensive review, see Keenan and Folch (19)). Although some of the greatest contribution of microfluidic devices to a better understanding of neutrophil chemotaxis has been related so far to their ability to produce extremely stable chemical gradients (20), new capabilities for fast perturbations of gradients may contribute even more to our understanding of cellular sensing and adaptation mechanisms. Historically, observations of cellular responses to rapid changes in their environment proved very helpful for studying integration of electrical (21), chemical (22), or osmotic stimuli (23,24) at the whole-cell level. In the case of chemotaxis, neutrophil responses to rapid changes in the direction or average concentration of chemoattractant enabled by microfluidic devices suggested that neutrophils are responsive to the spatial gradient and the temporal changes in chemoattractant concentration (25). However, a better understanding of this new body of information can come only from biophysical models that integrate quantitative experimental results and existing knowledge of intracellular signaling mechanisms.
Here, we propose a what to our knowledge is a new biophysical model for neutrophil responses to chemical gradients that has been developed based on quantitative observations of neutrophil responses to gradient switches in microfluidic systems. We focus on the transitory process through which resting neutrophils become asymmetric and orient in the direction of chemical gradients, before major changes in cell morphology or cell movement. We demonstrate that the synergy between localized temporal sensing through expanding pseudopods and whole-cell integration of the temporal information by microtubules could be responsible for the cell orientation in chemoattractant fields. The chemotactic stimulus causes a local stabilization of microtubules, which contribute to the sensitivity modulation of the peripheral chemoattractant sensing. In this adaptive-control type of system, cells can detect the direction of a spatial gradient and remain responsive to changes in the direction of the gradient after the initial events of polarization. Stochastic responses of the cells to the initiation of the gradient are predicted by the model and correlated with experimental observations. This model could serve as a working hypothesis and help identify mechanistic links between the microtubules, local signaling events, and localized cytoskeleton interactions in neutrophils, and potentially in other cells, during polarization responses.
Materials and Methods
Biophysical model
We have developed an adaptive-control model for cell orientation in the direction of a chemoattractant gradient. In this model, the cellular response is achieved through the interplay between local sensing of temporal concentration changes at the periphery of the cells and global redistribution of microtubules inside the entire cell. We propose that at the local level, microtubule stability is modulated by localized responses to extracellular chemoattractant changes. This results in redistribution of microtubules at the whole-cell level. At the same time, the internal asymmetry of microtubule distribution modulates the formation of actin-driven protrusions at the cell periphery, affecting the local signaling events. The net result of this chain of events is that protrusions in regions of increasing concentration will be favored versus protrusions in regions of the cell that experience negative concentration changes in time (Fig. 1, left). Localized, temporal changes in concentration at the cellular periphery can be produced either directly, by changes in the environment, or indirectly, through the formation and growth of protrusions at the cellular periphery in a spatially heterogeneous environment. Although local signaling events are more sensitive to the temporal aspects of chemoattractant stimulation, global asymmetry of microtubule stability integrates the spatial information about the distribution of chemoattractant levels around the cell (Fig. 1, right). The modification of the internal structure and function of a system in response to outside conditions is the defining characteristic of adaptive-control systems.
Figure 1.
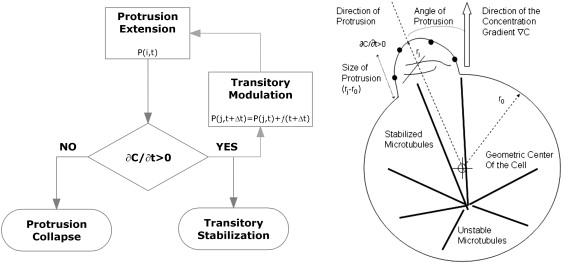
Schematics of the adaptive-control model for cell polarization. (Left) Immediately after exposure of the chemoattractant, small protrusions formed in random directions at the periphery of neutrophils sample the environment around the cell with uniform probability P(i,t) in all directions. Protrusions growing against the direction of the gradient experience decreasing concentration and eventual collapse, whereas protrusions growing in the direction of the gradient experience increasing chemoattractant concentrations and are stabilized. In parallel with the stabilization, the probability of forming new protrusions is modulated by f(j,t) depending on previous experience, allowing the cell to optimize the sampling in the direction of the gradient, that is, the probability of forming new protrusions in the direction of concentration increase is also augmented. This mechanism through which neutrophils optimize their responses during the exposure to the gradient, based on previous events, has the defining characteristics of adaptive control. (Right) Our hypothesis is that modulation of protrusion activity is achieved through differential stabilization of the microtubules at the cell periphery. For a cell of average radius r0, the formation of a protrusion of size ri at some small angle from the direction of the chemoattractant gradient will temporarily stabilize microtubules in that direction, maintaining unstable microtubules through the rest of the cell.
The seven basic assumptions of the model are outlined in the model schematics in Fig. 2 as follows. 1), Chemoattractant receptors are uniformly distributed at the periphery of the cell. 2), Stimulation of the receptors by the chemoattractant molecules has immediate local effects. 3), Receptor stimulation promotes the localized accumulation of an inhibitor that remains localized. 4), There are a limited number of microtubules inside a cell that exhibit a dynamic behavior with alternating periods of spontaneous growth and collapse, and distribute randomly in a radial direction in the absence of stimuli, starting from a microtubule organizing center. 5), The dynamic behavior of the microtubules is altered by the signaling events at the periphery of the cells, leading to their redistribution inside the cell. 6), The presence and functional state of the microtubules in turn modulates the signaling and the formation of protrusions at the periphery of the cells. 7), Depending on the relative direction of expanding protrusions and chemoattractant gradient, the receptors on the surface of protrusions can experience additional increases or decreases in chemoattractant concentration during the expansion events.
Figure 2.
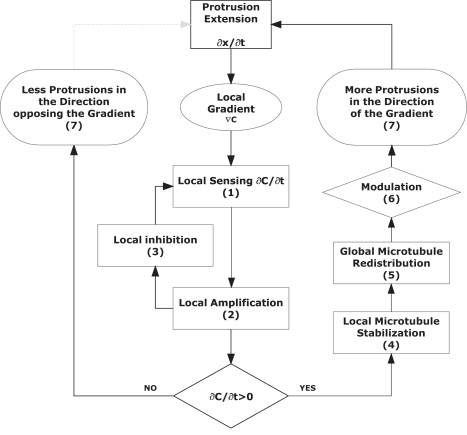
Implementation of the adaptive-control model for gradient sensing in neutrophils is based on seven basic assumptions. Sensing of the chemoattractant is a local event (1) and sensitivity to concentration changes is achieved through the interplay between local amplification (2) and local inhibition (3) events. After chemoattractant stimulation, protrusions form at the periphery of the cells and in the case of protrusions forming in the direction of the gradient, microtubules are locally stabilized (4), leading to their redistribution in the entire cell (5) and modulation of the formation of new protrusions (6). The positive feed-back amplification loop changes the distribution of microtubules in the cell, and biases the formation of increasingly larger protrusions in the direction of the gradient (7). The formation of protrusions in directions that do not result in local increase of concentration will collapse and, after the redistribution of microtubules, will become less frequent as the polarization of the cell progresses. The dynamic character of the microtubules and the transitory stabilization ensures that the neutrophil remains responsive to unexpected changes in the direction and amplitude of the chemoattractant gradient, a distinctive characteristic of adaptive-control systems.
The model is described using the set of parameters defined in Table 1 and a set of 16 equations. The cell periphery is divided into N segments, each segment identified by the angle ϕ between the direction of the gradient and the location of the segment on the cell periphery (Fig. 1):
| (1) |
Localized chemoattractant concentration, Ci, at the cell periphery in a stable gradient is a function of the average local concentration (C) and the relative slope (S) of the gradient:
| (2) |
For each segment, a number of receptors (R), inhibitors (I), mediators (M), and microtubules (T) are present in active (A) or inactive (I) form. The conservation of the total number of receptors (r), inhibitor (j) and mediator molecules (m), and molecules participating in the formation of the protrusions (p) in each of the segments is described in the equations
| (3) |
| (4) |
| (5) |
| (6) |
The numbers of receptors, inhibitors, mediators, and microtubules are nonnegative integers.
Table 1.
Complete list of parameters used in the model
| Description | Symbol |
Value | |
|---|---|---|---|
| Model | Solver∗ | ||
| Number of segments on cell periphery | N | NSEG | 12 |
| Average chemoattractant concentration | C | C | 1 nM |
| Chemoattractant gradient slope | S | S | 0.1 μm−1 |
| Angular orientation of a segment in terms of gradient | ϕ | — | 0–2π |
| Total number of microtubules | τ | TI | 24 |
| Number of receptors per segment | r | R | 20 |
| Number of inhibitors per segment | j | I | 20 |
| Number of mediators per segment | m | M | 10 |
| Maximum size of protrusion | p | P | 100 μm3 |
| Average cell radius | r0 | — | 5 μm |
| Rate of receptor activation | aR | aR | 0.1 nM−1 s−1 |
| Rate of receptor inactivation | iR | iR | 0.1 s−1 |
| Rate of inhibitor formation | aI | aI | 0.01 s−1 |
| Rate of inhibitor destruction | iI | iI | 0.001 s−1 |
| Rate of mediator formation | aM | aM | 0.01 s−1 |
| Rate of mediator destruction | iM | iM | 0.1 s−1 |
| Rate of microtubule activation | aT | aT | 1 s−1 |
| Rate of microtubule collapse | iT | iT | 0.1 s−1 |
| Rate of protrusion expansion | aP | aP | 0.0001 μm3s−1 |
| Rate of protrusion retraction | iP | iP | 0.01 μm3 s−1 |
| Protrusion shape conversion factor | ρ | k | 10 |
| Protrusion volume/length dimensional factor | n | n | 3 |
The corresponding parameters in the Gillespie simulation of the adaptive control model for neutrophil polarization are shown for comparison.
The rate of receptor activation depends on the number of receptors that are available for binding (RI), the concentration (Ci) of the chemoattractant, the additional concentration increase from the extension of the protrusion, and the rate of spontaneous receptor inactivation (iR) in the presence of the inhibitor (IA). Several simplifying assumptions are incorporated at this stage of the model. We only considered a small concentration change in the vicinity of the cells, and within this range we assumed linear dependence between chemoattractant concentration and receptor stimulation. We quantified the increase in stimulation due to increasing concentration when a protrusion forms and displaces the segment in the radial direction, depending on the angular position of the segment (ϕ), the slope of the gradient (S), and the displacement of the segment in the spatial gradient. We calculated the displacement from the size of the protrusion (PA) and corrected it by a conversion factor (ρ) and a dimensional factor (n) to take into account the shape of the protrusion and the conversion of the volume change to linear displacement. The following equations can be written for each segment at the cell periphery. Please note that we have dropped the index i from Eqs. 3–12.
| (7) |
Activation of the receptors induces activation of downstream mediator molecules (MA) and of the localized inhibitor (IA):
| (8) |
| (9) |
To take into account the redistribution of microtubules inside the cell, we consider first that the number of microtubules is conserved at the whole-cell level:
| (10) |
where TA represents the number of localized and stabilized microtubules in each segment, TI represents the number of unstable microtubules in the entire cell and is a global variable, and τ signifies the total number of microtubules conserved at the whole-cell level. With these notations, we then describe the dynamic aspect of microtubules and localized stabilization in response to chemoattractant:
| (11) |
Finally, protrusions are formed at the cell periphery, and their size depends on the stimulation through the mediator and microtubules and the availability of substrate for protrusion growth:
| (12) |
The numbers of receptors, inhibitors, mediators, and microtubules per segment can be very low (Table 1), prompting the use of stochastic modeling approaches. In particular, of all the molecular species, the number of microtubules takes on the lowest values per segment. To account for the stochastic effects that arise from the small number and the instability of microtubules, we present a master equation that would describe the evolution of the probability of having τi stabilized microtubules in cellular segment Ni if the active receptor number, RA, is held constant:
| (13) |
| (14) |
where the probability of having τ1 microtubules in section 1, τ2 in section 2, …, and τN in section N is P(τ1, τ2,…, τN;t), the number of all active microtubules is τA = τ1 + τ2 + … + τN, and the microtubule stabilization and destabilization rates are aT, and iT, respectively, as described before. Rearranging and taking the limit :
| (15) |
Since the timescale of microtubule dynamics is not very different from that of other processes (Table 1), and all molecules occur in relatively low numbers per cell segment, we implemented a stochastic version of the entire model and solved it numerically using the “Dizzy” software (26) (Institute for Systems Biology, Seattle, WA) and the “Gillespie-direct” simulator for stochastic processes (27).
We modeled the periphery of the cell as a series of N = 12 distinct segments arranged in a circle, each segment corresponding to an angular size of 30°. The number of segments was chosen considering the average size of the protrusions observed experimentally during stimulation. Each segment contained a number of receptors, mediators, and inhibitors, all starting as inactive (see Appendix A). A number of 24 microtubules/cell was considered, initially inactive and randomly distributed inside the cell. The dynamic aspect of microtubules was integrated as slow accumulation and fast redistribution rates, as a first-order approximation of the growth and stabilization parameters for microtubules. Four coupled reactions, including the stimulation of receptors, stabilization of microtubules, expansion of protrusions, and change in receptor stimulation upon expansion of the protrusion, are linked in a positive feedback loop. Only one protrusion can be formed at one location. The values for the conversion factors take into consideration the conversion between volumetric expansion and linear displacement (n = 3), the maximum observed size of a protrusion (∼5 μm), and the maximum shape factor of elongated protrusions (ρ < 10). The values for the average chemoattractant concentration (C = 1 nM) and relative gradient slope (S = 0.1) were chosen within the order of magnitude of the conditions used experimentally. To simulate the conditions during the gradient switches, we used the theta function in Dizzy, which allowed us to assign two different values to parameter α during two successive time intervals (Appendix B). To stimulate the transition to uniform gradient, Eq. 3 was modified to take into account not only a sudden jump between two concentrations but also a slower transition as described by the linear function , where t is the time for concentration stabilization after switching.
| (16) |
The complete list of parameters used in the simulation is presented in Table 1.
Polarization index
To quantify the process of the cell's initial polarization, we define the polarization index to measure the deviation of the cell's circumference from a perfectly circular shape. We considered no cell movement, maintaining the center of the originally unpolarized, perfectly circular cell as the origin of our coordinate system throughout the simulations. To do this, we assumed that the unpolarized cell in the absence of a concentration gradient has a perfectly circular shape, with a well-defined center that is also the center of our coordinate system. The membrane of such a circular cell is located at the same distance (uniform radius), r0, from the circle's center. After exposure to the gradient, the formation of protrusions changes the distance from the original center to the tip of the protrusion. Since here we only study the cell's initial polarization (without any cell movement or significant cell deformation), we measure how the distances ri from this immobile cell center of each of the N cell sections change in time (Fig. 1 right). These distances can be measured experimentally, or can be calculated based on the original radius, r0, and the linear dimension of the protrusion:
| (17) |
To calculate the polarization index, at any given time we define the Shannon entropy of cell shape (28) as
| (18) |
where
| (19) |
The polarization index, ip, is defined as
| (20) |
where
| (21) |
is the maximum entropy associated with the initial, perfectly circular cell shape. This definition is similar to the synchronization index used to characterize the synchronization of stochastic oscillators (29). By these definitions and the use of the distribution of radii as a proxy for the distribution of choices of direction, we assume that the cell's estimate of the “true” direction at any time is a random variable chosen with probability pi proportional to the radii ri of different segments of the membrane.
Circular variance
To quantify the acquisition of asymmetry by the polarizing cell, we also define the circular variance to measure the deviation of the cell's circumference from a perfectly circular shape with respect to the direction of the external chemical gradient (30). The circular variance, calculated from the probability of the cell to move in the direction θi, is assumed to be proportional to the relative size of the protrusion in that particular direction, pi, as defined previously (Eq.19):
| (22) |
where μ is the direction of the gradient and N the number of segments. The circular variance is 1 for a perfectly circular cell and can be 0 if and only if the distribution of protrusions is concentrated narrowly and exclusively along the direction μ. In practice, the circular variance will always be >0 for a finite cell radius and finite width of protrusions and will take the minimal value for a cell that is asymmetric, with one large protrusion matching the axis of the gradient in either direction.
Experimental Methods
A microfluidic device capable of fast switching between independent chemoattractant gradients was employed to observe the fast changes in human neutrophil morphology immediately after exposure to linear gradients and during changes in slope and/or direction of chemoattractant gradients.
Device microfabrication
The microfluidic device was fabricated in polydimethylsiloxane (PDMS) on glass using standard microfabrication technologies, as previously described (25). Briefly, one layer of SU8 (Microchem, Newton, MA) was patterned on two silicon wafers using photolithography processing in a class 1000 cleanroom. The wafers were used as molds for casting PDMS. One wafer was used as a mold for a 100-μm-thick network layer and a second wafer as a mold for a 3-mm-thick control layer. The network and control PDMS layers were aligned on top of each other and on a thin glass coverslip (0.1 × 25 × 60 mm, Fisher Scientific, Pittsburgh, PA) and bonded after exposure to oxygen plasma. Tygon tubing (TGY100, Small Parts, Miami Lakes, FL) was used to connect the microfluidic device to a syringe pump. The control layer was connected, also using Tygon tubing, to regular 1-mL syringes used to manually actuate the valves.
Neutrophil isolation
Human neutrophils were isolated from whole blood from healthy volunteers using a protocol involving red blood cell lysis and gradient sedimentation, as previously described (25). Cells were loaded in the device through a separate port and allowed to attach to the glass surface for 5 min before establishing the gradient of interleukin 8 (IL8, 10 nM) in Hanks' balanced salt solution (Fisher).
Chemotaxis assay
Neutrophils were first exposed to buffer for ∼5 min, after which they were exposed to an IL8 chemoattractant gradient of 0–10 nM over the 500-μm width of the channel. Subsequently, five types of switches were performed: 1), transition from no gradient to stable gradient; 2), transition from high slope gradient to low slope gradient (step down to a 0- to 1-nM gradient); 3), gradient direction inversion (flip to a 10–0 gradient); 4), two successive gradient direction inversions with a 5-min interval (two flips); and 5), transition from no gradient to uniform chemoattractant (no gradient, 1 nM). For some of the experiments, neutrophils were incubated in nocodazole (10 ng/mL) for 30 min before being exposed to combinations of IL8 gradients and nocodazole at uniform concentrations for 15 min. Each experimental condition was repeated at least three times.
Image analysis
Time-lapse imaging at 6 frames/min was employed to acquire images of the cells before and after the gradient switch. Cells were manually analyzed for the direction, size, and timing of protrusions. The time for full polarization was defined by the formation of a large, stable protrusion leading to displacement of the cell by more than one cell length in any direction (Fig. 3). The size of protrusions was quantified and angles were recorded in increments of 30°, clockwise, from 0 to 360° relative to the direction of the gradient.
Figure 3.
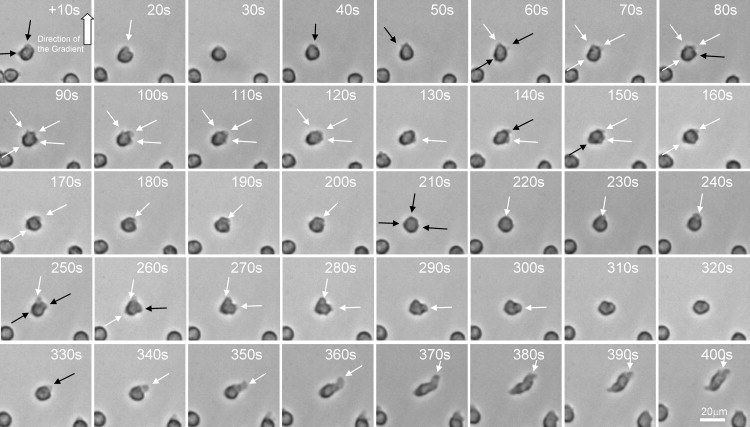
Serial imaging of a neutrophil after fast exposure to a stable chemoattractant gradient, showing the formation of transitory protrusions at the periphery of the cell. New protrusions are indicated by black arrows and existent protrusions by white arrows. Images were recorded every 10 s after the initiation of the gradient; the direction of the chemoattractant gradient is indicated by the thick white arrow. Scale bar, 20 μm. The initial formation of small and transitory protrusions is later followed by the formation of increasingly larger protrusions in the direction of the gradient. A large protrusion in the direction of the gradient will eventually transform into a leading edge and the polarized neutrophil will start moving in the direction of the chemoattractant gradient.
Results
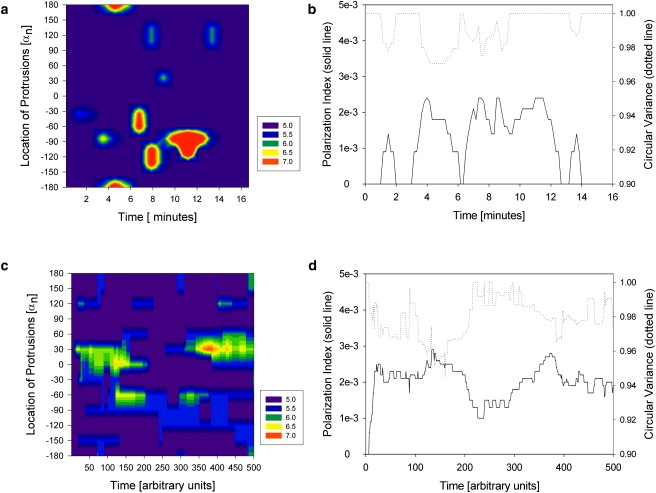
We analyzed the cellular morphology changes in >50 human neutrophils after fast exposure to a stable gradient of IL8 chemoattractant. In the majority of the neutrophils, we observed the formation of small protrusions, randomly distributed at the cell periphery, within seconds after establishing the gradient. In the absence of the chemoattractant, the aspect of the neutrophils is spherical, with no evident protrusions, and cells are immobile. After exposure of the cell to the chemoattractant, the large majority of neutrophils display a few small protrusions that are transitory for the first few minutes, growing and collapsing relatively fast while the cell remains immobile. In time, a larger and more stable, dominant protrusion will develop in the direction of the gradients, and this will be associated with physical displacement of the cell in the direction of the gradient. One example of a neutrophil forming several protrusions after exposure to IL 8 chemokine gradient is presented in successive micrographs in Fig. 3. A more detailed analysis of the location and size of the protrusions showed that after the early, apparently random distribution of protrusions, subsequent protrusive events are more frequent toward the front end of the cell, in the direction of the gradient (Fig. 4 a). The simulated behavior of protrusive responses upon initial exposure to chemoattractant gradients is qualitatively similar to that observed in experiments (Fig. 4 c). Immediately after exposure to chemoattractant in a gradient, smaller protrusions are formed in random directions. If a protrusion grows in the direction of the gradient, the probability of growth or formation of new protrusion at the same location is increased, due to local microtubule stabilization. The change in local sensitivity in response to changing conditions is a defining characteristic for adaptive-control systems.
Figure 4.
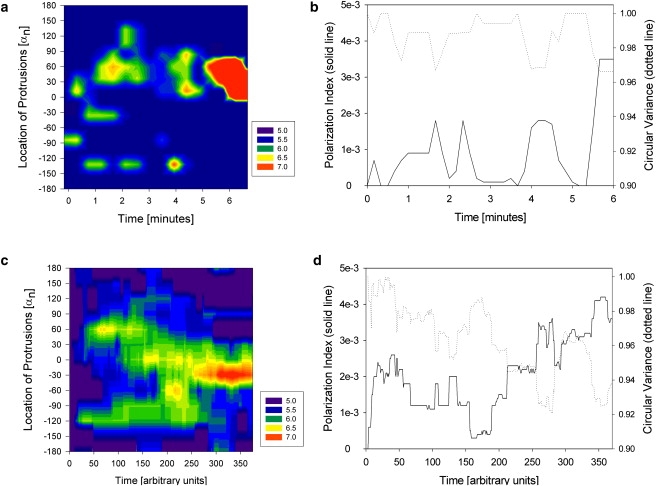
Overview of the position and size of protrusions on a neutrophil and evolution of the polarization index in time after sudden exposure to stable gradient in experiments (a and b) and simulations (c and d). (a and c) The time, angle with respect to the direction of the gradient, and radius of the cell at different locations on the cell circumference are indicated in contour maps. The local size of the cell radius is color-coded as detailed in the legend at the right of the figure. (b and d) The polarization index of the cell increases after stimulation at the same time that the circular variance decreases with the acquisition of polarization, with dynamics comparable between the cell and the model. The polarization index is defined according to the Shannon entropy: iP = 1 − S/Smax, where S is the Shannon entropy associated with the normalized distribution, p, of the cell's radius between 0 and 360°, S = −Σ(p∗log(p)), and Smax is the maximum value of the Shannon entropy (corresponding to a completely circular shape). The circular variance is defined as the average accuracy of anticipated movement based on the distribution, p, of the cell's radius ν = 1 − 1/N Σ(p∗|cos(θ − μ))| in all directions θ relative to the direction μ of the gradient.
To evaluate the role of microtubules during the polarization process, we exposed cells to a known microtubule inhibitor, nocodazole. We observed the changes of cellular shape in 30 neutrophils pretreated with nocodazole and after exposure to the same IL8 chemoattractant gradient, as in previous experiments. We documented the formation of multiple protrusions immediately after exposure to the chemoattractant, comparable to those observed in the absence of nocodazole. One typical example of nocodazole-treated neutrophil response to an IL8 gradient is presented in Fig. 5 a. In contrast to untreated cells, we observed that even larger protrusions were only temporary and could not stabilize into persistent polarization of the cell. In addition, the direction of these large protrusions did not seem to correlate with the direction of the gradient, suggesting that the microtubules have a role in stabilizing protrusions in the direction of the gradient. We compared simulation and experimental results and observed that when the number of microtubules in a cell is reduced from 24 to 8 (representing 33% of the “optimal” microtubule number), the protrusions not only appear in random locations but are also less stable (Fig. 5 c). This behavior is qualitatively comparable to the responses of nocodazole-treated neutrophils, in which the number of microtubules that can be activated is reduced by the action of the drug.
Figure 5.
Overview of the position and size of protrusions on a neutrophil preincubated with nocodazole and the evolution of the polarization index in time after exposure to stable gradient. Both experimental results (a) and simulations (c) show that protrusions are less stable and neutrophils are unable to polarize in the direction of the gradient. The local size of the cell radius is color-coded as detailed in the legend at the right of the figure. In simulations, the number of microtubules was reduced from 24 to 8 microtubules/cell. Time evolution of the polarization index shows that in cells with altered microtubule activity, the sampling of the environment by protrusions is ineffective and cells are not able to polarize effectively (b and d). Time evolution of the circular variance around the average value of 1 is an additional indicator of the lack of polarization in the direction of the gradient (b and d).
We used the polarization index and circular variance (defined in Methods) to compare the simulated and experimental polarization of neutrophils responding to a gradient increase. We observed good qualitative agreement between the experimental and simulated processes of polarization. Analysis of the polarization index and circular variance shows two distinct phases for the neutrophil response to an IL8 gradient (Fig. 4, b and d). The first epoch corresponds to the sampling of the medium by protrusions, characterized by a low polarization index, circular variance close to the initial value of 1, and frequent return to the unpolarized state. The second epoch corresponds to a relatively stable, high value of the polarization index that does not drop below a positive threshold. The buildup of information does not occur progressively, but rather in bursts, and the behavior of the simulated cells is comparable to that of the neutrophils. The memory of the system is short, with rapid loss of information, but over time, orientation information is progressively accumulated, leading to cell polarization in the direction of the chemical gradient. In the presence of the microtubule inhibitor nocodazole, although the cells reach the first epoch, they cannot advance to the second epoch of polarization, and they do not build up orientation information (Fig. 5, b and d). This suggests that microtubules make a very important contribution in processing information about the cell's chemical surroundings.
In the absence of a gradient, neutrophils lose their ability to polarize, and fast transitions from buffer to uniform concentrations of chemoattractant (time 0) do not lead to cell polarization. The protrusions that form during exposure to uniform chemoattractant are smaller in size and less stable, similar to those observed after neutrophils are exposed to nocodazole (Fig. 6 a). By comparison, our model also predicts the formation of transitory protrusions in random directions for very short periods of time when the chemoattractant is present in uniform, stable concentrations around the cells. A fast concentration increase during the transition (a complete transition between buffer and uniform chemoattractant conditions over 50 time units) does not result in cell polarization (Fig. 6 b). Interestingly, our model predicts that when the concentration increase is four times slower (over 200 time units), cells can transiently form larger protrusions in random directions (Fig. 6 c). Some of these protrusions could temporally persist after stabilization of the concentration (vertical red line). After some time, the new protrusions are comparable in size and frequency with those predicted after fast concentration transitions. Validation of the predicted differences between fast and slow IL8 concentration changes will require new experimental tools, which are being developed at this time.
Figure 6.
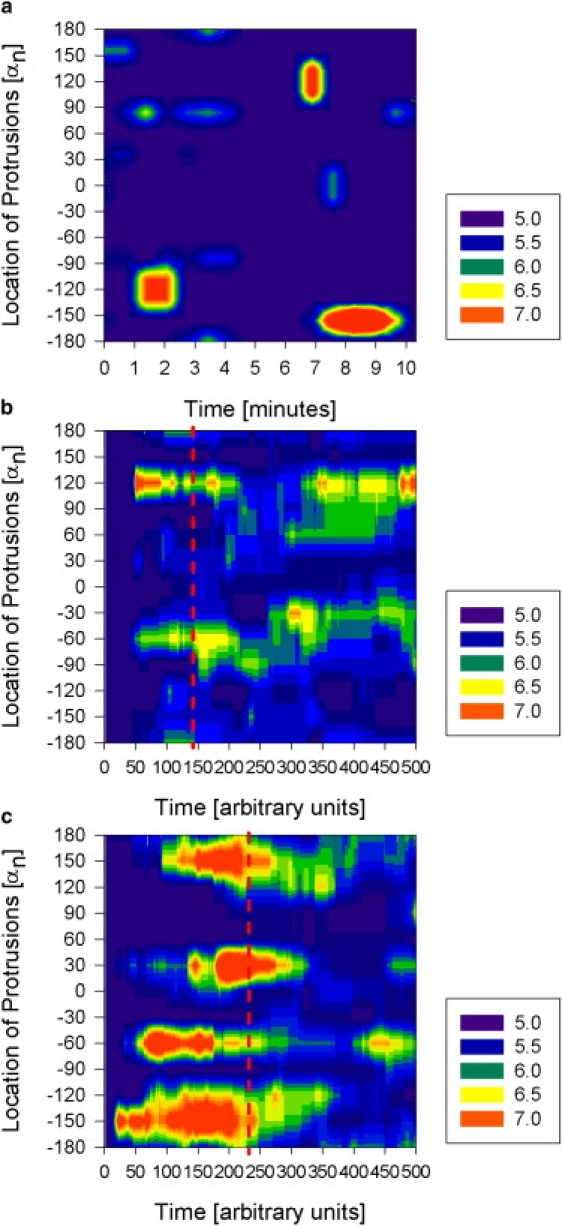
Overview of the position and size of protrusions on a neutrophil after exposure to uniform concentrations of chemoattractant. (a) Our experimental observations indicate that after a fast concentration increase, protrusions are unstable and neutrophils cannot attain stable polarization in any direction. (b) When the concentration increase is fast (<10 time units), simulations predict no polarization. (c) When the concentration increase is slower, over 200 time units, many large protrusions can form during the concentration increase and some could temporarily persist even after stabilization of the concentration (vertical dashed line). The local size of the cell radius is color-coded as detailed in the legend at the right of the figure.
One surprising result has emerged from the comparison of neutrophil polarization time after two successive flip switches. Although the average time for polarization was statistically the same for the first and second switch, direct comparison of the polarization times for the same cell revealed no correlation between the two response times (Fig. 7 a). Statistical analysis using a paired Student's t-test of the two responses showed no significant difference between the mean polarization times (p = 0.20, N = 30). At the same time, regression analysis of the two responses reveals no correlation between responses from the same cell, as the regression slope is flat (s = 0.08, R2 = 0.005). A similar lack of correlation between the times required for polarization of the cells during the initial exposure and after the gradient change can be predicted by simulations using our adaptive-control model (Fig. 7 b). The times for polarization before and after gradient exposure are statistically similar (p = 0.1, N = 50), and, as in the case of experimental observations, the times for polarization during the first and second exposure are random for each simulated cell (s = 0.07, R2 = 0.006).
Figure 7.
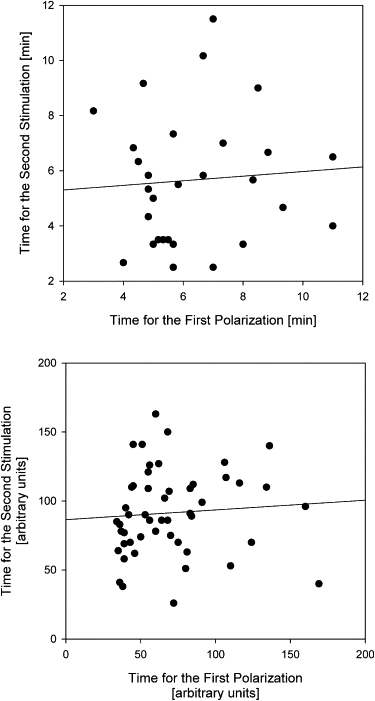
Random distribution of times to polarization in neutrophils during exposure to the initial gradient and after a gradient switch. Experimental results (a) and simulations (b) show a lack of correlation between the time required for the initial polarization and the time required for polarization after the flip switch. The regression line indicates the lack of correlation between the two successive cellular responses to identical changes in microenvironment (slope = 0.08 and R2 = 0.005 for experimental results; slope = 0.07 and R2 = 0.006 for simulations of cells in 1 nM chemoattractant and 20% spatial gradient).
To evaluate the essential role of microtubules in cell gradient sensing, we compared the activation level of receptors in simulated cells that are exposed to the same gradient but have a different number of microtubules. Simulation results show that after an initial surge in the number of receptors activated due to the transition from buffer to chemoattractant (relative time interval 0–25), the number of activated receptors decreases to ∼6% for all conditions considered. For the segment on the cell periphery exposed to the highest concentration, the average fraction of activated receptors in a 20% gradient slope is 6.6% for cells with 24 microtubules, 6% for those with 8 microtubules, and 5.9% for those with no microtubules. Similarly, for cells with 24 microtubules exposed to gradient of the same average concentration (1 nM) but a shallower slope of 2%, 5.9% of receptors are activated (Fig. 8 a). The variation in the fraction of activated receptors is comparable for all four conditions considered (Fig. 8 a, inset). What is different in the four conditions is how the activated receptors are distributed at the cell periphery. Preferential formation of protrusions in the direction of the gradient, which is modulated by the microtubules, increases the fraction of activated receptors on the side of the cell in the direction of the gradient, and decreases the fraction of those on the opposite side. A fourfold difference in the fraction of activated receptors between the front and the back of the cell (relative to the direction of the gradient) is predicted by our model in cells with 24 microtubules, a difference that decreases to twofold for cells with 8 microtubules, and to <1.1-fold in the absence of microtubules (Fig. 8 b). Although the difference in receptor activity between the front and back of the cell is comparable between the cell with no microtubules in a 20% gradient and the cell with 24 microtubules in a 2% gradient, only the latter is able to polarize effectively in the direction of the gradient, underscoring again the critical role that microtubules play in the directional sensing and polarization of neutrophils.
Figure 8.
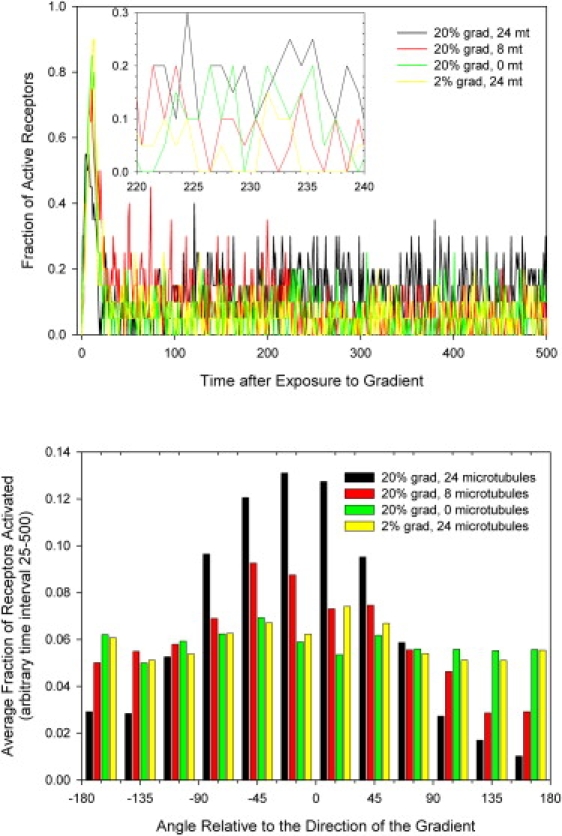
Simulation results showing the fraction of receptors activated in cells with different numbers of microtubules and exposed to different gradients. (a) A higher fraction of receptors is activated in the segment of the cell exposed to the highest concentration, in conditions of 20% gradient slope, for cells with 24 microtubules, compared to cells with 8 or no microtubules in similar conditions, or cells with 24 microtubules in a 2% gradient. (b) The distribution of the activated receptors shows larger differences between the number of receptors in the segments in the direction of the gradient compared to segments in the opposite direction, but only for cells with larger number of microtubules and in 20% gradient conditions.
To further evaluate the role of microtubules in gradient sensing and directional polarization of cells, we simulated the behavior of a cell with a different number of microtubules. We observed equal probability of functional polarization in the direction of the gradient as well as in directions that deviate by ±15° from the direction of the chemoattractant gradient for cells with 30, 24, 18, or 12 microtubules/cell (Fig. 9 a). The probability of polarization in directions other than that of the gradient decreases quickly with increasing angle, and no cells appeared to polarize in directions opposing the gradient. We found that cells with large numbers of microtubules (TI = 30) have the ability to polarize faster (Fig. 9 b), although they achieve the polarization with less precision. A smaller number (TI = 12) of microtubules did not significantly affect the ability of cells to polarize in the direction of the gradient. However, smaller numbers of microtubules increase the time interval between exposure and polarization, and only 50% of the cells have the ability to polarize effectively.
Figure 9.
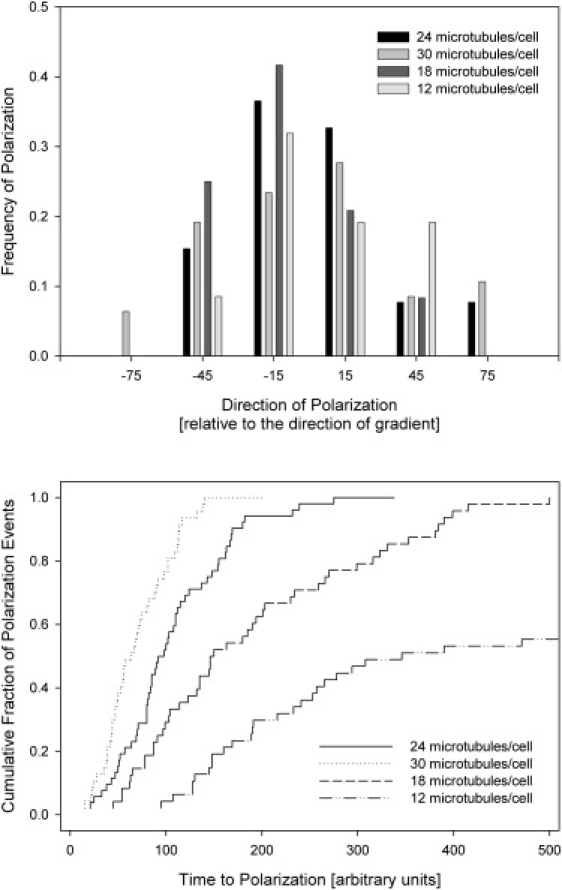
Effect of the number of microtubules on the directionality of neutrophil responses after exposure to gradient. (a) The frequency of precise polarization in the direction of the gradient is higher for cells with TI = 24 microtubules (black) than for cells with TI = 30 microtubules (light gray), and decreases slowly with decreasing numbers of microtubules (TI = 18, dark gray; and TI = 12, white). (b) Cumulative distribution of time to polarization in cells with different numbers of microtubules (TI = 24, solid line; TI = 30, dotted line; TI = 18, dashed line; and TI = 12, dash-dotted line). For TI = 12 microtubules, only 50% of cells are able to polarize effectively within 500 time units after being exposed to the gradient.
We evaluated the responses of the adaptive-control model cell to the initiation of gradients of different slopes, from 0.2% to 100%, at the same average concentration of C = 1 nM. We made the simplifying assumptions that all receptors remain localized at the tip of the protrusion and all receptors experience maximum concentration change corresponding to the direction of protrusion extension. The results from our simulations showed that the precision of orientation is at a maximum for the steeper gradients (10% and 50%) and decreased in shallower gradients. In a 0.2% gradient, ∼70% of the cells were able to polarize, with 20% of polarized cells matching the direction of the gradient within ±15°, and >60% within ±90° of the direction of the gradient (Fig. 10 a). The calculated probability of cell polarization in directions matching that of the gradient decreased with the decreasing slope of the stimulation gradient. The average time necessary for a cell to polarize was longer in shallow gradients (0.2–2%) (Fig. 10 b).
Figure 10.
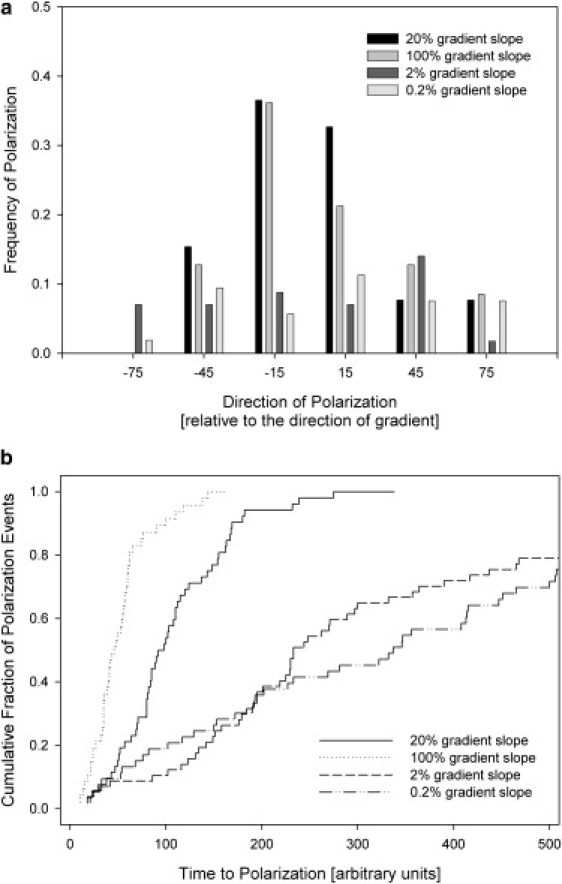
Simulation results showing the directionality of cell responses to chemoattractant gradients of different slopes. (a) The model predicts a higher frequency of polarization responses in the direction of the gradient for cells in steeper gradients (20%, black, and 100%, light gray) than for those in shallower gradients (2%, dark gray; and 0.2%,. white). (b) The polarization is achieved more slowly and for only a fraction of cells in shallower compared to steeper gradients. (20%, solid line; 100%, dotted line; 2%, dashed line; and 0.2%, dash-dotted line).
We evaluated the sensitivity of the model to variations of the reaction rate and the number of starting molecules. The model was able to accommodate changes of up to two orders of magnitude in most of the parameters, and such changes did not alter the ability of the virtual cells to polarize in at least 10% of the simulation runs, with the direction of polarization within ±90° of the direction of the gradient in >50% of the successfully polarized cells (Fig. 11, a and b). Parameters were changed one at a time, and ∼200 simulations were run for each condition. The model appears to be the most sensitive to the total number of microtubules (TI) and the activation of peripheral protrusions (PA). The model can accommodate changes of at least two order of magnitude in the initial number of signaling molecules in the cell. The model also predicts the ability of the cell to polarize over changes of more than three orders of magnitude in the average concentration and two orders of magnitude in spatial gradient slope.
Figure 11.
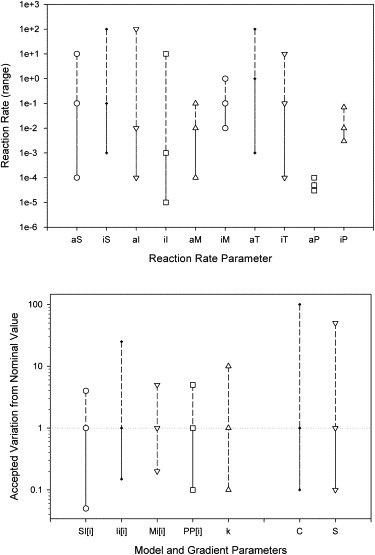
Sensitivity analysis of the adaptive-control model. (a) The effect of the range of reaction rates on cell polarization. The model is able to accommodate a change of more than two orders of magnitude for most of the parameters, with the exception of protrusion growth and collapse rate. Simulations were run for the “optimal” (TI = 24) number of microtubules/cell and in 20% chemoattractant gradient conditions. (b) The effect of the starting number of signaling molecules/cell on cell polarization. The model is also able to predict cell polarization during a change in the chemoattractant concentration of over three orders of magnitude and a change in the spatial gradient slope of close to two orders of magnitude. A threshold was set for the virtual cells to polarize in the direction of the gradient in >10% of the simulation runs.
Finally, we compared the responses of neutrophils and virtual cells with TI = 24 microtubules to fast temporal changes of the gradient, decreasing the slope of the gradient (step-down) or reversing the direction of the gradient (flip). We observed more than 40 neutrophils in the microfluidic experimental setting that allows for the two types of fast changes of a chemoattractant gradient. We noticed that neutrophils quickly lose their polarization after the switch, become perfectly spherical, and then repolarize slowly in the direction of the new gradient. The process of polarization shows the same succession of protrusive events as observed during the initiation of polarization after prior exposure to gradient. When the slope of the gradient is decreased and its direction preserved, early protrusions are formed at the cell periphery in locations independent of the direction of the gradient and are gradually stabilized in the direction of the gradient (Fig. 12 a). The simulated cell exhibited comparable behavior after the average chemoattractant concentration was decreased and the slope of the gradient changed (Fig. 12 c). After the direction of the gradient is changed, early protrusions are formed randomly, and prominent, stable protrusions form in the new direction of the gradient (Fig. 12 b), a behavior that is also replicated by the simulated cells (Fig. 12 d) and is comparable to the polarization of the cell after prior exposure to the gradient or slope decrease.
Figure 12.
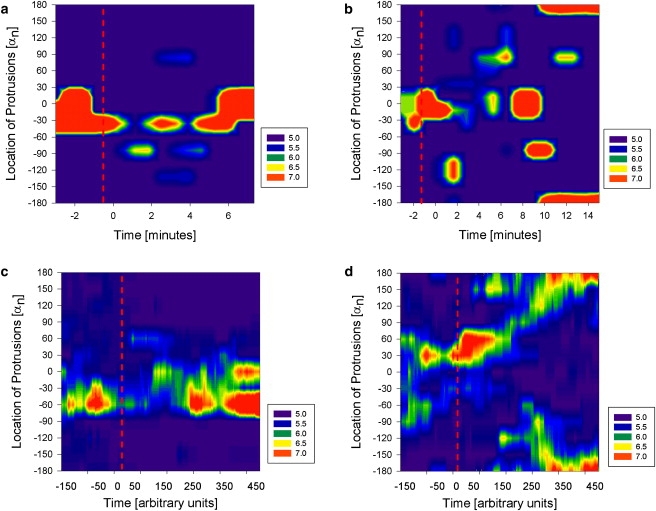
Experimental (a and b) and simulated (c and d) results, showing the dynamics of protrusions for one “representative” neutrophil exposed to step-down (a and c) and flip (b and d) gradient switches. Neutrophils were exposed to IL8 gradient for at least 5 min before the gradient change. For simulations, we present only the last 250 time points before the switch. The local size of the cell radius is color-coded as detailed in the legend at the right of the figure.
Discussion
We present an adaptive-control model for neutrophil responses to chemical gradients in which microtubules and temporal sensing mechanisms play a central role in modulating and integrating the information from localized sensing events at the cellular periphery. In this model, the process of sensing the chemoattractant gradient is altered both locally and globally by the microtubules that modulate a positive feedback loop between surface chemoattractant receptors and actin polymerization. In the process, the redistribution of the microtubules inside the cell changes the magnitude of responses in different regions of the cell. This type of change in overall sensitivity across all of the cells is comparable to the engineered adaptive-control systems in which the control law used by a controller to cope with time-varying or uncertain parameters also changes in time. In our model, the distribution of microtubules inside the cell can be altered by localized stimulation, and in turn, the presence of microtubules can alter receptor activation and downstream signaling and promote the growth of actin-supported protrusions at the periphery of the cell. Consequently, the sensitivity of the system is increased in regions of higher chemoattractant concentration as it is decreased in regions of lower concentration. The ability of the system to remodel itself with the processing of external conditions is a defining characteristic of adaptive control (31). The result of adaptive control is a model that is robust to changes in number of starting molecules, reaction rates, and extracellular conditions (concentration and gradient), and is able to respond appropriately to changes in its environment.
To our knowledge, the proposed model is the first to integrate the protrusions and microtubules into an adaptive-control model of cell polarization in chemical gradients. The protrusion can mechanically move the receptors inside a chemical-gradient field and lead to changes in receptor stimulation, depending on the relationship between the direction of protrusion and the direction of the gradient. For the positive feedback loop to be engaged, the protrusions have to grow in the direction of the gradient, and temporally increase stimulation of the receptors. No amplification is possible when protrusions grow toward lower concentrations in the gradient, or when the inhibitor level is transiently higher than the equilibrium for the new concentration. Although the concept of gradient sampling through protrusions was proposed more than 50 years ago (14), to our knowledge, this is the first model capable of predicting high amplification of an extracellular gradient, is relatively robust to alterations of signaling pathways, and can adapt quickly to changes in extracellular conditions. The critical element for these capabilities is the microtubules that during the extension of the protrusion will become progressively stabilized in the direction of positive concentration change. Later, the integration of local signaling from the periphery of the cell is accomplished progressively through redistribution of microtubules inside the cell, and this establishes cellular asymmetry along the direction of the gradient.
The short-lived asymmetry in microtubule distribution inside the cell is an important feature for maintaining cellular responsiveness to changes in the environment. If one compares the microtubule distribution with a memory system, the dynamic characteristics of the microtubules and the local negative feedback loop assure that the memories are short-lived (32). This characteristic is also evident from the evolution of the polarization index and Shannon entropy during the polarization process. The cell is acquiring information about its environment fast, but it also “forgets” it quickly. Experimental observations have shown an average time of 30 s between changes in chemical gradient conditions and cellular responses (25). From an information point of view, the acquisition of persistent polarization is an unstable equilibrium state that can only be maintained by continuous acquisition of information. The resulting asymmetry in the direction of the gradient, as measured by the circular variance, also supports a gradual improvement in the accuracy of detecting the direction of the gradient. This is completely lost in the absence of microtubules, despite experimental evidence and modeled results showing the formation of large protrusions. This model is the first that we know of to suggest that stochasticity in time and direction of neutrophil polarization upon exposure to a gradient is related to microtubule instability rather than to random activation of the receptors.
The predicted cell response to uniform gradients is the formation of transitory protrusions in random directions. This type of response is qualitatively comparable to observed responses in neutrophils exposed to uniform concentrations of chemoattractants. Transitory polarization of the cell is possible, but the location of larger-size protrusions is random around the cell. This behavior is also qualitatively comparable to that seen with microtubule inhibition by nocodazole, because in both situations the positive amplification resulting from the sensing of the gradient is disrupted. However, one important difference is that in uniform-attractant conditions, the virtual cell preserves its sensitivity to chemoattractant due to the presence of random microtubules at the periphery, resulting in protrusions that form frequently but have a shorter lifetime. One interesting result predicted by simulations is the formation of larger protrusions during the slow increase in chemoattractant concentration. These protrusions do not lead to stable polarization, probably because they appear in random positions around the cell, and no position is favored in particular. We also observed this effect in the first time steps after stimulation of a cell with a gradient. Experimental validation of the differences predicted between fast and slow concentration changes in the presence of a spatial gradient would require new technologies. At present, slow (minutes to hours) gradient changes can be achieved in traditional transwell assays, and fast gradient changes (seconds) in microfluidic systems with valves or photochemical release of caged molecules (33). Although photochemical release of caged signaling molecules is more versatile with respect to the timing of cell stimulation, very few small molecules with chemotactic properties are now available, and no other microfluidic system exists that can perform precise temporal changes of spatial gradients over a continuous range of time from fractions of seconds to hours.
One very interesting particularity of the proposed adaptive-control model is that it captures the randomness in the time required for polarization for similar cells in similar conditions and the relative imprecision of the direction of polarization. Random timing and imprecise direction of polarization are both explained in the model as being a consequence of the limited number of microtubules inside the neutrophils and the quantal effects of each microtubule adjustment. These stochastic effects are larger than the noise resulting from the stimulation of the receptors (34) due to the smaller number of microtubules per cell segment and the amplification effects of the positive feedback loop. Both effects also compare well with experimental observations during neutrophil exposure to gradient switches, when neutrophils display variable degrees of accuracy in detecting the direction of the gradient, depending on the steepness of the gradient (35,36), and with systematic observations of protrusive activity in Dictyostelium during chemotaxis (37,38). Overall, the lack of correlation between responses of the same cell to gradient switches is a very interesting result, and our model identifies the microtubules as the major source of response variability.
The stochastic responses of neutrophils and the involvement of microtubules predicted by our model suggest that microtubules could be involved in stochastic responses of other cell populations as well. Although this mechanism acts at a biological level different from that of other mechanisms for varying cellular responses, e.g., the bursts in RNA transcription (39,40) due to slow promoter-activation events (41–44), or the burstlike translation of some mRNA into proteins (45), the underlying theme of a major factor with a small molecule number controlling the stochastic dynamics of the entire system is similar. Our model suggests that the functioning of complex proteins in general, and of microtubules in particular, could be another source of variability, which will therefore be larger than would be expected from the noise of chemical interactions alone. This mechanism operates faster, on the order of seconds or minutes, compared to those involved in translation and transcription, which are usually much slower. Moreover, our model suggests a temporal variability in individual cell response to identical stimuli rather than a variation of properties between cells in populations. One immediate practical implication of this model is that further studies of neutrophil chemotaxis mechanisms would need to consider the quantitative aspects of individual cell responses rather than the average responses of cell populations.
Supporting evidence for the basic assumptions of the model
This model is supported by our observations and by previous reports in the literature. The use of microfluidic systems allowed us to make detailed observations of morphological changes occurring immediately after fast changes in the primary neutrophil microenvironment and to have very precise and reproducible control over the conditions to which cells are exposed. The model is also based on previous experimental observations of neutrophil responses to rapid gradient switching, which first led us to the hypothesis that temporal sensing mechanisms are very important for neutrophil responses during microenvironment changes (25). Two core elements of the adaptive-control model described here, which were suggested by the early experiments, are a peripheral sensing mechanism and a global averaging mechanism, with both mechanisms sensitive to temporal changes in chemoattractant concentrations. To implement the temporal sensitivity in our model, we considered a mechanism of fast inhibition of local signaling by the generation of a rapidly decaying inhibitor. Whenever extracellular chemoattractant concentration increases, the formation of inhibitor will trail the stimulation, resulting in continuous downstream stimulation. Whenever the concentration is steady or decreasing, the signaling is blocked because of the accumulation of degrading inhibitor. A new equilibrium has to be established between the stimulus and the inhibitor levels before the cell can respond to new stimuli. To implement the global averaging mechanisms in our model, we took advantage of the conservation of microtubule number inside neutrophils. However, although their number is constant, their distribution inside the cell is variable and is affected by localized temporal events at the periphery. Because microtubules themselves can modulate these events, they play the role of a master integrator of information from the cell periphery and coordinator of responses from different sections of the same cell.
A key idea for the model is the involvement of microtubules in the cellular response to the chemoattractant gradient as an additional modulator of direct pathways. It has been proposed that microtubules serve as a mechanism for the polarization of cells in general (46), and particularly of neutrophils, based on observations in the context of disorders of the microtubule assembly, as in the Chédiak-Higashi syndrome, which is characterized by, among other alterations, a marked increase in tyrosinolyation of the alpha chain of tubulin (47). However, it is still not precisely known whether microtubules are directly involved in neutrophil polarization (3,48), and several reports have indicated that both disruption and stabilization of microtubules can disrupt directional migration (49). Moreover, it is not clear whether the repositioning of the microtubule organizing center is the cause or the result of cell polarization (50,51), although observations in neurons suggest that morphological and functional polarization and the location of new axon formations are favored at sites closer to the centrosome (52). In our model, the continuous expansion and collapse of the microtubules is assumed to modulate and be modulated by the localized signaling pathways in the periphery of the cell. The resulting asymmetry of microtubule stability, which is established by interactions at the cell periphery, functions as a directional compass. The dynamic behavior of microtubules assures that the compass can be quickly updated by events at the cell periphery.
All of the basic assumptions in the proposed model are supported by a brief review of the literature. Although it is by no means comprehensive, and alternative mechanisms may also be involved, this review may be helpful in the transition from a functional to a mechanistic model and in designing further experiments to help refine the model.
-
1.
The first assumption, that the receptors for the chemoattractant molecules are distributed uniformly at the periphery of the cell, is supported by experiments using fluorescently tagged receptor molecules (53). Even after stimulation, the distribution of these receptors at the periphery of the cell is uniform (53). Within minutes after stimulation, the number of receptors is decreasing by >95% (54), from ∼20,000 receptors/cell to just a few thousand/cell (55,56). In agreement with the calculated surface density of the IL8 receptors, which can be as low as 2/μm2 immediately after stimulation, our model also considers a small number of receptors on the cell surface.
-
2.
The second assumption, that the effects of receptor stimulation are predominantly local, is supported by several experimental observations. Evidence of localized pulses of second-messenger phosphatidylinositol 3,4,5-trisphosphate with a duration of 30–90 s and stochastically distributed at the cell periphery has been noted in fibroblasts upon stimulation in the presence of a gradient (57). Several proteins from the cytosol were reported to translocate in localized domains on the membrane after receptor activation (58). Rapid conversion from uniform distribution of signaling GTP-ase Rac at the cell periphery in the absence of stimulation to localization in distinct and transitory foci at the front and back of the cell was directly observed in neutrophils after stimulation using fluorescence resonance energy transfer imaging techniques (59). In our model, the periphery of the cell is divided into segments that function independently, a rough but functional simulation of localized signaling.
-
3.
Experiments have also shown that the local effects of receptor stimulation have a temporal adaptation component (60), where the signaling is the strongest immediately after the application of the stimulus (58) and decays over time, with the simultaneous activation of inhibitory mechanisms with slower kinetics (61). In the proposed model, we consider an inhibitor that is slowly produced locally and does not diffuse between segments at the periphery or through the cells. Potential candidates are phosphatidylinositol 3,4,5-trisphosphate, through the inhibition of upstream signal Rac (62), and LIM kinase (63,64), through regulation of cofilin activity (65).
-
4.
The limited number of microtubules is important for establishing whole-cell asymmetry through localized positive feedback loops. It is known that larger cells, e.g., monocytes, have, on average, 35 microtubules/cell (66), and smaller cells, like neutrophils, only average 23 microtubules/cell (67,68). The radial distribution of microtubules assures equal access of the active microtubule ends to the periphery of the cell (69). Because only a limited number of microtubules can be stabilized at the same time in one cell, the asymmetry in microtubule distribution, with the preponderance of microtubules at the front of the cell, has the effect of reducing the sensitivity at the back of the cell compared to that at the front. This is important if one considers that when a cell moves, the back of the cell is displaced in the direction of the gradient as well, and would experience a temporal increase in chemoattractant concentration. Observations from experiments in which micropipettes are moved relatively slowly from the front to the back of the cell support the idea of decreased sensitivity on the sides and at the back of polarized cells (5).
-
5.
Local interactions that promote or alter the stability of microtubules have been described in several cell types (70,71). Experimental studies have demonstrated the heterogeneity of microtubule behavior inside cells, as well as the increase in the fraction of stabilized microtubules in polarized cells from 30% to 70% after stimulation (72). In neurons, the local stability of the microtubules is a signal for axonal and dendrite formation and neuronal polarization (73). In slime mold, microtubules are preferentially stabilized at the cell front, closer to higher concentration (74). In epithelial cells, exposure to growth factors increases the interval between growth and collapse activity of the microtubules from an average of 6 to an average of 20 s (72). In fibroblasts, microtubules are stabilized at the front end of the cell either by direct interaction with Rho GTPases like CDC42 (75,76), LPA (77,78), CLIP170 (79), CLASP2 (80), and other molecules, or by mediation using mDia (81) or Stathmin/op18 (82–84). Alternative pathways for the stabilization of microtubules through adhesion complexes, either directly (85) or indirectly through other signaling molecules, may also be involved (86).
-
6.
Also at the local level, we assumed that microtubules can modulate actin polymerization and the formation of protrusions at the periphery of the cells. Stabilization, as well as destabilization, of microtubules has been shown to interfere with molecules involved in actin polymerization at the periphery of the cells (70,87). Preferential stabilization of a pseudopod closer to the micropipette tip was completely abolished by microtubule inhibitors in amoebae (88). The role of microtubules in modulating the signaling pathway is not without controversy, however. On one hand, it has been reported that extension of pseudopods precedes centrosome repositioning by an average of 10 s, suggesting that microtubules do not play a role in the directional migration of the cells, and are just passively following polarization (51). On the other hand, the effect the microtubule-disrupting drugs have of inducing intrinsic polarity in neutrophils (89), and the inverse correlation between the number of functional microtubules and the random migration in neutrophils under agarose assay (68), support the role of microtubule stabilization in the formation of stable protrusions. It is possible that repositioning of the centrosome depends not only on microtubules but on other associated proteins as well, e.g., dynein, which may explain the reorientation delay (90,91), or TsuA kinase, which has very recently been shown to associate with microtubules and play a critical role in pseudopod persistence and slime mold orientation in the direction of chemical gradients (92). It is also possible that destabilization of microtubules may play a role in cell polarization, through the release of guanine-nucleotide-exchange factors (e.g., GEF-H1) that are released from microtubules after depolymerization, and the induction of localized actin polymerization (93). Incubation of neutrophils with colchicines destabilizes microtubules and induces polarity in 80% of the cells (94), but this induced polarity is not efficient, and although cells show chemokinesis, they do not have the ability to chemotax in the direction of a gradient (95). In addition to these mechanisms, stabilized microtubules may contribute to the local environment through enhanced directional transport of molecules by dynein and kinesin (96). Without resolving the controversy, our model outlines the basic rules for analyzing experimental results and integrating microtubule activity in gradient-sensing models.
-
7.
Finally, it is intuitively straightforward that in addition to changing the morphology of the cells, protrusions change the location of the receptors in the chemical field surrounding the cells. The overall effect of protrusion formation and expansion is the displacement of the receptors by the advancing membrane and the conversion of heterogeneity of the chemotactic field in a temporal change of the chemoattractant concentration stimulating the receptors (97–100). This stimulation is markedly larger compared to the situation of a protrusion moving in a uniform field or that of stationary receptors, where stimulation and inhibition are maintained in a relative equilibrium. Decreasing receptor stimulation during the extension of a protrusion toward lower chemoattractant concentration quickly extinguishes local signaling by the persistence of the inhibitor (101).
Although our hypothesis regarding the role of microtubules in neutrophil polarization is supported by the adaptive-control model and by experimental evidence from a microfluidic system, the model has a number of limitations that remain to be addressed. The size and location of protrusions would not have to be specified explicitly if diffusion of the inhibitor and other molecules at the cell periphery was integrated into the model. The effect of diffusion has been previously studied mostly in the context of pattern generation in biological systems, where it has been shown to determine the relative size and periodicity of the patterns (for a review, see Meinhardt (102)). The inclusion of diffusion would allow us to remove the a priori restrictions on the lateral size and number of protrusions, which instead will arise dynamically during the sampling of the gradient by the cell. Future refinements of the model could take into account the redistribution of receptors on the surface of growing protrusions of different shapes. The nonlinear saturation curve for the receptors would have to be incorporated into the model, as would changes in receptor behavior due to clustering. Improving the quantitative predictions of the model would require precise identification of the molecules involved at different stages of signal transduction and quantitative measurements of their concentration, distribution, and temporal dynamics. As discussed, quantitative characterization of the dynamic instability of microtubules inside neutrophils would provide critical insight into their role in cell polarization. Although the model presented here is two-dimensional, which works well as a first approximation of cells crawling on flat surfaces, the model could be extended to three dimensions, a situation more relevant to neutrophils in tissue. Experiments in which slow and fast changes of chemoattractant gradients can be accurately quantified are necessary and would have implications for practical applications and choice of chemotaxis assays for particular conditions. In addition to the polarization index described in this article, new metrics for measuring cell polarity would have to be designed to allow comparisons between cell populations rather than between individual cells, and to provide meaningful statistics for large numbers of observations. Finally, our model, which is currently limited to the initial events of polarization and detecting the direction of a gradient, would have to be expanded to consider the stabilization of polarization and directional migration, leading-edge adhesion to the substrate, and leading-edge release and contraction (103).
In conclusion, we propose an adaptive-control model for neutrophil polarization that predicts high sensitivity to extracellular chemoattractant gradients, can reproduce stochastic polarization responses, and can adapt quickly after changes in extracellular conditions. Our model identifies microtubules as the major contributor to the integration of information from the cell periphery and short-term memory. The model also points toward the microtubules as a source of variability and stochasticity in polarization responses in otherwise similar cells that have identical levels of signaling molecules, which suggests that there are sources of variability in cell behavior other than those resulting from different expression signaling proteins. The predicted responses correlate with experimental observations during rapid switches in microfluidic systems. This combined experimental and analytical approach demonstrates the critical role of quantitative measurements and precise experimental control in opening up important questions regarding cellular function. The principles of global behavior emerging from local processes through the involvement of microtubules could be applied to other cell polarization processes in other migrating cells, e.g., in inflammation or cancer, or developed in the context of existing knowledge about the molecular interactions.
Acknowledgments
We thank anonymous reviewers for extensive suggestions for improving the strength of the model and quality of the text.
This work was partially supported by a National Institute of Biomedical Imaging and Bioengineering grant (BioMEMS Resource Center).
Appendix A
List of reactions implemented in the model, where i is the segment index.
#model “neutrophil_microtubules”;
PI=3.1415;
NSEG=12;
// number of segments on cell periphery TI=24;
// total number of microtubules in the cell C=1;
//average chemoattractant concentration S=0.1;
//spatial gradient slope k=10;
n=3;
// conversion factors between protrusion growth and segment displacement
//—————————————
// reaction rates aR=0.1;
// Rate of receptor activation iR=0.1;
// Rate of receptor inactivation aI=0.01;
// Rate of inhibitor formation iI=0.001;
// Rate of inhibitor destruction aM=0.01;
// Rate of mediator formation iM=0.1;
// Rate of mediator destruction aT=1;
// Rate of microtubule activation iT=0.1;
// Rate of microtubule collapse aP=0.0001;
// Rate of protrusion expansion iP=0.01;
// Rate of protrusion retraction
//—————————————-
// initial number of molecules loop(i, 1, NSEG)
{
“C[i]”=C(1+S∗(cos(2∗(i)∗PI/NSEG)));
//chemoattractant concentration at the periphery of the cell “RA[i]”=0;
“RI[i]”=20;
// Number of receptors per segment (activate and inactive) “IA[i]”=0;
“II[i]”=20;
// Number of inhibitors per segment (activate and inactive) “MA[i]”=0;
“MI[i]”=10;
// Number of mediators per segment (activate and inactive) “TA[i]”=0;
// Number of active microtubules per segment “PA[i]”=0;
// Size of protrusion “PPI[i]”=100;
// Maximum protrusion size “angle[i]” = cos(2∗(i)∗PI/NSEG);
// Conversion of mechanical activity into stimulation of receptors depends on the
// Angle between the protrusion and the direction of the gradient (see text for details)
}
//—————————-
loop(i, 1, NSEG)
{
“RI[i]”->“RA[i],” [aR∗“RI[i]”∗“C[i]”∗(1+“angle[i]”∗S∗k∗(“PA[i]”^(1/n)))];
“RA[i]”->“RI[i],” [iR∗“RA[i]”∗“IA[i]”];
// Receptors
// Volumetric growth of protrusion is converted into linear displacement
“II[i]”->“IA[i],” [aI∗“MA[i]”∗“II[i]”];
“IA[i]”->“II[i],” [iI∗“IA[i]”];
//Inhibitor
“MI[i]”->“MA[i],” [aM∗“MI[i]”∗“RA[i]”];
“MA[i]”->“MI[i],” [iM∗“MA[i]”];
//Mediators
TI->“TA[i],” [aT∗“MA[i]”∗TI];
“TA[i]”->TI, [iT∗“TA[i]”];
//Microtubules
“PPI[i]”->“PA[i],” [aP∗“PPI[i]”∗“TA[i]”∗“MA[i]”];
“PA[i]”->“PPI[i],” [iP∗“PA[i]”];
//Protrusions
}
Appendix B
#model “neutrophil_2loops_inhibition_switch”;
………….
//switch time swtch=500;
………….
“C1[i]”=C∗(1+S∗(cos(2∗(i)∗PI/NSEG)));
“C2[i]”=C∗(1+S∗(cos(2∗(i+NSEG/2)∗PI/NSEG)));
//chemoattractant concentration at the periphery of the cell
………….
“angle1[i]” = cos(2∗(i)∗PI/NSEG);
“angle2[i]” = cos(2∗(i+NSEG/2)∗PI/NSEG);
// Conversion of mechanical activity into stimulation of receptors depends on the
// angle between the protrusion and the direction of the gradient (see text for details)
………….
//Receptors
“RI[i]”->“RA[i],” [(1-theta(time-swtch)) ∗ (aR∗“RI[i]”∗“C1[i]”∗(1+“angle1[i]”∗S∗k∗(“PA[i]”^(1/n)))) + (theta(time-swtch)) ∗ (aR∗“RI[i]”∗“C2[i]”∗(1+“angle2[i]”∗S∗k∗(“PA[i]”^(1/n))))];
………….
References
- 1.Nathan C. Neutrophils and immunity: challenges and opportunities. Nat. Rev. Immunol. 2006;6:173–182. doi: 10.1038/nri1785. [DOI] [PubMed] [Google Scholar]
- 2.Zigmond S.H. Mechanisms of sensing chemical gradients by polymorphonuclear leukocytes. Nature. 1974;249:450–452. doi: 10.1038/249450a0. [DOI] [PubMed] [Google Scholar]
- 3.Wu D. Signaling mechanisms for regulation of chemotaxis. Cell Res. 2005;15:52–56. doi: 10.1038/sj.cr.7290265. [DOI] [PubMed] [Google Scholar]
- 4.Charest P.G., Firtel R.A. Feedback signaling controls leading-edge formation during chemotaxis. Curr. Opin. Genet. Dev. 2006;16:339–347. doi: 10.1016/j.gde.2006.06.016. [DOI] [PubMed] [Google Scholar]
- 5.Xu J., Wang F., Van Keymeulen A., Herzmark P., Straight A. Divergent signals and cytoskeletal assemblies regulate self-organizing polarity in neutrophils. Cell. 2003;114:201–214. doi: 10.1016/s0092-8674(03)00555-5. [DOI] [PubMed] [Google Scholar]
- 6.Turing A.M. The chemical basis of morphogenesis. Phil. Trans. Royal Soc. Lond. B. 1952;237:37–72. [Google Scholar]
- 7.Levchenko A., Iglesias P.A. Models of eukaryotic gradient sensing: application to chemotaxis of amoebae and neutrophils. Biophys. J. 2002;82:50–63. doi: 10.1016/S0006-3495(02)75373-3. [DOI] [PMC free article] [PubMed] [Google Scholar]
- 8.Levine H., Kessler D.A., Rappel W.J. Directional sensing in eukaryotic chemotaxis: a balanced inactivation model. Proc. Natl. Acad. Sci. USA. 2006;103:9761–9766. doi: 10.1073/pnas.0601302103. [DOI] [PMC free article] [PubMed] [Google Scholar]
- 9.Beta C., Amselem G., Bodenschatz E. A bistable mechanism for directional sensing. N. J. Phys. 2008;10:083015. [Google Scholar]
- 10.Mori Y., Jilkine A., Edelstein-Keshet L. Wave-pinning and cell polarity from a bistable reaction-diffusion system. Biophys. J. 2008;94:3684–3697. doi: 10.1529/biophysj.107.120824. [DOI] [PMC free article] [PubMed] [Google Scholar]
- 11.Dawes A.T., Edelstein-Keshet L. Phosphoinositides and rho proteins spatially regulate actin polymerization to initiate and maintain directed movement in a one-dimensional model of a motile cell. Biophys. J. 2007;92:744–768. doi: 10.1529/biophysj.106.090514. [DOI] [PMC free article] [PubMed] [Google Scholar]
- 12.Rappel W.J., Thomas P.J., Levine H., Loomis W.F. Establishing direction during chemotaxis in eukaryotic cells. Biophys. J. 2002;83:1361–1367. doi: 10.1016/S0006-3495(02)73906-4. [DOI] [PMC free article] [PubMed] [Google Scholar]
- 13.Brandman O., Ferrell J.E., Jr., Li R., Meyer T. Interlinked fast and slow positive feedback loops drive reliable cell decisions. Science. 2005;310:496–498. doi: 10.1126/science.1113834. [DOI] [PMC free article] [PubMed] [Google Scholar]
- 14.Gerisch G., Malchow D., Hess B. Cell communication and cyclic-AMP regulation during aggregation aggregating of the slime mold, Dictyostelium discoideum. In: Jaenicke L., editor. Biochemistry of Sensory Functions. Springer-Verlag; Berlin: 1974. pp. 279–294. [Google Scholar]
- 15.Alon U., Surette M.G., Barkai N., Leibler S. Robustness in bacterial chemotaxis. Nature. 1999;397:168–171. doi: 10.1038/16483. [DOI] [PubMed] [Google Scholar]
- 16.Samadani A., Mettetal J., van Oudenaarden A. Cellular asymmetry and individuality in directional sensing. Proc. Natl. Acad. Sci. USA. 2006;103:11549–11554. doi: 10.1073/pnas.0601909103. [DOI] [PMC free article] [PubMed] [Google Scholar]
- 17.Rappel W.J., Levine H. Receptor noise and directional sensing in eukaryotic chemotaxis. Phys. Rev. Lett. 2008;100:228101. doi: 10.1103/PhysRevLett.100.228101. [DOI] [PMC free article] [PubMed] [Google Scholar]
- 18.van Haastert P.J.M., Postma M. Biased random walk by stochastic fluctuations of chemoattractant-receptor interactions at the lower limit of detection. Biophys. J. 2007;93:1787–1796. doi: 10.1529/biophysj.107.104356. [DOI] [PMC free article] [PubMed] [Google Scholar]
- 19.Keenan T.M., Folch A. Biomolecular gradients in cell culture systems. Lab Chip. 2008;8:34–57. doi: 10.1039/b711887b. [DOI] [PMC free article] [PubMed] [Google Scholar]
- 20.Li Jeon N., Baskaran H., Dertinger S.K., Whitesides G.M., Van de Water L. Neutrophil chemotaxis in linear and complex gradients of interleukin-8 formed in a microfabricated device. Nat. Biotechnol. 2002;20:826–830. doi: 10.1038/nbt712. [DOI] [PubMed] [Google Scholar]
- 21.Huxley A.F. Excitation and conduction in nerve: quantitative analysis. Science. 1964;145:1154–1159. doi: 10.1126/science.145.3637.1154. [DOI] [PubMed] [Google Scholar]
- 22.Berg H.C., Tedesco P.M. Transient response to chemotactic stimuli in Escherichia coli. Proc. Natl. Acad. Sci. USA. 1975;72:3235–3239. doi: 10.1073/pnas.72.8.3235. [DOI] [PMC free article] [PubMed] [Google Scholar]
- 23.Klipp E., Nordlander B., Kruger R., Gennemark P., Hohmann S. Integrative model of the response of yeast to osmotic shock. Nat. Biotechnol. 2005;23:975–982. doi: 10.1038/nbt1114. [DOI] [PubMed] [Google Scholar]
- 24.Mettetal J.T., Muzzey D., Gomez-Uribe C., van Oudenaarden A. The frequency dependence of osmo-adaptation in Saccharomyces cerevisiae. Science. 2008;319:482–484. doi: 10.1126/science.1151582. [DOI] [PMC free article] [PubMed] [Google Scholar]
- 25.Irimia D., Liu S.Y., Tharp W.G., Samadani A., Toner M. Microfluidic system for measuring neutrophil migratory responses to fast switches of chemical gradients. Lab Chip. 2006;6:191–198. doi: 10.1039/b511877h. [DOI] [PMC free article] [PubMed] [Google Scholar]
- 26.Ramsey S., Orrell D., Bolouri H. Dizzy: stochastic simulation of large-scale genetic regulatory networks. J. Bioinform. Comput. Biol. 2005;3:415–436. doi: 10.1142/s0219720005001132. [DOI] [PubMed] [Google Scholar]
- 27.Gillespie D.T. Stochastic simulation of chemical kinetics. Annu. Rev. Phys. Chem. 2007;58:35–55. doi: 10.1146/annurev.physchem.58.032806.104637. [DOI] [PubMed] [Google Scholar]
- 28.Shannon C.E. A mathematical theory of communication. Bell Syst. Techn. J. 1948;27:379–423. [Google Scholar]
- 29.Balazsi G., Cornell-Bell A., Neiman A.B., Moss F. Synchronization of hyperexcitable systems with phase-repulsive coupling. Phys. Rev. E Stat. Nonlin. Soft Matter Phys. 2001;64:041912. doi: 10.1103/PhysRevE.64.041912. [DOI] [PubMed] [Google Scholar]
- 30.Mardia K.V., Jupp P.E. John Wiley & Sons; London: 1999. Directional Statistics. [Google Scholar]
- 31.Narendra K.S. The maturing of adaptive control. In: Kokotovic P.V., editor. Springer-Verlag; Berlin: 1991. [Google Scholar]
- 32.Acar M., Becskei A., van Oudenaarden A. Enhancement of cellular memory by reducing stochastic transitions. Nature. 2005;435:228–232. doi: 10.1038/nature03524. [DOI] [PubMed] [Google Scholar]
- 33.Beta C., Wyatt D., Rappel W.J., Bodenschatz E. Flow photolysis for spatiotemporal stimulation of single cells. Anal. Chem. 2007;79:3940–3944. doi: 10.1021/ac070033y. [DOI] [PubMed] [Google Scholar]
- 34.Moghe P.V., Tranquillo R.T. Stochasticity in membrane-localized “ligand-receptor-G protein” binding: consequences for leukocyte movement behavior. Ann. Biomed. Eng. 1995;23:257–267. doi: 10.1007/BF02584427. [DOI] [PubMed] [Google Scholar]
- 35.Zigmond S.H. Ability of polymorphonuclear leukocytes to orient in gradients of chemotactic factors. J. Cell Biol. 1977;75:606–616. doi: 10.1083/jcb.75.2.606. [DOI] [PMC free article] [PubMed] [Google Scholar]
- 36.Herzmark P., Campbell K., Wang F., Wong K., El-Samad H. Bound attractant at the leading vs. the trailing edge determines chemotactic prowess. Proc. Natl. Acad. Sci. USA. 2007;104:13349–13354. doi: 10.1073/pnas.0705889104. [DOI] [PMC free article] [PubMed] [Google Scholar]
- 37.Insall R., Andrew N. Chemotaxis in Dictyostelium: how to walk straight using parallel pathways. Curr. Opin. Microbiol. 2007;10:578–581. doi: 10.1016/j.mib.2007.10.004. [DOI] [PubMed] [Google Scholar]
- 38.Song L., Nadkarni S.M., Bodeker H.U., Beta C., Bae A. Dictyostelium discoideum chemotaxis: threshold for directed motion. Eur. J. Cell Biol. 2006;85:981–989. doi: 10.1016/j.ejcb.2006.01.012. [DOI] [PubMed] [Google Scholar]
- 39.Golding I., Paulsson J., Zawilski S.M., Cox E.C. Real-time kinetics of gene activity in individual bacteria. Cell. 2005;123:1025–1036. doi: 10.1016/j.cell.2005.09.031. [DOI] [PubMed] [Google Scholar]
- 40.Raj A., Peskin C.S., Tranchina D., Vargas D.Y., Tyagi S. Stochastic mRNA synthesis in mammalian cells. PLoS Biol. 2006;4:e309. doi: 10.1371/journal.pbio.0040309. [DOI] [PMC free article] [PubMed] [Google Scholar]
- 41.Blake W.J., Balazsi G., Kohanski M.A., Isaacs F.J., Murphy K.F. Phenotypic consequences of promoter-mediated transcriptional noise. Mol. Cell. 2006;24:853–865. doi: 10.1016/j.molcel.2006.11.003. [DOI] [PubMed] [Google Scholar]
- 42.Blake W.J., Kærn M., Cantor C.R., Collins J.J. Noise in eukaryotic gene expression. Nature. 2003;422:633–637. doi: 10.1038/nature01546. [DOI] [PubMed] [Google Scholar]
- 43.Raser J.M., O'Shea E.K. Control of stochasticity in eukaryotic gene expression. Science. 2004;304:1811–1814. doi: 10.1126/science.1098641. [DOI] [PMC free article] [PubMed] [Google Scholar]
- 44.Levsky J.M., Shenoy S.M., Pezo R.C., Singer R.H. Single-cell gene expression profiling. Science. 2002;297:836–840. doi: 10.1126/science.1072241. [DOI] [PubMed] [Google Scholar]
- 45.Cai L., Friedman N., Xie X.S. Stochastic protein expression in individual cells at the single molecule level. Nature. 2006;440:358–362. doi: 10.1038/nature04599. [DOI] [PubMed] [Google Scholar]
- 46.Kirschner M., Mitchison T. Beyond self-assembly: from microtubules to morphogenesis. Cell. 1986;45:329–342. doi: 10.1016/0092-8674(86)90318-1. [DOI] [PubMed] [Google Scholar]
- 47.Nath J., Flavin M., Gallin J.I. Tubulin tyrosinolation in human polymorphonuclear leukocytes: studies in normal subjects and in patients with the Chediak-Higashi syndrome. J. Cell Biol. 1982;95:519–526. doi: 10.1083/jcb.95.2.519. [DOI] [PMC free article] [PubMed] [Google Scholar]
- 48.Niggli V. Signaling to migration in neutrophils: importance of localized pathways. Int. J. Biochem. Cell Biol. 2003;35:1619–1638. doi: 10.1016/s1357-2725(03)00144-4. [DOI] [PubMed] [Google Scholar]
- 49.Mikhailov A., Gundersen G.G. Relationship between microtubule dynamics and lamellipodium formation revealed by direct imaging of microtubules in cells treated with nocodazole or taxol. Cell Motil. Cytoskeleton. 1998;41:325–340. doi: 10.1002/(SICI)1097-0169(1998)41:4<325::AID-CM5>3.0.CO;2-D. [DOI] [PubMed] [Google Scholar]
- 50.Euteneuer U., Schliwa M. Mechanism of centrosome positioning during the wound response in BSC-1 cells. J. Cell Biol. 1992;116:1157–1166. doi: 10.1083/jcb.116.5.1157. [DOI] [PMC free article] [PubMed] [Google Scholar]
- 51.Ueda M., Graf R., MacWilliams H.K., Schliwa M., Euteneuer U. Centrosome positioning and directionality of cell movements. Proc. Natl. Acad. Sci. USA. 1997;94:9674–9678. doi: 10.1073/pnas.94.18.9674. [DOI] [PMC free article] [PubMed] [Google Scholar]
- 52.de Anda F.C., Pollarolo G., Da Silva J.S., Camoletto P.G., Feiguin F. Centrosome localization determines neuronal polarity. Nature. 2005;436:704–708. doi: 10.1038/nature03811. [DOI] [PubMed] [Google Scholar]
- 53.Servant G., Weiner O.D., Neptune E.R., Sedat J.W., Bourne H.R. Dynamics of a chemoattractant receptor in living neutrophils during chemotaxis. Mol. Biol. Cell. 1999;10:1163–1178. doi: 10.1091/mbc.10.4.1163. [DOI] [PMC free article] [PubMed] [Google Scholar]
- 54.Chuntharapai A., Kim K.J. Regulation of the expression of IL-8 receptor A/B by IL-8: possible functions of each receptor. J. Immunol. 1995;155:2587–2594. [PubMed] [Google Scholar]
- 55.Samanta A.K., Oppenheim J.J., Matsushima K. Identification and characterization of specific receptors for monocyte-derived neutrophil chemotactic factor (MDNCF) on human neutrophils. J. Exp. Med. 1989;169:1185–1189. doi: 10.1084/jem.169.3.1185. [DOI] [PMC free article] [PubMed] [Google Scholar]
- 56.Samanta A.K., Oppenheim J.J., Matsushima K. Interleukin 8 (monocyte-derived neutrophil chemotactic factor) dynamically regulates its own receptor expression on human neutrophils. J. Biol. Chem. 1990;265:183–189. [PubMed] [Google Scholar]
- 57.Arrieumerlou C., Meyer T. A local coupling model and compass parameter for eukaryotic chemotaxis. Dev. Cell. 2005;8:215–227. doi: 10.1016/j.devcel.2004.12.007. [DOI] [PubMed] [Google Scholar]
- 58.Postma M., Roelofs J., Goedhart J., Gadella T.W., Visser A.J. Uniform cAMP stimulation of Dictyostelium cells induces localized patches of signal transduction and pseudopodia. Mol. Biol. Cell. 2003;14:5019–5027. doi: 10.1091/mbc.E03-08-0566. [DOI] [PMC free article] [PubMed] [Google Scholar]
- 59.Gardiner E.M., Pestonjamasp K.N., Bohl B.P., Chamberlain C., Hahn K.M. Spatial and temporal analysis of Rac activation during live neutrophil chemotaxis. Curr. Biol. 2002;12:2029–2034. doi: 10.1016/s0960-9822(02)01334-9. [DOI] [PubMed] [Google Scholar]
- 60.Zhelev D.V., Alteraifi A.M., Chodniewicz D. Controlled pseudopod extension of human neutrophils stimulated with different chemoattractants. Biophys. J. 2004;87:688–695. doi: 10.1529/biophysj.103.036699. [DOI] [PMC free article] [PubMed] [Google Scholar]
- 61.Xu J., Van Keymeulen A., Wakida N.M., Carlton P., Berns M.W. Polarity reveals intrinsic cell chirality. Proc. Natl. Acad. Sci. USA. 2007;104:9296–9300. doi: 10.1073/pnas.0703153104. [DOI] [PMC free article] [PubMed] [Google Scholar]
- 62.Insall R.H., Weiner O.D. PIP3, PIP2, and cell movement–similar messages, different meanings? Dev. Cell. 2001;1:743–747. doi: 10.1016/s1534-5807(01)00086-7. [DOI] [PMC free article] [PubMed] [Google Scholar]
- 63.Nishita M., Tomizawa C., Yamamoto M., Horita Y., Ohashi K. Spatial and temporal regulation of cofilin activity by LIM kinase and slingshot is critical for directional cell migration. J. Cell Biol. 2005;171:349–359. doi: 10.1083/jcb.200504029. [DOI] [PMC free article] [PubMed] [Google Scholar]
- 64.Mouneimne G., DesMarais V., Sidani M., Scemes E., Wang W. Spatial and temporal control of cofilin activity is required for directional sensing during chemotaxis. Curr. Biol. 2006;16:2193–2205. doi: 10.1016/j.cub.2006.09.016. [DOI] [PubMed] [Google Scholar]
- 65.Hirayama A., Adachi R., Otani S., Kasahara T., Suzuki K. Cofilin plays a critical role in IL-8-dependent chemotaxis of neutrophilic HL-60 cells through changes in phosphorylation. J. Leukoc. Biol. 2007;81:720–728. doi: 10.1189/jlb.0506314. [DOI] [PubMed] [Google Scholar]
- 66.Cassimeris L.U., Wadsworth P., Salmon E.D. Dynamics of microtubule depolymerization in monocytes. J. Cell Biol. 1986;102:2023–2032. doi: 10.1083/jcb.102.6.2023. [DOI] [PMC free article] [PubMed] [Google Scholar]
- 67.Eddy R.J., Pierini L.M., Maxfield F.R. Microtubule asymmetry during neutrophil polarization and migration. Mol. Biol. Cell. 2002;13:4470–4483. doi: 10.1091/mbc.E02-04-0241. [DOI] [PMC free article] [PubMed] [Google Scholar]
- 68.Rich A.M., Hoffstein S.T. Inverse correlation between neutrophil microtubule numbers and enhanced random migration. J. Cell Sci. 1981;48:181–191. doi: 10.1242/jcs.48.1.181. [DOI] [PubMed] [Google Scholar]
- 69.Desai A., Mitchison T.J. Microtubule polymerization dynamics. Annu. Rev. Cell Dev. Biol. 1997;13:83–117. doi: 10.1146/annurev.cellbio.13.1.83. [DOI] [PubMed] [Google Scholar]
- 70.Gundersen G.G., Gomes E.R., Wen Y. Cortical control of microtubule stability and polarization. Curr. Opin. Cell Biol. 2004;16:106–112. doi: 10.1016/j.ceb.2003.11.010. [DOI] [PubMed] [Google Scholar]
- 71.Watanabe T., Noritake J., Kaibuchi K. Regulation of microtubules in cell migration. Trends Cell Biol. 2005;15:76–83. doi: 10.1016/j.tcb.2004.12.006. [DOI] [PubMed] [Google Scholar]
- 72.Wadsworth P., Bottaro D.P. Microtubule dynamic turnover is suppressed during polarization and stimulated in hepatocyte growth factor scattered Madin-Darby canine kidney epithelial cells. Cell Motil. Cytoskeleton. 1996;35:225–236. doi: 10.1002/(SICI)1097-0169(1996)35:3<225::AID-CM5>3.0.CO;2-7. [DOI] [PubMed] [Google Scholar]
- 73.Witte H., Neukirchen D., Bradke F. Microtubule stabilization specifies initial neuronal polarization. J. Cell Biol. 2008;180:619–632. doi: 10.1083/jcb.200707042. [DOI] [PMC free article] [PubMed] [Google Scholar]
- 74.Varnum-Finney B., Edwards K.B., Voss E., Soll D.R. Amebae of Dictyostelium discoideum respond to an increasing temporal gradient of the chemoattractant cAMP with a reduced frequency of turning: evidence for a temporal mechanism in ameboid chemotaxis. Cell Motil. Cytoskeleton. 1987;8:7–17. doi: 10.1002/cm.970080103. [DOI] [PubMed] [Google Scholar]
- 75.Ridley A.J., Schwartz M.A., Burridge K., Firtel R.A., Ginsberg M.H. Cell migration: integrating signals from front to back. Science. 2003;302:1704–1709. doi: 10.1126/science.1092053. [DOI] [PubMed] [Google Scholar]
- 76.Etienne-Manneville S., Hall A. Rho GTPases in cell biology. Nature. 2002;420:629–635. doi: 10.1038/nature01148. [DOI] [PubMed] [Google Scholar]
- 77.Gundersen G.G., Cook T.A. Microtubules and signal transduction. Curr. Opin. Cell Biol. 1999;11:81–94. doi: 10.1016/s0955-0674(99)80010-6. [DOI] [PubMed] [Google Scholar]
- 78.Gundersen G.G. Microtubule capture: IQGAP and CLIP-170 expand the repertoire. Curr. Biol. 2002;12:R645–R647. doi: 10.1016/s0960-9822(02)01156-9. [DOI] [PubMed] [Google Scholar]
- 79.Perez F., Diamantopoulos G.S., Stalder R., Kreis T.E. CLIP-170 highlights growing microtubule ends in vivo. Cell. 1999;96:517–527. doi: 10.1016/s0092-8674(00)80656-x. [DOI] [PubMed] [Google Scholar]
- 80.Drabek K., van Ham M., Stepanova T., Draegestein K., van Horssen R. Role of CLASP2 in microtubule stabilization and the regulation of persistent motility. Curr. Biol. 2006;16:2259–2264. doi: 10.1016/j.cub.2006.09.065. [DOI] [PubMed] [Google Scholar]
- 81.Palazzo A.F., Cook T.A., Alberts A.S., Gundersen G.G. mDia mediates Rho-regulated formation and orientation of stable microtubules. Nat. Cell Biol. 2001;3:723–729. doi: 10.1038/35087035. [DOI] [PubMed] [Google Scholar]
- 82.Larsson N., Marklund U., Gradin H.M., Brattsand G., Gullberg M. Control of microtubule dynamics by oncoprotein 18: dissection of the regulatory role of multisite phosphorylation during mitosis. Mol. Cell. Biol. 1997;17:5530–5539. doi: 10.1128/mcb.17.9.5530. [DOI] [PMC free article] [PubMed] [Google Scholar]
- 83.Andersen S.S. Spindle assembly and the art of regulating microtubule dynamics by MAPs and Stathmin/Op18. Trends Cell Biol. 2000;10:261–267. doi: 10.1016/s0962-8924(00)01786-4. [DOI] [PubMed] [Google Scholar]
- 84.Wittmann T., Bokoch G.M., Waterman-Storer C.M. Regulation of microtubule destabilizing activity of Op18/stathmin downstream of Rac1. J. Biol. Chem. 2004;279:6196–6203. doi: 10.1074/jbc.M307261200. [DOI] [PubMed] [Google Scholar]
- 85.Palazzo A.F., Eng C.H., Schlaepfer D.D., Marcantonio E.E., Gundersen G.G. Localized stabilization of microtubules by integrin- and FAK-facilitated Rho signaling. Science. 2004;303:836–839. doi: 10.1126/science.1091325. [DOI] [PubMed] [Google Scholar]
- 86.Witze E.S., Litman E.S., Argast G.M., Moon R.T., Ahn N.G. Wnt5a control of cell polarity and directional movement by polarized redistribution of adhesion receptors. Science. 2008;320:365–369. doi: 10.1126/science.1151250. [DOI] [PMC free article] [PubMed] [Google Scholar]
- 87.Wittmann T., Waterman-Storer C.M. Cell motility: can Rho GTPases and microtubules point the way? J. Cell Sci. 2001;114:3795–3803. doi: 10.1242/jcs.114.21.3795. [DOI] [PubMed] [Google Scholar]
- 88.Ueda M., Ogihara S. Microtubules are required in amoeba chemotaxis for preferential stabilization of appropriate pseudopods. J. Cell Sci. 1994;107:2071–2079. doi: 10.1242/jcs.107.8.2071. [DOI] [PubMed] [Google Scholar]
- 89.Keller H.U., Naef A., Zimmermann A. Effects of colchicine, vinblastine and nocodazole on polarity, motility, chemotaxis and cAMP levels of human polymorphonuclear leukocytes. Exp. Cell Res. 1984;153:173–185. doi: 10.1016/0014-4827(84)90459-2. [DOI] [PubMed] [Google Scholar]
- 90.Malikov V., Cytrynbaum E.N., Kashina A., Mogilner A., Rodionov V. Centering of a radial microtubule array by translocation along microtubules spontaneously nucleated in the cytoplasm. Nat. Cell Biol. 2005;7:1213–1218. doi: 10.1038/ncb1332. [DOI] [PubMed] [Google Scholar]
- 91.Vallee R.B., Stehman S.A. How dynein helps the cell find its center: a servomechanical model. Trends Cell Biol. 2005;15:288–294. doi: 10.1016/j.tcb.2005.04.005. [DOI] [PubMed] [Google Scholar]
- 92.Tang L., Franca-Koh J., Xiong Y., Chen M.Y., Long Y. tsunami, the Dictyostelium homolog of the Fused kinase, is required for polarization and chemotaxis. Genes Dev. 2008;22:2278–2290. doi: 10.1101/gad.1694508. [DOI] [PMC free article] [PubMed] [Google Scholar]
- 93.Krendel M., Zenke F.T., Bokoch G.M. Nucleotide exchange factor GEF-H1 mediates cross-talk between microtubules and the actin cytoskeleton. Nat. Cell Biol. 2002;4:294–301. doi: 10.1038/ncb773. [DOI] [PubMed] [Google Scholar]
- 94.Niggli V., Djafarzadeh S., Keller H. Stimulus-induced selective association of actin-associated proteins (α-actinin) and protein kinase C isoforms with the cytoskeleton of human neutrophils. Exp. Cell Res. 1999;250:558–568. doi: 10.1006/excr.1999.4548. [DOI] [PubMed] [Google Scholar]
- 95.Xu J., Wang F., Van Keymeulen A., Rentel M., Bourne H.R. Neutrophil microtubules suppress polarity and enhance directional migration. Proc. Natl. Acad. Sci. USA. 2005;102:6884–6889. doi: 10.1073/pnas.0502106102. [DOI] [PMC free article] [PubMed] [Google Scholar]
- 96.Mallik R., Gross S.P. Molecular motors: strategies to get along. Curr. Biol. 2004;14:R971–R982. doi: 10.1016/j.cub.2004.10.046. [DOI] [PubMed] [Google Scholar]
- 97.Gerisch G., Hulser D., Malchow D., Wick U. Cell communication by periodic cyclic-AMP pulses. Philos. Trans. R. Soc. Lond. B Biol. Sci. 1975;272:181–192. doi: 10.1098/rstb.1975.0080. [DOI] [PubMed] [Google Scholar]
- 98.Varnum-Finney B.J., Voss E., Soll D.R. Frequency and orientation of pseudopod formation of Dictyostelium discoideum amebae chemotaxing in a spatial gradient: further evidence for a temporal mechanism. Cell Motil. Cytoskeleton. 1987;8:18–26. doi: 10.1002/cm.970080104. [DOI] [PubMed] [Google Scholar]
- 99.Vasiliev J.M. Polarization of pseudopodial activities: cytoskeletal mechanisms. J. Cell Sci. 1991;98:1–4. doi: 10.1242/jcs.98.1.1. [DOI] [PubMed] [Google Scholar]
- 100.Onsum M.D., Wong K., Herzmark P., Bourne H.R., Arkin A.P. Morphology matters in immune cell chemotaxis: membrane asymmetry affects amplification. Phys. Biol. 2006;3:190–199. doi: 10.1088/1478-3975/3/3/004. [DOI] [PubMed] [Google Scholar]
- 101.Chodniewicz D., Klemke R.L. Guiding cell migration through directed extension and stabilization of pseudopodia. Exp. Cell Res. 2004;301:31–37. doi: 10.1016/j.yexcr.2004.08.006. [DOI] [PubMed] [Google Scholar]
- 102.Meinhardt H. Models of biological pattern formation: from elementary steps to the organization of embryonic axes. Curr. Top. Dev. Biol. 2008;81:1–63. doi: 10.1016/S0070-2153(07)81001-5. [DOI] [PubMed] [Google Scholar]
- 103.Friedl P., Brocker E.B. The biology of cell locomotion within three-dimensional extracellular matrix. Cell. Mol. Life Sci. 2000;57:41–64. doi: 10.1007/s000180050498. [DOI] [PMC free article] [PubMed] [Google Scholar]