

Abstract
The association reaction between pairs of proteins proceeds through an encounter complex that develops into the final complex. Here, we combined Brownian dynamics simulations with experimental studies to analyze the structures of the encounter complexes along the association reaction between TEM1-β-lactamase and its inhibitor, β-lactamase-inhibitor protein. The encounter complex can be considered as an ensemble of short-lived low free-energy states that are stabilized primarily by electrostatic forces and desolvation. For the wild-type, the simulation showed two main encounter regions located outside the physical binding site. One of these regions was located near the experimentally determined transition state. To validate whether these encounters are fruitful or futile, we examined three groups of mutations that altered the encounter. The first group consisted of mutations that increased the experimental rate of association through electrostatic optimization. This resulted in an increase in the size of the encounter region located near the experimentally determined transition state, as well as a decrease in the energy of this region and an increase in the number of successful trajectories (i.e., encounters that develop into complex). A second group of mutations was specifically designed to either increase or decrease the size and energy of the second encounter complex, but either way it did not affect kon. A third group of mutations consisted of residues that increased kon without significantly affecting the encounter complexes. These results indicate that the size and energy of the encounter regions are only two of several parameters that lead to fruitful association, and that electrostatic optimization is a major driving force in fast association.
Introduction
The question of how proteins associate quickly and specifically is of great interest. The first step along the association reaction is a random collision between the proteins, a process that is solely dictated by diffusion. In a small fraction of cases, the collision leads to the formation of an encounter complex, which may further develop into the final complex (1–3). The encounter complex can be considered as an ensemble of configurations. These configurations are an ensemble of low free-energy states that are stabilized mainly by electrostatic forces and desolvation, and destabilized by unfavorable entropy. Short-range specific interactions are less important at this stage, as their magnitude over larger distances is minute, and they mainly stabilize the final complex (4–9). The encounter complex is an assemble of states with lower energy compared to other species during the association reaction (excluding the final complex). This allows the proteins a longer time for local diffusion, which is required for proper alignment and structural reorganization, during the formation of the complex. The encounter complex is restricted to specific regions and thus can be distinguished from a diffusive entrapment effect. This effect results from geometric constraints and is not specific to certain surfaces, as it is due to considerable rotational reorientation of the proteins while they are trapped in the vicinity of each other and undergoing multiple collisions (10). Still, it is important to note that reaching the encounter complex does not ensure binding. On the contrary, in most cases the encounter complex is futile and does not lead to association (2,9,11,12). Experimental studies of the binding kinetics (2,12), as well as paramagnetic relaxation enhancement (PRE) NMR studies (13–18), confirmed the existence of the encounter complex for protein-protein association. Computer simulations broadened the concept of the encounter complex and enabled its detailed characterization (6,19,20). A frequently used computational tool for this purpose is Brownian dynamics (BD) simulation.
BD is based on the Brownian motion theory, which describes the dynamic behavior of particles immersed in a solution. These particles are subjected to stochastic collisions with the solvent molecules (which are smaller in both size and mass) and to the viscous drag effects of the water molecules. This leads to the seemingly random motion of the particles, or Brownian motion. When applying equations that describe the motility of the particles in BD simulations, one can describe their movements (21,22). The classical use of BD is for kon calculations, which are generally in a good agreement with the experimental rates (23,24). More recent developments include the use of BD for protein-protein docking (25), protein adsorption to a solid surface, ion channel permeation studies, and enzyme design (22). Spaar and colleagues (26,27) used the trajectories generated during BD simulations to analyze the free-energy landscape of the encounter complex. This was done by modeling the occupancy map. Because the number of the trajectories was very high, they were able to interpret the occupancy maps using probability distribution, from which the entropy landscape was calculated. Additionally, the electrostatic and the charge desolvation energies were documented throughout the simulations. These are important parameters along the association reaction and for dictating the stability of the encounter complex (2,5,6,8,28–32). Finally, they obtained the free-energy landscape by summing the energy and entropy contributions as follows (26):
| (1) |
where ΔG is the free energy, ΔEel is the electrostatic interaction energy, ΔEds is the charge desolvation energy, T is the temperature, and ΔS is the entropy. From the free-energy landscape one can compute the encounter complex region (the minimum in the free-energy landscape) and the optimal association pathways.
With the use of these tools, two encounter complex regions were mapped along the association reaction of barnase and barstar: one adjacent to the interface and the other next to the RNA-binding loop (26,27). Analysis of the effect of the mutations on the encounter complex showed that a single mutation could considerably alter the free-energy landscape and change the population of the two minima (i.e., the two regions of the encounter complex). As expected for a charged protein-pair like barnase-barstar, the free-energy landscape was also affected by ionic strength (33).
Here, we applied the same approach detailed above on the interaction between TEM1-β-lactamase (TEM1) and its inhibitor, β-lactamase-inhibitor protein (BLIP), and validated the results. Both the unbound and bound structures of this complex were experimentally determined (34). Electrostatic steering has only a marginal role in this association reaction (35), resulting in an association rate of 2.6 × 10⁵ M−1s−1, a dissociation rate of 2 × 10⁻⁴ s−1, and affinity in the nanomol range. Faster-binding TEM1-BLIP mutants were designed using the software PARE (Protein Association Rate Enhancement), with kon being increased by over 2 orders of magnitude (11). Mapping the transition state of association of TEM1-BLIP using double-mutant cycles has shown it to be diffuse for wild-type (WT) proteins but specific for electrostatically optimized mutants (31). A diffuse transition state was also found for the interferon-receptor interaction, whereas barnase-barstar had a specific transition state (31).
In this study, we determine the free-energy landscape of the encounter complex using BD simulations and compare it with experimental results. Furthermore, we distinguish between fruitful and futile encounters and show that mutants that act on the encounter region near the binding site influence the association rate, whereas modifying the encounter region far away from the interface does not. This indicates that it is not the size or energy of the encounter regions that is important in determining the reaction rate, but rather whether the encounters can lead to fruitful association.
Materials and Methods
PDB structures
The coordinates of the structure of the TEM1-BLIP complex are from PDB code 1JTG (34). The mutant structures (TEM1 mutant WK and BLIP mutants D163K, BLIP+4, BLIP+6, K8A, K8E, and D23R,E28R) were created using Swiss-PDB-Viewer (36). Modeling with Rossetta (37) gave similar results (average root mean-square deviation of 0.32 Å between the models).
Pretreatment of the proteins for BD calculations
For the electrostatic potential calculations, the PDB files were converted to PQR files (where the occupancy and B-factor columns were replaced by per-atom charge and radius) using PDB2PQR (38). Hydrogen atoms were added and their position was optimized by energy minimization using CHARMM. Partial charges and atomic radii were assigned using CHARMM at pH 7.2. Solutions of the nonlinear Poisson-Boltzmann equation were computed for each protein using the Adaptive Poisson-Boltzmann Solver (APBS) (39). A grid with dimensions of 129 × 129 × 129 nodes and 1.0 Å spacing, centered on each examined protein, was used. The dielectric constant was set to 78.0 and 2.0 for the solvent and proteins, respectively. The temperature was set to 298.15° K. For each protein the electrostatic potential was calculated at ionic strength of (5, 150, and 300 mM). The APBS grids were converted to UHBD format using apbs2uhbd code that was kindly provided by R. R. Gabdoulline and R. C. Wade.
Since it is not feasible to calculate the electrostatic potential for every time step in the simulations, the effective-charges method (40) was used. The effective charges were fitted to reproduce the electrostatic potential in a 3 Å thick layer starting at the accessible surface defined by a probe with radius of 4 Å and extending outward from the protein.
Short-range repulsive forces were treated using an exclusion volume. The exclusion volume was precomputed on a grid with dimensions of 110 × 110 × 110 nodes and 1.0 Å spacing. Each move that ended in VDW overlap was repeated until no overlap occurred.
The charge desolvation penalties were computed for each protein as the sum of the desolvation penalties of each charge of that protein. For every charge, the desolvation penalty was the sum of the penalties due to the lower dielectric cavity of each atom of the other protein (26).
BD simulations
A modified version (26,27) of the SDA package (23,41) was used for the BD simulations and analysis. During the simulations, the translational and rotational motion was simulated for one of the proteins (protein II) relative to the position of the other (protein I). To obtain fine statistics for the occupancy maps, 200,000 trajectories were simulated for each protein pair (unless mentioned otherwise). In SDA, every trajectory begins with the two proteins at center-to-center distance b, and stops when the protein reaches a center-to center distance c (which is larger than b). Here, b was set to 100 Å and c to 500 Å. The temperature was set to 300° K. The reaction criterion defines the encounter event (successful encounter of the two proteins). Here we consider a successful complex to be formed when two independent contacts come within 5.5 Å (the contacts should be between interface residues predefined by SDA). This was done individually for the WT and for each of the mutants. The diffusion coefficients were set to 0.027 Å2/ps and 3.92 × 10⁻⁵ rad2/ps for the relative translational coefficient and the rotational coefficient (of each protein), respectively. The time step was set to 1.0 ps for center-to-center distances up to 50 Å, and for larger distances it increased linearly.
The current version of SDA (and its modifications) treats the proteins as rigid bodies and does not take into account short-range interactions (van der Waals and hydrogen bonds) or hydrophobic forces. However, these interactions become important for short distances, which are not in the encounter complex regime. Furthermore, hydrodynamic interactions (42–44) are not considered here. It was previously shown that these interactions have only a minor influence on association rate predictions.
Computation of the energy landscape from the BD simulations
A detailed description of the modified SDA package is given in the recent studies of Spaar et al. (26,27). In short, two modified SDA programs were applied (sda_traj and sda_grid). With the use of these programs, the position and orientation of protein II (relative to protein I) were calculated for every time step with respect to the reaction coordinate. The reaction coordinate was d1-2, the center-to-center distance (the center of TEM1 and the center of BLIP). Since every position and orientation coordinate of protein II was recorded, we were able to construct an occupancy map of protein II during the whole simulation. From the occupancy landscape we calculated the entropy. Since a protein at a certain position and with a certain orientation cannot explore the full configurational space within a BD time step, we investigated the local entropy loss (the position- and orientation-dependent entropy loss) rather than the global (total) entropy loss during the association process. Thus, the occupancy values of all configurations that were reachable from the particular position and orientation (i.e., that were within its accessible volume) were taken into account. We calculated the contribution of the translational and rotational entropies to the free-energy landscape by interpreting the occupancy maps as probability distributions, for which the basic entropy formula, S = kB Σ PnlnPn (where Pn are the probabilities for each state, n), was implemented. The total entropy loss is the sum of the translational and rotational entropies (ΔStotal = ΔStrans + ΔSrot). This configuration-dependent entropy was compared with the reference state (i.e., the entropy with a constant isotropic probability distribution) when the proteins were far apart. The entropy loss was calculated independently for every grid node, which collectively represented the entropy landscape.
The contributions of the electrostatic and desolvation energies were calculated for every BD step as well, and were stored either on matrices (sda_traj program) or UHBD grids (sda_grid program) that represent the six-dimensional configuration space. All of the grids and matrices had the same dimensions. The free-energy landscape of the encounter process was then given by the sum of the electrostatic energy, the desolvation energy, and the entropy (Eq. 1).
Note that the maps of the positional and orientational coordinates were computed separately to reduce the computational time. Furthermore, the internal entropy was not taken into account since the proteins were simulated as rigid bodies. Yet, the internal entropy becomes significant only for short distances between the proteins, where diffusion does not take part. Additionally, the entropy of the solution is ignored here, but it can be assumed that this entropy has a limited contribution.
The association rate was predicted by averaging four different simulations of 50,000 trajectories each, with a different random number generator seed (which defines the sequence of random numbers used to model the BD simulation).
Protein expression and purification
The TEM1 and BLIP proteins were mutated, expressed, and purified as previously described (35).
Kinetic measurements
The association rate constants (kon) were determined using a fluorescence stopped flow apparatus from Applied Photophysics (Leatherhead, UK). The measurements were done at 25°C with a slit width of 1.5 nm. The excitation wavelength was 280 nm. The emission was detected using a cutoff filter of 320 nm. Every reaction was repeated at least six times, and the average signal was considered as the representative signal for the reaction. The association rate constants were measured in 10 mM Hepes buffer pH 7.2 under pseudo-first-order rate conditions, where one of the proteins was at a concentration excess of at least fivefold compared to the second. The twofold differences in some of the data with respect to previous studies may relate to differences in the buffer used. The data were fitted using a single exponent equation to determine the kobs:
| (2) |
where [B]t is the concentration of the complex at time t, and [B]∞ is the final concentration of the complex. The kobs values were then plotted as a function of the excess protein concentration. The slope of the linear fit represents the association rate constant kon (M−1s−1).
Electrostatic energy calculation
The electrostatic energy calculation involved the use of experimental data and was done to evaluate the electrostatic contribution to association. The rate of association, kon, is the sum of two factors (2): 1), the basal rate, ln kon0, which is independent of electrostatics and is fixed for a given complex; and 2), the contribution of the electrostatic energy of interaction. This factor is a function of both the Columbic energy of interaction, −ΔU, and the ionic strength (represented here by 1/(1 + κa), with κ being the inverse Debye length). This relation is reflected in the following equation (4,45):
| (3) |
where T is the temperature, R is the gas constant, and a is the minimal distance of approach between the molecules. In this case, a was set to 6 Å (45). When 1/(1 + κa) = 1, there is no salt and the electrostatic forces are maximized. When 1/(1 + κa) = 0, the salt concentration is infinite and the electrostatic forces are shielded. The slope of the plot derived from Eq. 3 is equal to −ΔU/RT.
Results
BD simulations of TEM1-BLIP WT
The association pathway of two interacting proteins can be simulated using BD. Here we used BD to characterize the encounter complexes along the association of the TEM1-BLIP complex. For this purpose, the free-energy landscape was calculated as the sum of the electrostatic and desolvation energies, as well as the entropy contribution (Eq. 1). The encounter complex regions for WT TEM1-BLIP as mapped using 0.15 M salt are shown in Fig. 1 A. BLIP was the static partner (represented as a solid surface), and the center-of-mass positions of TEM1 are represented as yellow clouds (with a free energy of < −2.0 kcal/mol being colored in transparent yellow, and ΔG < −3.0 kcal/mol in solid yellow). The ribbon of TEM1 represents the orientation of the final complex. For simplicity, TEM1 and BLIP are at the same orientation in all of the figures in this work, except for Figs. 3, B and C, and 6. The simulation defined two energetically favorable encounter regions, neither of which was located at the interface. The encounter region on the right of the binding site was closer to the interface, yet the whole region was less energetically favorable compared to the one on the left (see ΔG < −2.0 kcal/mol versus ΔG < −3.0 kcal/mol). Repeating the simulations under 300 mM NaCl showed a similar result, whereas under 5 mM NaCl the encounter complex regions were smaller. However, experimental results have shown association to be twofold faster in low-salt compared to high-salt conditions, and thus the size of the encounter complex region at a specific energy threshold is not directly linked to the rate of association. An examination of the electrostatic energy contribution during the simulation showed it to be concentrated on the right region (Fig. 1 B).
Figure 1.

BD simulations of the TEM1-BLIP WT. BLIP and TEM1 are represented as a gray surface and purple ribbon, respectively. (A) Encounter complexes are drawn as yellow isosurfaces representing the center of mass of TEM1 on BLIP at ΔG < −2.0 kcal/mol (transparent yellow) and ΔG < −3.0 kcal/mol (deep yellow). From left to right are the results obtained at NaCl concentrations of 5, 150, and 300 mM, respectively. (B) The lowest electrostatic energy configurations (ΔEel < −6 kcal/mol) at 150 mM NaCl. (C) The successful configurations at < −2.0 kcal/mol (transparent green) and ΔG < −3.0 kcal/mol (deep green) at 150 mM NaCl.
Figure 3.

Structural view and electrostatic potential of some of the BLIP mutants studied. The electrostatic potential of BLIP WT and mutants was calculated using APBS. In the electrostatic potential representations, TEM1 is designated as a gray ribbon. (A) Structural view of BLIP residues K8, D23, and D163. BLIP is represented as a gray surface, and TEM1 WT is represented as a purple ribbon. Encounter complexes are drawn as yellow isosurfaces representing the center of mass of TEM1 on BLIP at ΔG < −3.0 kcal/mol. The protein-protein complex is represented at the same orientation as in all other figures. (B) The electrostatic potential of D163K at 150 mM NaCl in comparison to WT. Red (negative) and blue (positive) contours are drawn at 1 kT/e. (C) Same as in B, but for K8A, K8E, and D23R,E28R.
Figure 6.
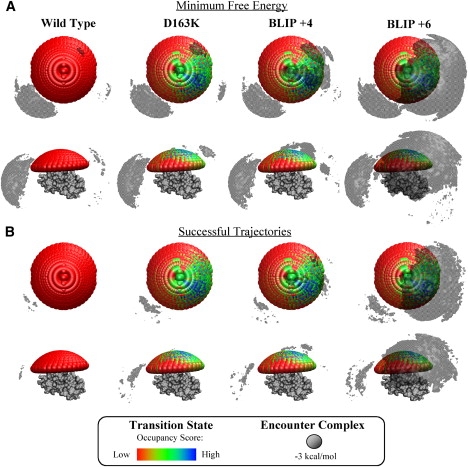
Superimposition of the transition-state occupancy maps and the encounter complex regions of the TEM1-BLIP complex. The cap represents the area of search for the transition state (each orb is the center of mass of one configuration that was examined), with colder colors representing structures that passed a more stringent cutoff filter. The gray area represents the encounter complex regions, as examined by BD simulations, defined by ΔG < −3 kcal/mol. (A) Minimal free energy of the encounter complex. (B) Successful trajectories of the encounter complex.
BD allows us to distinguish between successful trajectories, i.e., those that lead to complex formation, and all others. The criterion for a “successful trajectory” is that it satisfies “reaction criteria” for binding. These reaction criteria rely on the polar atom contacts observed in the structure of the bound complex. The requirement, as defined by R. R. Gabdoulline and R. C. Wade (personal communication, 2008) (24), is that at least two of these contacts should be formed at a distance of <5.5 Å and should be independent. However, one should note that Gabdoulline and Wade based this criterion on the best fit to the experimental data on the systems they analyzed, and it may be an over (or under) estimation of success in other cases. Fig. 1 shows a superimposition of the successful trajectories and the complete encounter complex region at ΔG < −2.0 and 3.0 kcal/mol (panels C and A). The results show few successful trajectories starting from the encounter complex at these energy threshold, and thus most of the encounter complex region does not seem to lead to complexation. The small number of successful trajectories may be related to the diffuse nature of the transition state of the TEM1-BLIP complex (31).
Fig. 2 A shows the free-energy profile of the lowest free-energy configuration for TEM1-BLIP at every d1-2 (center-to-center distance). The free-energy profile of the WT interaction showed one global minimum at d1-2 of 40 Å (in comparison with d1-2 of 27 Å for the complex). This minimum is a result of contributions of ΔEel and ΔEds, but not −TΔS. The same conformations can be analyzed in the configurational space itself. This analysis contains information about the optimal encounter process. Fig. 2 B shows that the optimal path was from the left region toward the interface, even though it was more distant from the interface, as nearly all of the most preferred configurations were there. The orientation of TEM1 along the optimal configuration path is mostly directed toward the interface (Fig. 2 B, white versus black dots).
Figure 2.

(A) Free-energy profile along the reaction path (ΔEel, electrostatic energy; ΔEds, desolvation energy; −TΔS, entropy loss; and ΔG, total free energy). (B) Optimal association pathway of WT, D163K, BLIP+4, and BLIP+6. BLIP and TEM1 WT are represented as gray surface and purple ribbon, respectively. In this figure, the simulation was with TEM1 encountering BLIP. The center-of-mass positions of the optimal configuration for each center-to-center distance (d1-2) are marked by spheres colored by cold colors (long d1-2) and warm colors (short d1-2). The optimal configurations are defined by minimal free energy in each d1-2. The vectors designate the orientation; black marks an interface residue, and white dots point toward the protein center (as seen in the bottom of the figure). In this simulation 10,000 trajectories were probed (with similar results obtained for 20,000 trajectories; data not shown).
Specifically targeting the fruitful encounter complex through electrostatic optimization
The BLIP D163K mutation was rationally designed to enhance the association rate of the TEM1-BLIP interaction by improving the local charge complementarity between the two proteins using the software PARE (Fig. 3 A) (11). This mutation is a hotspot for association and increases kon by ∼10-fold without significantly affecting koff. The BLIP D163K-TEM1 WT complex forms a number of specific residue-residue interactions, from which the transition state for association was mapped (31). These results prompted us to examine the encounter complex for this mutant using BD simulations, and to compare the results with the experimental data. In addition to BLIP D163K, we simulated other mutants that further increased the rate of association, including BLIP+4 (V165K, D163K, and V134K) and BLIP+6 (V165K, D163K, D135K, and N89K). These mutants enhance association by increasing the charge complementarity, as calculated using PARE (9,11). Notably, D163K, which is part of all of these mutant proteins, contributes most to the fast association reaction as compared to the other mutations included in BLIP+4 or BLIP+6 (11). The BD simulations for the three BLIP mutants were done once with BLIP static and TEM1 mobile (Fig. 4), and once with TEM1 static and BLIP mobile (Fig. 5). These simulations showed two encounter complex regions located in a similar position as in the WT interaction (Figs. 4 A and 5 A). However, the encounter region covers an area near the protein-protein interface that was not seen in the WT simulation. For D163K, this region was observed only for the more relaxed ΔG < −2 kcal/mol cutoff, whereas for BLIP+4 and BLIP+6 the encounter complex also appeared at the interface at ΔG < −3 kcal/mol. Moreover, the encounter complex region for the multiple-mutant BLIP proteins was much larger. As expected, the electrostatic contribution increased considerably in the area above the interface, but remained the same at other locations (Figs. 4 B and 5 B).
Figure 4.
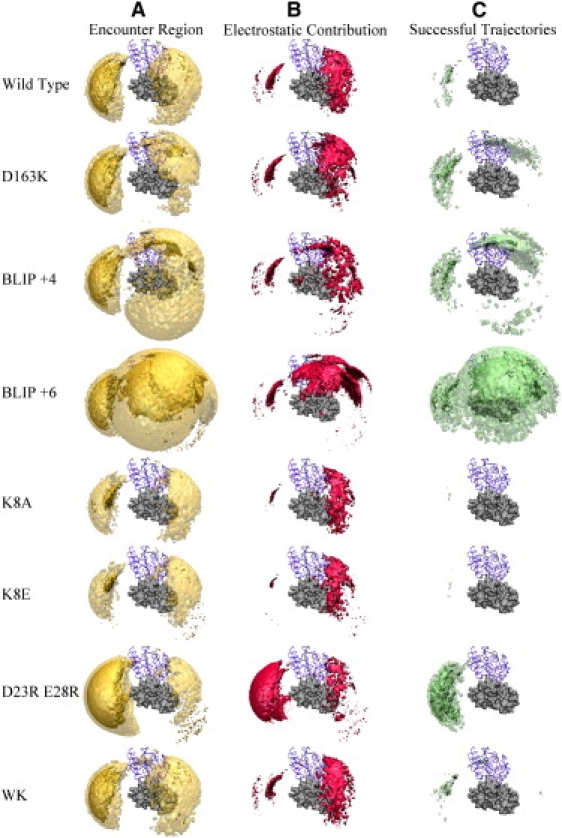
BD simulations of TEM1-BLIP mutants. The simulations shown here are of mobile TEM1 approaching static BLIP. BLIP is represented as a gray surface, and TEM1 WT is represented as a purple ribbon. All of the simulations were done at 150 mM NaCl. (A) Encounter complexes are drawn as yellow isosurfaces representing the center of mass of TEM1 on BLIP at ΔG < −2.0 kcal/mol (transparent yellow) and ΔG < −3.0 kcal/mol (deep yellow). (B) The configurations with the lowest electrostatic energy (ΔEel < −6 kcal/mol) are marked in red. (C) The successful configurations at < −2.0 kcal/mol (transparent green) and ΔG < −3.0 kcal/mol (deep green).
Figure 5.
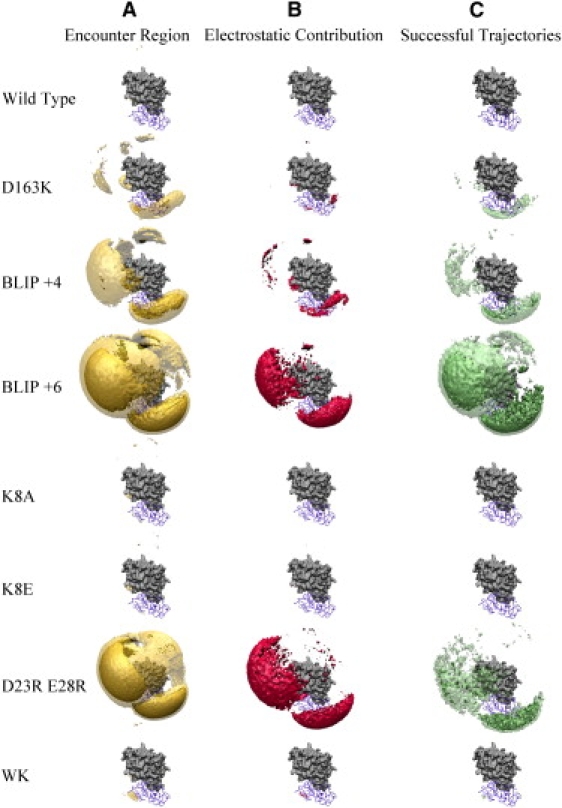
BD simulations of TEM1-BLIP mutants. The simulations shown here are of mobile BLIP approaching static TEM1. TEM1 is represented as a gray surface, and BLIP WT is represented as a purple ribbon. All of the simulations were done at 150 mM NaCl. (A) Encounter complexes are drawn as yellow isosurfaces representing the center of mass of TEM1 on BLIP at ΔG < −2.0 kcal/mol (transparent yellow) and ΔG < −3.0 kcal/mol (deep yellow). (B) The configurations with the lowest electrostatic energy (ΔEel < −6 kcal/mol) are marked in red. (C) The successful configurations at < −2.0 kcal/mol (transparent green) and ΔG < −3.0 kcal/mol (deep green).
Next we analyzed the successful trajectories (Figs. 4 C and 5 C) and found that a larger region of the encounter complex of these BLIP mutants led to successful binding compared to the WT. Moreover, the successful trajectories were mainly above the interface for BLIP+4 and BLIP+6 at ΔG < −3 kcal/mol, and for D163K at ΔG < −2 kcal/mol (Figs. 4 C and 5 C). A clear relation seems to exist between the occupancy of the successful trajectories and the rate of association for these mutants. This is also clearly seen from Table 1, which shows an increase in the number of successful trajectories for the faster-binding mutants.
Table 1.
Counts of successful trajectories
| Complex | Number of successful trajectories∗ | Number of successful trajectories† |
|---|---|---|
| BLIP WT TEM1 WT | 210 | 245 |
| BLIP D163K TEM1 WT | 1196 | 1108 |
| BLIP +4 TEM1 WT | 1651 | — |
| BLIP +6 TEM1 WT | 3096 | 2693 |
| BLIP K8A TEM1 WT | 195 | 225 |
| BLIP K8E TEM1 WT | 192 | 221 |
| BLIP D23R,E28R TEM1 WT | 220 | 277 |
| BLIP WT TEM1 WK | 197 | 241 |
The counts of successful trajectories are out of 200,000 runs.
TEM1 being mobile and BLIP being static.
BLIP being mobile and TEM1 being static.
Of interest, even though the free-energy landscapes of the fast-binding mutants differed from that of the WT, the free-energy profiles along the reaction path were very similar (Fig. 2 A). The free-energy profile of D163K had a lower minimum compared to the WT, yet the difference was very small. The minimum of BLIP+6 was wider compared to the WT, but again the differences were minor. Therefore, the major difference between these mutants is not in the energetic minimum, but rather in the free-energy landscape and number of successful trajectories.
Additional support for the improved guidance is found in the optimal-configurations analysis (Fig. 2 B). For the BLIP+4 and BLIP+6 mutants, the optimal configurations are near the binding site. Furthermore, the optimal pathway differs from that of the WT; now, the optimal pathway is from the right region toward the interface, rather than from the left region. The optimal pathway of the BLIP D163K mutant is similar to the WT optimal pathway but more specific.
The transition state for D163K and other fast-association mutants was previously mapped in a study using experimental data as input (31). When we superimposed the encounter complex from the BD simulations over the transition-state occupancy maps (Fig. 6), we observed a clear fit, particularly with the successful trajectories. Both methods of analysis showed TEM1 approaching BLIP near helix 5 and strand 15. The successful trajectories for TEM1 on BLIP+6 overlay nicely using the stringent ΔG < −3.0 kcal/mol threshold, whereas D163K and BLIP+4 show a good overlay only at the less-stringent threshold of ΔG < 2.0 (see Fig. S1 in the Supporting Material).
Futile encounter complexes
Up to this point in the study, we had only altered the size of the right encounter region. We then wanted to specifically change the size and energy of the left encounter region using mutations. This was done by altering the electrostatic potential near the left encounter region through mutating residues K8, D23, and E28 on BLIP (Fig. 3, calculated using APBS (39)). For K8A the left encounter region was smaller (Figs. 4 A and 5 A); however, for BLIP D23A or BLIP E28A no major differences from the WT were observed (data not shown). Therefore, we introduced the charge reverse, K8E mutant, and the double mutant D23R,E28R. Whereas K8A had a smaller positive patch compared to WT BLIP, K8E had a clear negative patch. D23R,E28R, on the other hand, introduced a very large positive patch (Fig. 3 B). These results encouraged us to run BD simulations for each of these BLIP mutants and TEM1 WT to examine their encounter complex relative to that of the WT.
The BLIP K8A and K8E mutants had a much smaller and energetically less favorable encounter region on the left side (compare ΔG < −2 kcal/mol with ΔG < −3 kcal/mol in Figs. 4 A and 5 A), with only a small reduction being observed on the right side. An opposite trend was observed for the BD simulation of BLIP D23R,E28R, with the left region expanding dramatically. Furthermore, this region was also more favorable energetically, as seen using ΔG < −3 kcal/mol. Calculating the successful trajectories for each of these mutants (Figs. 4 C and 5 C) did not show any for K8A or K8E using a threshold of −3 kcal/mol, and showed very few at −2 kcal/mol. In contrast, the D23R,E28R double mutant resulted in a significant increase in the number of successful trajectories. However, the total number of successful trajectories hardly changed (Table 1). As expected from the APBS calculations, the magnitude of the electrostatic energy of the left region shrank for the K8A and K8E mutants, whereas only minor changes were observed in the right region (Figs. 4 B and 5 B). The D23R,E28R mutant, on the other hand, resulted in an increase in the magnitude of the electrostatic energy of the left region. Thus, electrostatics contributed significantly to the differences in the free-energy landscape between these three mutants and the WT.
If the size of the encounter region or the energy of successful trajectories in the BD simulation were directly related to the rate of complex formation, we would expect these mutations to alter kon. Therefore, we produced and purified these mutant proteins, and measured their rate of association with WT TEM1 using a stopped-flow spectrophotometer. The association rate constants for all of these mutants were basically identical to the association rate of TEM1-BLIP WT (Table 2). Thus, either enlarging or reducing the encounter complex region in areas remote from the interface did not change the rate of association. The results above indicate that changing the electrostatic nature of a protein that affects the size and energy of an encounter region does not necessarily transform into faster binding. To further investigate the role of electrostatics in dictating the association rate of these mutant proteins, we determined kon under different ionic strengths (Fig. 7). According to Eq. 3, the effect of salt can be analyzed quantitatively from the linear fit of ln kon plotted versus 1/(1+κa). The slope of the linear regression is equal to ΔU (which is the electrostatic energy of interaction), and the intercept is the basal rate of association (which is the rate of association in the absence of electrostatic forces, as determined from the extrapolation to ∞ ionic strength). Values of ΔU for these three mutants are presented in Table 2. The three mutants had the same basal rate of association of ∼3 × 10⁴ M−1s−1 as the WT, and a similar ionic strength dependence. This implies that mutating residues that are remote from the interface and do not contribute to the electrostatic complementarity of the complex do not affect fruitful association, but may affect the size of futile encounter complexes.
Table 2.
Experimental and computational association rates and electrostatic energy of interaction
| Experimental kon |
Calculated kon |
ΔU‡ (kcal/mol) |
||||
|---|---|---|---|---|---|---|
| × 105(M−1s−1) ∗ | Relative | PARE† | BD† | Stopped-flow | PARE | |
| BLIP WT TEM1 WT | 2.6 | 1.0 | 1.0 | 1.0 | −2.07 | −1.65 |
| BLIP D163K TEM1 WT | 16 | 6.2 | 13.9 | 10.0 | −3.88 | −4.53 |
| BLIP +4 TEM1 WT | 21 | 8.2 | 27.4 | 11.3 | — | −5.28 |
| BLIP +6 TEM1 WT | 47 | 18.3 | 66.0 | 25.5 | — | −6.25 |
| BLIP K8A TEM1 WT | 2.6 | 1.0 | 0.8 | 1.0 | −2.04 | −1.43 |
| BLIP K8E TEM1 WT | 2.6 | 1.0 | 0.7 | 1.1 | −2.16 | −1.22 |
| BLIP D23R,E28R TEM1 WT | 2.8 | 1.1 | 1.4 | 1.5 | −2.19 | −1.96 |
| BLIP WT TEM1 WK | 14 | 5.6 | 1.0 | 1.5 | −4.18 | −1.60 |
Stopped-flow experiments were done in 10 mM Hepes pH 7.2, 150 mM NaCl. The standard error for the experimentally determined kon values was 20%.
Relative calculated rates of association at 150 mM NaCl. For PARE the WT experimental rate is used. In the BD simulation, the rate for WT association was 6.5 × 10⁶ M−1s−1. The standard error for kon calculation using BD was 12%.
ΔU is the electrostatic energy of interaction.
Figure 7.
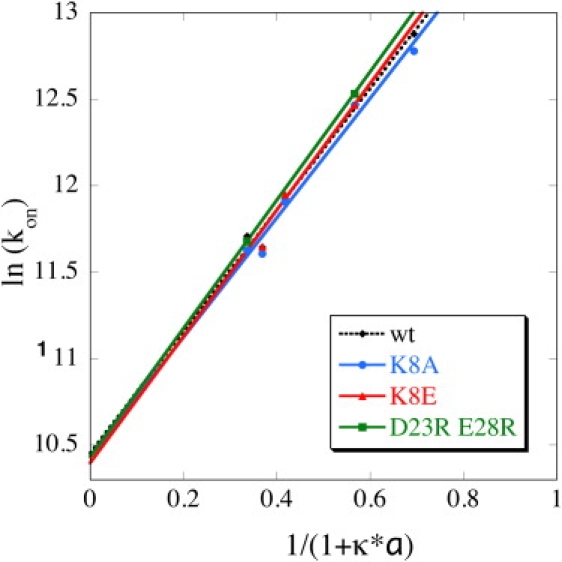
Association rate constants of WT and three BLIP mutants at different ionic strengths (0.05, 0.15, 0.5, 0.75, and 1 M).
Finally, we calculated kon values for the different mutant proteins from the BD simulations. The calculated value for WT was ∼25-fold faster than the experimental rate (Table 2). The BD calculated rate of association with charges turned off (basal rate) was calculated to be 1.15 × 10⁷ M−1s−1, which is even a little faster than WT at 150 mM salt (6.5 × 10⁶ M−1s−1). This shows that TEM1-BLIP association is not electrostatically driven (the net charge of TEM1 and BLIP is −7 and −2, respectively). As stated elsewhere (24), the BD computed rates are expected to exceed the experimental rates because diffusion sets an upper limit for the actual kon. The SDA calculated rate of 6.5 × 10⁶ M−1s−1 for TEM-BLIP WT is common for proteins with weak electrostatic steering. This implies that additional factors that are not in the model contribute to the measured kon. Possible contributions that reduce the rate compared to the diffusion-controlled case are conformational adjustment and desolvation. However, such BD simulations can reproduce relative rates as long as the relevant contributions to the relative rates are included in the model. Indeed, the calculated change in kon for all the mutations, except for the interaction of TEM1 WK with BLIP WT, were in line with the experimental data. Not surprisingly, they also correlated to the number of successful trajectories of each mutant (Table 1). Next, we calculated the rates of association using PARE, and also obtained a good correlation between the calculated and experimental rates for all the mutations, except for the interaction of TEM1 WK with BLIP WT (Table 2).
Changes in the interface structure can affect the rate of association
Most mutations that significantly affect the rate of association involve a change in the charge. Therefore, we were not surprised to find that E104W/Y105K on TEM1 (termed WK) increases the rate of association of the TEM1-BLIP complex by 5.5-fold. Using double-mutant cycle analysis, we found that WK interacts during the association reaction with BLIP D49 and S146 (attractive) and D163 (repulsive) (31). Furthermore, ionic strength analysis showed that the electrostatic energy of the TEM1 WK mutant interacting with BLIP WT is significantly more favorable than the WT interaction, very similar to that of D163K. That indicates that electrostatics play a part in the fast association rate of this mutant. However, in contrast to D163K, the basal rate of association of the WK mutant increased. Moreover, neither PARE nor BD predicted a change in the rate of association for WK (Table 2). Therefore, we were interested to see how the encounter region would change for this mutant.
Figs. 4 and 5 show the results of the BD simulations for the BLIP WT-TEM1 WK interaction. The results were very similar to those obtained for the WT, with the two encounter regions of the mutant overlaying those of the WT. One minor difference was that the WK encounter analysis showed a small encounter region above the interface. The electrostatic energy was similar to the WT, as also shown by PARE. In addition, the results from the successful-trajectories and optimal-pathway analyses were similar to those obtained for the WT (see Table 1), as was the calculated association rate for this mutant (Table 2). The data presented here suggest that increased electrostatic complementarity is not the reason for the faster binding of this mutant. One may speculate that a better fit of the local structure of the unbound proteins drives this faster association, a feature that cannot be detected by either BD or PARE. Although the mutant structure was modeled using two different methods with similar results, it is possible that this double mutant introduces a structural change in the backbone, which is very difficult to predict, and may have caused the differences between the experimental and computational results.
Discussion
Experimental data on kinetic processes can, at best, provide snapshots along the reaction coordinates, with computer simulations filling in the gaps. The association between TEM1 and BLIP is perfectly suited for detailed computational simulations that can be compared with the large bulk of experimental data gathered on this system, including the many mutations that directly affect the rate of association (9,11,31,35,46,47). In this study we investigated the free-energy landscape leading to association as calculated from BD simulations, and compared the findings with experimental results. The work is based on recently developed BD algorithms that enable a trajectories analysis of the association process to model the encounter region, as well as the free-energy landscape for association (4,23,25,27,48). The method used in this study was developed by Spaar et al. (27) and successfully applied on barnase-barstar. Two encounter regions were identified for barnase-barstar, with the energetically favorable one being located above the interface. However, the experimental analysis of the location of the transition state for this system showed a narrower, more specific transition state than the encounter complex identified by Spaar et al. (27) and Harel et al. (31). This may be interpreted as an energetic funnel in which the encounter complex is broader and the transition state is narrower, leading to the final complex formation.
The results of the BD simulation for WT TEM1-BLIP also show two encounter regions, neither of which is at the interface. The left region is larger and energetically more favorable, but more distant from the interface. Both regions may be valid encounter complexes; however, they imply a diffusive encounter complex, as the two regions are broad and remote from each other. Furthermore, these encounter regions do not guide the interaction toward the final complex, as can be seen in the successful-trajectories analysis, which shows very few of the encounter complex trajectories developing into a complex. This is in line with our inability to identify a specific transition state for WT TEM1-BLIP (31).
To better understand the role of the encounter regions observed in the BD simulations in the association reaction, we studied seven different mutant proteins that affect association. The mutants can be divided into three groups: 1), mutants that enlarge the encounter region near or above the physical binding site (BLIP mutants D163K, BLIP+4, and BLIP+6 interacting with TEM1 WT); 2), mutants that expand (BLIP D23R,E28R) or shrink (BLIP K8A, K8E) the encounter regions (particularly the left one); and 3), the TEM1 WK mutant that affects kon significantly but has only a minor effect on the free-energy landscape of the encounters. Mutations of group 1 have a very significant effect on kon (up to 20-fold), whereas mutations of group 2 do not change the association rate at all. These mutants clearly show that no simple relation can be found between either the size or the energy of the encounter regions and the rate of association. Moreover, even the energy map of successful encounters does not always correlate with the observed change in kon. For example, the encounter region of the BLIP D23R,E28R double mutant shows more successful trajectories at a ΔG cutoff of < −2 kcal/mol compared to the WT, but the total number of successful trajectories was similar (as was the measured kon). Since both the size and energy of the encounter region also increased dramatically for this mutant, one may assume that this region does not steer the coming protein toward complexation, and therefore the number of successful trajectories was not increased despite their lower energy. Thus, the number (and not the energy) of successful trajectories determines the overall rate. Conversely, for group 1, a good correlation was observed between the energy and number of successful encounters and kon. Group 1 mutations, which are located at the vicinity but outside the physical binding site, were designed to optimize the electrostatic energy of interaction of the complex (11). Thus, in this case, the lower-energy successful encounters do lead to association. We note that the experimentally determined transition state, which was mapped using double-mutant cycles and was assigned for TEM1-BLIP with optimized electrostatic attraction (group 1 mutations), overlays with the BD-calculated encounter region, yet it is more restricted. (Fig. 6). The experimentally determined transition state fits the area of successful trajectories mapped for these mutants much better. This subgroup within the encounter region can be assumed to be much closer to the transition state, which is defined as the activated form of a molecule that has partly undergone a chemical reaction. Since the transition state has to be on the pathway to product formation, only successful trajectories fulfill this requirement.
The mutant data presented here suggest that some of the encounter regions do not contribute to association and thus are futile encounters. In general, the futile regions are distant from the interface, and although these regions are suggested to be energetically favorable by the simulations, they do not influence the association rate. The reason for this is that in reality, futile encounters do not develop into final complexes, and hardly affect the concentration of free protein in solution. In the extreme case, where futile encounters would absorb a major fraction of the free proteins from solution, association would be affected. This was experimentally shown for the association of barnase and barstar in the presence of the positively charged poly-ion Heparin in low-salt buffer (30), and is similar to the effect observed in an ion-exchange column. However, for regular protein-protein interactions, either enlarging or reducing this futile area does not affect the association reaction.
The term “encounter complex” is frequently used to describe the pathway of protein-protein association. This term is assigned different meanings in different contexts. For example, in calculating association rate constants by BD simulations, Gabdoulline and Wade used this term to refer to the end-point of diffusional association (49), which would be similar to what was defined by Alsallaq and Zhou (50–52) as the transient complex. However, “encounter complex” may refer also to low free-energy regions in configurational space (27), or to a minor, dynamic state that is in equilibrium with a dominant, stereospecific complex as seen in NMR experiments (16).
The data presented here suggest the possibility that much of the very large encounter complex observed experimentally for the association between the phosphocarrier protein, Hpr, and three proteins in the bacterial phosphotransferase system (using paramagnetic relaxation enhancement (PRE) NMR) was futile, as further suggested in a follow-up study (14,53).
In group 3 we have one double mutant whose encounter region resembles that of the WT, despite the large increase in the rate of association measured for this mutant. Thus, although electrostatics has a major role in dictating association, other factors may influence the rate as well. For WK, a different basal rate was determined. This may imply a rather different association mechanism that is not simulated correctly by either BD or PARE.
Finally, the data presented here could explain why group 1 mutations do not change the rate of dissociation, despite their large effect on the electrostatic complementarity between the two proteins that causes an increase in the rate of association. From the comparison of the encounter complex with successful encounter trajectories, it becomes clear that although encounters are readily formed, most of them are futile. The mutations in group 1 were designed to increase the percentage of fruitful encounters, and hence kon. However, most encounters will still dissociate. Thus, even for group 1 mutations, once the final complex dissociates, it will have a small chance of re-forming. This behavior is a result of the relative flat energy landscape leading to association before the transition state, which is characterized by desolvation and formation of short-range interactions, versus the steep energy landscape leading to dissociation, which is composed of breaking the short-range interactions between the proteins (Fig. 8). One should not confuse Fig. 8 with Fig. 2 A, as the latter depicts only the encounter complex region, and does not include the final docking.
Figure 8.
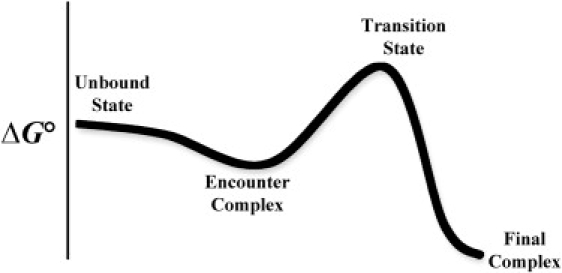
Free-energy diagram describing the pathway for protein-protein binding. Two proteins in solution will collide with one another at a rate dictated by the translational diffusion. From here, rotational diffusion may lead the proteins to form an encounter complex, which may develop into the final complex.
Acknowledgments
We thank Dr. Razif Gabdoulline, Dr. Rebecca Wade, and Prof. Volkhard Helms for their generous assistance in the BD simulations and analysis, and reading the manuscript.
This research was supported by the Clore Center for Biological Physics (grant 1609).
Supporting Material
References
- 1.Fersht A.R. W.H. Freeman and Company; New York: 1999. Structure and Mechanism in Protein Science. [Google Scholar]
- 2.Schreiber G. Kinetic studies of protein-protein interactions. Curr. Opin. Struct. Biol. 2002;12:41–47. doi: 10.1016/s0959-440x(02)00287-7. [DOI] [PubMed] [Google Scholar]
- 3.Janin J. The kinetics of protein-protein recognition. Proteins. 1997;28:153–161. doi: 10.1002/(sici)1097-0134(199706)28:2<153::aid-prot4>3.0.co;2-g. [DOI] [PubMed] [Google Scholar]
- 4.Vijayakumar M., Wong K.Y., Schreiber G., Fersht A.R., Szabo A. Electrostatic enhancement of diffusion-controlled protein-protein association: comparison of theory and experiment on barnase and barstar. J. Mol. Biol. 1998;278:1015–1024. doi: 10.1006/jmbi.1998.1747. [DOI] [PubMed] [Google Scholar]
- 5.Frisch C., Fersht A.R., Schreiber G. Experimental assignment of the structure of the transition state for the association of barnase and barstar. J. Mol. Biol. 2001;308:69–77. doi: 10.1006/jmbi.2001.4577. [DOI] [PubMed] [Google Scholar]
- 6.Camacho C.J., Weng Z., Vajda S., DeLisi C. Free energy landscapes of encounter complexes in protein-protein association. Biophys. J. 1999;76:1166–1178. doi: 10.1016/S0006-3495(99)77281-4. [DOI] [PMC free article] [PubMed] [Google Scholar]
- 7.Sommer J., Jonah C., Fukuda R., Bersohn R. Production and subsequent second-order decomposition of protein disulfide anions lengthy collisions between proteins. J. Mol. Biol. 1982;159:721–744. doi: 10.1016/0022-2836(82)90110-3. [DOI] [PubMed] [Google Scholar]
- 8.Berg O.G., von Hippel P.H. Diffusion-controlled macromolecular interactions. Annu. Rev. Biophys. Biophys. Chem. 1985;14:131–160. doi: 10.1146/annurev.bb.14.060185.001023. [DOI] [PubMed] [Google Scholar]
- 9.Selzer T., Schreiber G. New insights into the mechanism of protein-protein association. Proteins. 2001;45:190–198. doi: 10.1002/prot.1139. [DOI] [PubMed] [Google Scholar]
- 10.Northrup S.H., Erickson H.P. Kinetics of protein-protein association explained by Brownian dynamics computer simulation. Proc. Natl. Acad. Sci. USA. 1992;89:3338–3342. doi: 10.1073/pnas.89.8.3338. [DOI] [PMC free article] [PubMed] [Google Scholar]
- 11.Selzer T., Albeck S., Schreiber G. Rational design of faster associating and tighter binding protein complexes. Nat. Struct. Biol. 2000;7:537–541. doi: 10.1038/76744. [DOI] [PubMed] [Google Scholar]
- 12.Kiel C., Selzer T., Shaul Y., Schreiber G., Herrmann C. Electrostatically optimized ras-binding ral guanine dissociation stimulator mutants increase the rate of association by stabilizing the encounter complex. Proc. Natl. Acad. Sci. USA. 2004;101:9223–9228. doi: 10.1073/pnas.0401160101. [DOI] [PMC free article] [PubMed] [Google Scholar]
- 13.Clore G.M., Tang C., Iwahara J. Elucidating transient macromolecular interactions using paramagnetic relaxation enhancement. Curr. Opin. Struct. Biol. 2007;17:603–616. doi: 10.1016/j.sbi.2007.08.013. [DOI] [PMC free article] [PubMed] [Google Scholar]
- 14.Tang C., Iwahara J., Clore G.M. Visualization of transient encounter complexes in protein-protein association. Nature. 2006;444:383–386. doi: 10.1038/nature05201. [DOI] [PubMed] [Google Scholar]
- 15.Iwahara J., Clore G.M. Detecting transient intermediates in macromolecular binding by paramagnetic NMR. Nature. 2006;440:1227–1230. doi: 10.1038/nature04673. [DOI] [PubMed] [Google Scholar]
- 16.Volkov A.N., Worrall J.A., Holtzmann E., Ubbink M. Solution structure and dynamics of the complex between cytochrome C and cytochrome C peroxidase determined by paramagnetic NMR. Proc. Natl. Acad. Sci. USA. 2006;103:18945–18950. doi: 10.1073/pnas.0603551103. [DOI] [PMC free article] [PubMed] [Google Scholar]
- 17.Hulsker R., Baranova M.V., Bullerjahn G.S., Ubbink M. Dynamics in the transient complex of plastocyanin-cytochrome F from Prochlorothrix hollandica. J. Am. Chem. Soc. 2008;130:1985–1991. doi: 10.1021/ja077453p. [DOI] [PubMed] [Google Scholar]
- 18.Kim Y.C., Tang C., Clore G.M., Hummer G. Replica exchange simulations of transient encounter complexes in protein-protein association. Proc. Natl. Acad. Sci. USA. 2008;105:12855–12860. doi: 10.1073/pnas.0802460105. [DOI] [PMC free article] [PubMed] [Google Scholar]
- 19.Miyashita O., Onuchic J.N., Okamura M.Y. Transition state and encounter complex for fast association of cytochrome C2 with bacterial reaction center. Proc. Natl. Acad. Sci. USA. 2004;101:16174–16179. doi: 10.1073/pnas.0405745101. [DOI] [PMC free article] [PubMed] [Google Scholar]
- 20.Miyashita O., Onuchic J.N., Okamura M.Y. Continuum electrostatic model for the binding of cytochrome C2 to the photosynthetic reaction center from Rhodobacter sphaeroides. Biochemistry. 2003;42:11651–11660. doi: 10.1021/bi0350250. [DOI] [PubMed] [Google Scholar]
- 21.Elcock A.H., Sept D., McCammon J.A. Computer simulation of protein-protein interactions. J. Phys. Chem. 2002;105:1504–1518. [Google Scholar]
- 22.Gabdoulline R.R., Wade R.C. Biomolecular diffusional association. Curr. Opin. Struct. Biol. 2002;12:204–213. doi: 10.1016/s0959-440x(02)00311-1. [DOI] [PubMed] [Google Scholar]
- 23.Gabdoulline R.R., Wade R.C. Simulation of the diffusional association of barnase and barstar. Biophys. J. 1997;72:1917–1929. doi: 10.1016/S0006-3495(97)78838-6. [DOI] [PMC free article] [PubMed] [Google Scholar]
- 24.Gabdoulline R.R., Wade R.C. Protein-protein association: investigation of factors influencing association rates by Brownian dynamics simulations. J. Mol. Biol. 2001;306:1139–1155. doi: 10.1006/jmbi.2000.4404. [DOI] [PubMed] [Google Scholar]
- 25.Motiejunas D., Gabdoulline R., Wang T., Feldman-Salit A., Johann T. Protein-protein docking by simulating the process of association subject to biochemical constraints. Proteins. 2008;71:1955–1969. doi: 10.1002/prot.21867. [DOI] [PubMed] [Google Scholar]
- 26.Spaar A., Helms V. Free energy landscape of protein-protein encounter resulting from Brownian dynamics simulations of barnase:barstar. J. Chem. Theory Comput. 2005;1:723–736. doi: 10.1021/ct050036n. [DOI] [PubMed] [Google Scholar]
- 27.Spaar A., Dammer C., Gabdoulline R.R., Wade R.C., Helms V. Diffusional encounter of barnase and barstar. Biophys. J. 2006;90:1913–1924. doi: 10.1529/biophysj.105.075507. [DOI] [PMC free article] [PubMed] [Google Scholar]
- 28.von Hippel P.H., Berg O.G. Facilitated target location in biological systems. J. Biol. Chem. 1989;264:675–678. [PubMed] [Google Scholar]
- 29.Schreiber G., Fersht A.R. Energetics of protein-protein interactions: analysis of the barnase-barstar interface by single mutations and double mutant cycles. J. Mol. Biol. 1995;248:478–486. doi: 10.1016/s0022-2836(95)80064-6. [DOI] [PubMed] [Google Scholar]
- 30.Schreiber G., Fersht A.R. Rapid, electrostatically assisted association of proteins. Nat. Struct. Biol. 1996;3:427–431. doi: 10.1038/nsb0596-427. [DOI] [PubMed] [Google Scholar]
- 31.Harel M., Cohen M., Schreiber G. On the dynamic nature of the transition state for protein-protein association as determined by double-mutant cycle analysis and simulation. J. Mol. Biol. 2007;371:180–196. doi: 10.1016/j.jmb.2007.05.032. [DOI] [PubMed] [Google Scholar]
- 32.Camacho C.J., Kimura S.R., DeLisi C., Vajda S. Kinetics of desolvation-mediated protein-protein binding. Biophys. J. 2000;78:1094–1105. doi: 10.1016/S0006-3495(00)76668-9. [DOI] [PMC free article] [PubMed] [Google Scholar]
- 33.Spaar A., Volkhard H. Ionic strength effects on the association funnel of barnase and barstar investigated by Brownian dynamics simulations. J. Non-Crystalline Solids. 2006;352:4437–4444. [Google Scholar]
- 34.Lim D., Park H.U., De Castro L., Kang S.G., Lee H.S. Crystal structure and kinetic analysis of β-lactamase inhibitor protein-II in complex with TEM-1 β-lactamase. Nat. Struct. Biol. 2001;8:848–852. doi: 10.1038/nsb1001-848. [DOI] [PubMed] [Google Scholar]
- 35.Albeck S., Schreiber G. Biophysical characterization of the interaction of the β-lactamase TEM-1 with its protein inhibitor BLIP. Biochemistry. 1999;38:11–21. doi: 10.1021/bi981772z. [DOI] [PubMed] [Google Scholar]
- 36.Guex N., Peitsch M.C. Swiss-Model and the Swiss-PdbViewer: an environment for comparative protein modeling. Electrophoresis. 1997;18:2714–2723. doi: 10.1002/elps.1150181505. [DOI] [PubMed] [Google Scholar]
- 37.Rohl C.A., Strauss C.E., Misura K.M., Baker D. Protein structure prediction using Rosetta. Methods Enzymol. 2004;383:66–93. doi: 10.1016/S0076-6879(04)83004-0. [DOI] [PubMed] [Google Scholar]
- 38.Dolinsky T.J., Nielsen J.E., McCammon J.A., Baker N.A. Pdb2Pqr: an automated pipeline for the setup of Poisson-Boltzmann electrostatics calculations. Nucleic Acids Res. 2004;32:W665–W667. doi: 10.1093/nar/gkh381. [DOI] [PMC free article] [PubMed] [Google Scholar]
- 39.Baker N.A., Sept D., Joseph S., Holst M.J., McCammon J.A. Electrostatics of nanosystems: application to microtubules and the ribosome. Proc. Natl. Acad. Sci. USA. 2001;98:10037–10041. doi: 10.1073/pnas.181342398. [DOI] [PMC free article] [PubMed] [Google Scholar]
- 40.Gabdoulline R.R., Wade R.C. Effective charges for macromolecules in solvent. J. Phys. Chem. 1995;100:3868–3878. [Google Scholar]
- 41.Gabdoulline R.R., Wade R.C. Brownian dynamics simulation of protein-protein diffusional encounter. Methods. 1998;14:329–341. doi: 10.1006/meth.1998.0588. [DOI] [PubMed] [Google Scholar]
- 42.Antosiewicz J., Miller M.D., Krause K.L., McCammon J.A. Simulation of electrostatic and hydrodynamic properties of Serratia endonuclease. Biopolymers. 1997;41:443–450. doi: 10.1002/(SICI)1097-0282(19970405)41:4<443::AID-BIP8>3.0.CO;2-M. [DOI] [PubMed] [Google Scholar]
- 43.Antosiewicz J., Briggs J.M., McCammon J.A. Orientational steering in enzyme-substrate association: ionic strength dependence of hydrodynamic torque effects. Eur. Biophys. J. 1996;24:137–141. doi: 10.1007/BF00180270. [DOI] [PubMed] [Google Scholar]
- 44.Antosiewicz J., McCammon J.A. Electrostatic and hydrodynamic orientational steering effects in enzyme-substrate association. Biophys. J. 1995;69:57–65. doi: 10.1016/S0006-3495(95)79874-5. [DOI] [PMC free article] [PubMed] [Google Scholar]
- 45.Selzer T., Schreiber G. Predicting the rate enhancement of protein complex formation from the electrostatic energy of interaction. J. Mol. Biol. 1999;287:409–419. doi: 10.1006/jmbi.1999.2615. [DOI] [PubMed] [Google Scholar]
- 46.Kozer N., Kuttner Y.Y., Haran G., Schreiber G. Protein-protein association in polymer solutions: from dilute to semidilute to concentrated. Biophys. J. 2007;92:2139–2149. doi: 10.1529/biophysj.106.097717. [DOI] [PMC free article] [PubMed] [Google Scholar]
- 47.Reichmann D., Rahat O., Albeck S., Meged R., Dym O. The modular architecture of protein-protein binding interfaces. Proc. Natl. Acad. Sci. USA. 2005;102:57–62. doi: 10.1073/pnas.0407280102. [DOI] [PMC free article] [PubMed] [Google Scholar]
- 48.Elcock A.H., Gabdoulline R.R., Wade R.C., McCammon J.A. Computer simulation of protein-protein association kinetics: acetylcholinesterase-fasciculin. J. Mol. Biol. 1999;291:149–162. doi: 10.1006/jmbi.1999.2919. [DOI] [PubMed] [Google Scholar]
- 49.Gabdoulline R.R., Wade R.C. On the protein-protein diffusional encounter complex. J. Mol. Recognit. 1999;12:226–234. doi: 10.1002/(SICI)1099-1352(199907/08)12:4<226::AID-JMR462>3.0.CO;2-P. [DOI] [PubMed] [Google Scholar]
- 50.Alsallaq R., Zhou H.X. Prediction of protein-protein association rates from a transition-state theory. Structure. 2007;15:215–224. doi: 10.1016/j.str.2007.01.005. [DOI] [PubMed] [Google Scholar]
- 51.Alsallaq R., Zhou H.X. Energy landscape and transition state of protein-protein association. Biophys. J. 2007;92:1486–1502. doi: 10.1529/biophysj.106.096024. [DOI] [PMC free article] [PubMed] [Google Scholar]
- 52.Alsallaq R., Zhou H.X. Electrostatic rate enhancement and transient complex of protein-protein association. Proteins. 2007;71:320–335. doi: 10.1002/prot.21679. [DOI] [PMC free article] [PubMed] [Google Scholar]
- 53.Suh J.Y., Tang C., Clore G.M. Role of electrostatic interactions in transient encounter complexes in protein-protein association investigated by paramagnetic relaxation enhancement. J. Am. Chem. Soc. 2007;129:12954–12955. doi: 10.1021/ja0760978. [DOI] [PubMed] [Google Scholar]
Associated Data
This section collects any data citations, data availability statements, or supplementary materials included in this article.