

Abstract
Spreading depression (SD) involves current flow through principal neurons, but the pattern of current flow over the expanse of susceptible tissues or individual principal neurons remains undefined. Accordingly, tissue and single cell maps made from digital imaging of voltage-sensitive dye changes in hippocampal organotypic cultures undergoing SD were processed via optical current source density analysis to reveal the currents associated with pyramidal neurons. Two distinctive current flow patterns were seen. The first was a trilaminar pattern (420 μm2) that developed with the onset of SD in CA3 pyramidal neurons, in which SD most often began. This initial pattern comprised a somatic current sink with current sources to either side in the dendrites that lasted for seconds extending into the first aspect of the classical “inverted saddle” interstitial direct current waveform of SD. Next, the somatic sink backpropagated at a speed of millimeters per minute into the proximal dendrites, resulting in a reversal of the initial current flow pattern to its second orientation, namely dendritic sinks associated with a somatic source. The latter persisted for the remainder of SD in CA3 and was the only pattern seen in CA1, in which SD was rarely initiated. This backpropagating SD current flow resembles that of activity-dependent synaptic activation. Retrograde and associative signaling via principal neuron current flow is a key means to affect tissue function, including synaptic activation and, by extension, perhaps SD. Such current-related postsynaptic signaling might not only help explain SD but also neuroprotection and migraine, two phenomena increasingly recognized as being related to SD.
Keywords: migraine, ischemic tolerance, neuroprotection, reaction-diffusion, inhibition, dendrite
Introduction
Spreading depression (SD) is a benign process (Nedergaard and Hansen, 1988; Kunkler and Kraig, 2004) that can trigger increased resilience of involved tissue to subsequent injury (Kraig and Kunkler, 2002; Dirnagl et al., 2003). Furthermore, SD may evoke migraine aura and related pain (Milner, 1958; Moskowitz et al., 1993; Kunkler and Kraig, 2003; Lauritzen and Kraig, 2005). Because SD is an electrogenic process, it involves local ionic currents (Nicholson and Kraig, 1981; Somjen, 2001). However, such SD currents are poorly characterized.
Inferential evidence suggests that current flow occurs with SD, most likely involving principal neurons. For example, interstitial direct current (DC) potential swings negative from SD involving neocortical gray tissue, whereas that of white matter immediately below swings positive (Leão, 1951). Such differential potential changes in these brain regions could stem from current flow into and out of core conductors, respectively (Lorente de Nó, 1947). Layer III/IV pyramidal neurons could provide such core elements because their axons pass through underlying white matter to synapse with their contralateral counterparts (Connors, 1998). Indeed, interstitial DC negativity from SD at layer III/IV in rodent neocortex consistently occurs with a minor DC change at this same level in contralateral neocortex, which does not experience SD (Caggiano and Kraig, 1996, 1998; Caggiano et al., 1996). This latter minor negative DC change may represent a passive sink involving axon terminals, whereas the more proximal white matter serves as a passive source to the large active sink involving dendrites of the pyramidal neurons that experience SD. Similar differential interstitial potential changes during SD occur parallel to the long axis of cerebellar Purkinje neurons (Nicholson and Kraig, 1981). Interstitial field potentials, however, cannot provide sufficient resolution to detect SD-related current flow, because involved differential potential changes are small. Alternatively, transformation of interstitial DC potential changes using current source density (CSD) analysis would be well suited to this purpose (Nicholson and Freeman, 1975).
Wadman et al. (1992) were the first to apply CSD analysis to hippocampal SD. Their measurements confirm that the predominant negative DC change of SD in the dentate gyrus occurs with a current sink in the dendritic area and an associated current source at the cell body layer, consistent with current flow through granule neurons. This initial application of CSD technology, however, is complicated by seizures at the onset of SD and comparatively low resolution. Accordingly, we applied optical (Plenz and Aertsen, 1993) CSD analysis (OCSDA) strategies with high spatiotemporal resolution using hippocampal organotypic cultures (HOTCs), in which SD can be evoked without initiating seizures (Kunkler and Kraig, 2004).
OCSDA here confirms and extends observations from Somjen's laboratory (Wadman et al., 1992). Importantly, high spatiotemporal resolution measurements indicate that SD initiation and propagation occur with a strikingly unique and reversing current flow pattern involving pyramidal neurons that suggests involvement of a backpropagating electrogenic process.
Parts of this work have been published previously in abstract form (Kunkler and Kraig, 1998b; Kraig et al., 1999, 2000).
Materials and Methods
Hippocampal organotypic culture preparation. HOTCs were prepared and maintained as described previously (Stoppini et al., 1991; Kunkler and Kraig, 1997, 1998a). Slices were maintained in vitro for 21-35 d before use because this is a period over which the cultures approximate in vivo conditions. For example, pyramidal neuron synaptic activity (i.e., amplitude of evoked field potentials and susceptibility to SD) is stable from at least 21-35 d in vitro (Muller et al., 1993; Kunkler and Kraig, 1998a, 2004; Schmitt et al., 2002; Kunkler et al., 2004). Furthermore, pyramidal neuron viability plus astrocytic and microglial reactivity (assessed by immunostaining for neuron-specific neuronal protein, glial fibrillary acidic protein, and the CR3 receptor, respectively) remain unchanged during this period (Kunkler and Kraig, 1997; Schmitt et al., 2002; Kunkler et al., 2004). However, pyramidal cell dendritic spine density (McKinney et al., 1999) in HOTCs evolves only to that seen in 15-d-old in vivo counterparts (Harris et al., 1992), perhaps because of reduced synaptic input. Nonetheless, HOTCs show intrinsic patterns of inhibitory neurotransmission similar to that seen in vivo (Streit et al., 1989) and glutamate receptors and other synaptic proteins remain stable for at least 4 weeks in vitro (Bahr et al., 1995). Finally, cytokine expression, which is a subtle reflection of tissue vitality, is similar between HOTCs and hippocampus in vivo (Hulse et al., 2004; Kunkler et al., 2004).
Like acute brain slices, HOTCs are deafferented. However, the considerably longer survival of HOTCs allows sufficient time for some synaptic reorganization. For example, some CA3 and CA1 pyramidal cells synapse back onto CA3 pyramidal neurons in HOTCs (Debanne et al., 1995). Furthermore, CA1-CA1 synapses and synapses from CA3 to dentate granule cells are seen in HOTCs (Gutierrez and Heinemann, 1999). Nonetheless, these aberrant connections are not a dominant confounding factor for the use of HOTCs. This conclusion follows from the fact that the basic trisynaptic loop (i.e., dentate gyrus-CA3-CA1) is structurally (Zimmer and Gähwiler, 1984) and functionally (Gutierrez and Heinemann, 1999) preserved in HOTCs. Accordingly, because currents related to evoked field potentials parallel those seen in vivo, we suspect that currents defined from OCSDA are likely also to parallel those seen in vivo. Comparison of our results to those from the Somjen's laboratory confirms this notion (Wadman et al., 1992).
Electrophysiological recording. Electrophysiological recordings of field potentials and SD were completed as described previously (Kunkler and Kraig, 1998a, 2004). Briefly, HOTCs on a Millipore (Bedford, MA) insert were placed in a 35 mm culture dish, mounted in a movable open perfusion microincubator (PDMI-2; Medical Systems, Greenvale, NY) on an inverted microscope (DM IRBE; Leica, Wetzlar, Germany) sitting on a specially designed Gibraltar frame (EXFO, Victor, NY). HOTCs were perfused from below (1-2 ml/min) with a normal Ringer's solution containing the following (in mm): 124 NaCl, 2 KCl, 26 NaHCO3, 2.5 CaCl2, 1 MgCl2, 1.2 KH2PO4, 6 glucose (290-300 mOsm), adjusted to pH 7.3-7.4 with 5% CO2/50% O2-balance N2 and maintained at 36°C. HOTCs were covered with light mineral oil to prevent dehydration. However, we suspect that this coverage reduced oxygen access to the HOTCs because it necessitated the elevation of oxygen tension to 50% to keep SD duration (Schmitt et al., 2002) consistent with that seen in vivo (Somjen, 2001). This conclusion is supported by our more recent experiments conducted without mineral oil coverage and at 20% oxygen tension in which SD also paralleled that seen in vivo (R. P. Kraig, unpublished observations).
An interstitial microelectrode (tip diameter of 4-6 μm) filled with 150 mm NaCl was driven into the CA3 pyramidal cell layer to record interstitial DC potentials. A bipolar (90% platinum/10% iridium) twisted, Teflon-insulated wire (125 μm diameter; catalog #7780; A-M Systems, Everett, WA) stimulating electrode was placed gently on top of the dentate gyrus. A 1 m KCl agar bridge ground electrode was placed outside of the insert and within the 35 mm culture dish beneath the level of the perfusate. Stimulating pulses were 100 μs in duration and 20-50 V in intensity at a constant current setting using a stimulator (1800 series; World Precision Instruments, New Haven, CT) and an associated stimulus isolator. Interstitial DC signals were monitored using an A-1 Axoprobe amplifier system (Axon Instruments, Union City, CA), digitized with a 1200 series Digidata system (Axon Instruments) and analyzed using Axoscope software (version 9.0; Axon Instruments). Fast evoked signals were digitized and sampled every 100 μs; slow potential recordings were digitized and sampled every 0.1-5 ms. SD was triggered by switching perfusate to a modified Ringer's solution in which NaCl was replaced with a millimolar equivalent of sodium acetate (NaAc) (pH 7.6) (Kunkler and Kraig, 1998a, 2004; Kunkler et al., 2004). This modified Ringer's solution was pulsed on for 2 min, and SD was initiated with a single pulse from the bipolar stimulating electrode.
Fluorescence imaging. For voltage-sensitive fluorescence imaging of HOTCs, cultures were stained for 1 h with RH795 (Invitrogen, Carlsbad, CA) by gentle rocking on a platform at room temperature [to reduce potential internalization and related compartmentalization of dye (Invitrogen)]. The dye, dissolved in a HEPES-buffered salt solution (7 μg/ml; 7.4 pH) with 0.1% dimethylsulfoxide (DMSO) (Sigma, St. Louis, MO) was placed on top (0.8 ml) and under (1 ml) the platform to enhance staining. Then, the cultures were washed for 30 min and transferred to the recording chamber. For single-cell voltage dye imaging, CA3 pyramidal cell neurons were first impaled with microelectrodes pulled on a Brown-Flaming puller (model P-87; Sutter Instruments, Novato, CA) from 1.5 mm borosilicate glass (A-M Systems). The microelectrodes were filled with a solution containing 2% biotin ethylenediamine (Invitrogen), 12 mm RH795, and 22.5% DMSO in 1.2 m potassium acetate and had a final resistance of 80-120 MΩ. Neurons having a stable resting potential more negative than -50 mV were injected with iontophoretic current (400 ms pulses at 2 Hz; 1.0-1.5 nA) for 30-45 min, after which 1 additional hour was allowed for diffusion of the dye into the dendrites. Epifluorescence was elicited (530 nm excitation; 712 nm emission) with a T.I.L.L. Photonics Polychrome II monochrometer (Applied Scientific Instruments, Eugene, OR) using a 75 W xenon short arc lamp run via a stabilized power supply. Images (256 × 256 pixels) were acquired using a 12-bit Pentamax CCD camera with a GEN IV intensifier (Roper Scientific, Trenton, NJ) and MetaFluor Imaging System software (Universal Imaging Corporation, West Chester, PA). Whole cultures and injected pyramidal neurons were imaged using 6.3× and 20× objectives, respectively. Image acquisition began ∼5 s before the electrical stimulus to induce SD. Image acquisition rate was 4/s (250 total images) for whole HOTCs and 29/s for single cells (999 total images). Small voltage pulses indicating the acquisition time for each image were electronically registered to records of interstitial DC potential to allow direct comparisons between OCSDA and interstitial DC potential evidence of SD.
The strategy for OCSDA was adapted from Plenz and Aertsen (1993) for calculation of plasma membrane current flow from optically generated tissue (and cellular) voltage map changes using the voltage-sensitive dye RH795. The fluorescence of this dye decreases as membranes are depolarized (Grinvald et al., 1994) and accurately reflects cellular depolarization (Contreras and Llinás, 2001). Others have noted a reversible widening of action potentials during voltage-sensitive dye loading that returns to normal when the dye-loading patch electrode is removed (Antic et al., 1999). Although we did not measure CA3 spike width during loading, we always measured evoked field potentials with SD initiation (Kunkler and Kraig, 1998a) and never noted a change in spike potential duration (data not shown). Thus, it is well suited for use with equations modified to replace measurements of interstitial DC potential changes (Freeman and Nicholson, 1975) with optically derived membrane potential changes for calculation of CSD.
Assumptions that were applied to OCSDA here are similar to those used by Plenz and Aertsen (1993), which follow those initially used for the more traditional interstitial potential-based CSD technique (Freeman and Nicholson, 1975; Nicholson and Freeman, 1975) and demonstrates a close similarity between the two techniques. First, OCSDA measurements were made parallel to the long axis of CA3 and CA1 pyramidal neurons to maximize spatial delineation of related transmembrane current flow estimates. Second, individual measurements of current flow were derived from an area of interest (AOI) that was small compared with the longitudinal extent of expected cellular activation. Freeman and Nicholson (1975) showed that both orthodromic and antidromic cerebellar field potentials can be optimally resolved for CSD analysis from potential recording made with interstitial microelectrode spacing of <50 μm. Accordingly, as a first approach to defining the current sources and sinks of SD, we used an individual AOI (37 × 37 μm). This AOI was then repeated in time (as described below) to either create one-dimensional OCSDA profiles or repeated in space via long-axis side-by-side repetition for two-dimensional OCSDA profiles. Third, the profile rows were interpreted to reflect synchronously activated and coupled pyramidal neurons, which as a result, could be modeled as a one-dimensional cable equation (Rall, 1962; Turner, 1984) with a contiguous purely ohmic intracellular milieu. These assumptions seem reasonable given that pyramidal cells extend over the length of the longitudinal single-profile row and are highly connected via gap junctions (Kraig and Kunkler, 2002). Furthermore, although astrocytes are also somewhat oriented along the long axis of principle neurons (Nixdorf-Bergweiler et al., 1994; Kunkler and Kraig, 1997) and they too absorb some voltage-sensitive dye, their contribution to potential current flow from SD is likely minor. This assumption follows from the facts that these cells are never contiguous along the full width of hippocampus and so could not create the needed contiguous intracellular current flow pathway over this distance. In addition, astrocytic membrane resistivity is low and their positioning staggered throughout the hippocampus. Thus, any potential astrocytic currents would involve small distances from sinks to sources whose affects would cancel one another when viewed from the whole tissue. Fourth, tissue transparency changes from SD can reach up to 6% of that normally seen (Világi et al., 2001; Tao et al., 2002) and thus conceivably could confound interpretation of HOTC fluorescence signals. However, such contamination seems likely to be minor because OCSDA changes closely parallel those seen by Wadman et al. (1992) who used traditional CSD strategies using interstitial DC-potential-sensing microelectrodes in hippocampus in vivo.
Procedures for conversion of voltage map images to their respective CSD counterparts were accomplished as follows. First, the area of voltage map images to be quantitated for OCSDA was made ready using a Visual Basic macro run within ImagePro Plus (version 4.1; Media Cybernetics, Silver Spring, MD). Using orientation provided from a phase-contrast image of the whole HOTC, this macro reflected and/or rotated each image as needed so that CA3 and CA1 pyramidal neuron layers were both parallel to the left side of the image frame (see Fig. 1). For single-cell OCSDA, an initial fluorescent image was used to align cells for analysis, and then the brightness and contrast of the images were made uniform (i.e., brightness of 99 and contrast of 96).
Figure 1.

Membrane potential change propagation of spreading depression in hippocampal organotypic cultures. Images show typical interstitial DC changes from SD in an HOTC (top image to the left) plus the recording paradigm used to trigger SD (top, second image from left), followed by the associated progressive voltage-sensitive dye (RH795) changes registered every 5 s for 65 s. SD was triggered by transiently changing Ringer's solution to an NaAc-based Ringer's solution coupled to a single electrical pulse from a bipolar stimulating electrode (solid blue circles) placed in the dentate gyrus (red smaller curve). Interstitial DC changes of SD were recorded in the pyramidal cell layer (red larger curve) at CA3 (solid blue microelectrode). Red dots in the interstitial DC record correspond to time points for associated voltage map images. Polarization of neural tissue in these images is oriented so that depolarization (D) is indicated toward the blue and polarization (P) to the red of the pseudocolor voltage scale (top image to left). SD began in CA3 (image at 10 s) and propagated to include most of CA1 (image at 30 s), but not the dentate gyrus, before the interstitial DC potential returned toward baseline (images at 45-65 s). Little more than the general waveform of propagating cellular depolarization of SD can be resolved with these voltage map changes. The yellow row (37 × 2368 μm) used for one-dimensional calculations (i.e., see Fig. 4) is shown here for comparison.
Second, an AOI (defined above) was placed and then moved along a line 64 times to produce a single profile row. This profile (see Figs. 1, 4, yellow bars) passed perpendicularly through both the CA3 and CA1 cell layer and excluded elements of the dentate gyrus. Average pixel intensity for each AOI was determined and exported to an Excel (Microsoft, Red-mond, WA) spreadsheet. A full profile row sampling consisted of moving the AOI a total of 4 pixels, quantitating the average intensity, outputting the value, and then advancing to the next 4 pixels for a total of 64 AOI increments per profile line (i.e., 37 × 2368 μm) (see Figs. 1, 4). These single profile rows were then repeated in time to create one-dimensional (i.e., distance vs time) voltage “intensity” matrices for either whole HOTCs (sampled at four images per second) or single pyramidal cells (sampled at 29 images per second), respectively. Third, voltage intensity matrices over time (for one-dimensional analyses) or space and then time (for two-dimensional analyses) were analyzed using MATLAB software (version 6.5; MathWorks, Natick, MA) to obtain OCSDA using the script described below. OCSDA was derived from the second spatial derivative of the transmembrane voltage signal (Freeman and Nicholson, 1975; Plenz and Aertsen, 1993). Because the derivatives of noisy data can amplify high-frequency noise, we combined differentiation with noise reduction by the method of Lanczos (1956) as done previously for CSD evaluation of interstitial field potential data (Freeman and Nicholson, 1975). Initially, third-degree polynomial fitting was applied to the data, and then the first derivative was calculated. This process was repeated to further filter the data and obtain the second derivative (i.e., the OCSD), at location x according to the following equation:
 |
(1) |
Figure 4.

Basic elements illustrating one-dimensional optical current source density analysis strategy. One-dimensional OCSDA (i.e., distance vs time) increased the spatiotemporal resolution over that seen with two-dimensional analyses. The basic elements of these analyses are depicted above, and their results (n = 8) are in Figure 5. A distance versus time “raw data” voltage intensity map (top) was created using a single (yellow) profile row perpendicular to the CA3-CA1 pyramidal neuron layers (bottom left) that was then repeated over time at 4 Hz. For orientation, a CA3-CA1 neuronal architecture schematic was added to the resultant voltage intensity map. The bipolar stimulating electrode position used to trigger SD is shown by blue circles, with the blue microelectrode depicting the recording zone in CA3 used to confirm the occurrence of SD by interstitial DC change (bottom right). Red dots in the latter record correspond to time marks in Figure 5. DG, Dentate gyrus.
where a0 =-10, a±1 =-4, a±2 = 1, a±3 = 4, a±4 = 4, ϕ(x + mh) is the value of the potential as derived from the image data, and h is the distance between image locations, which was 1 here. This equation is based on the version derived previously by Freeman and Nicholson (1975) to calculate CSD from field potential data. Finally, our use of the “filter function” of MATLAB to implement the equation added data (consisting of all zeros) at the leftmost extreme of each matrix (this ensures that the filtered matrix always has the same dimensions as the original matrix). As a result, erroneous data are added for the first nine spatial records, which shifts the OCSDA falsely to the right. Deleting this erroneous data compensates for this effect and results in maintained spatial alignment with the source data.
A MATLAB script was used to convert raw voltage intensity data into one- and two-dimensional CSD profiles. This was accomplished in the following steps. First, spatial components of the voltage maps in which no data were located (i.e., off of the HOTC or away from fluorescently injected single cells) were removed. Second, the first 5-10 images were removed to exclude images that contained potential residual charge on the camera CCD (i.e., excessive intensity). Third, space and time calibrations were then applied to the data. Fourth, raw voltage map data were normalized to the first five images. Fifth, a filtered spatial second derivative of the data were created. Sixth, erroneous data created by addition of blank data rows were removed. Finally, OCSDA results were plotted as relative current change (with sinks greater than zero and sources less than zero).
For two-dimensional OCSDA, full 2368 × 2368 μm images were imported directly into MATLAB in which image orientation, filtering, and processing of voltage intensity to its second derivative were performed as above. Voltage intensity data here was sampled at 4 Hz and illustrated every 5 s.
Immunohistochemistry. HOTCs were prepared for immunostaining as described previously (Kunkler and Kraig, 1997; Kunkler et al., 2004). Briefly, cultures were fixed overnight in an ice-cold solution of 10 mmol/l sodium periodate, 75 mmol/l lysine-HCl, and 2% paraformaldehyde fixative in 37 mmol/l phosphate buffer, 6.2 pH. The cultures were then gently removed from the insert with a fine brush and placed in 10 mmol/l PBS, 7.4 pH, for an additional 24 h. The latter solution also contained 1% Triton X-100 and 0.01% NaN3 (Sigma). Next, the cultures were quenched with 0.3% H2O2 in PBS for 15 min, washed three times in PBS for 10 min each, and placed for 1 h in blocking solution consisting of 3% goat serum, 0.25% Triton X-100, and 0.01% NaN3 in PBS to block nonspecific binding. The cultures were then incubated overnight at 4°C in blocking solution containing anti-neurofilament 68 kDa (1:1000; Sigma). After three washes in PBS, the cultures were incubated in peroxidase-labeled anti-mouse secondary antibody (1:100; BioSource, Camarillo, CA) for 1 h. The immunoreactive product was visualized with the diaminobenzidine reaction. To examine the specificity of the immunoreactivity, the primary antibody was omitted to provide a nonspecific control. To visualize biotin-injected neurons, cultures were fixed in 4% paraformaldehyde in 0.1 m phosphate buffer overnight and then placed in PBS containing 1% Triton X-100. Sections were processed with the avidin-biotinylated enzyme complex method (Vector Laboratories, Burlingame, CA) for photomicroscopy.
Statistics. Descriptive statistics (mean ± SD) and Mann-Whitney rank sum test were performed using SigmaStat 3.0 (SPSS, Chicago IL).
Figure preparation. Field potential and slow potential records were composed using Origin (version 7.0; Microcal Software, Northampton, MA) and CorelDraw software (version 11.0; Corel, Ottawa, Ontario, Canada). Field potential records were smoothed using a Savitzky-Golay smoothing filter at 13 points in Origin. Components of OCSDA from MATLAB were composed in Adobe Photoshop 6.01 (Adobe Systems, San Jose, CA) or Corel Draw.
Results
Tissue potential changes of SD, although dramatic in magnitude and expanse, have minimal utility for detecting detailed spatiotemporal features involved with triggering SD or SD itself. For example, RH795-based potential measurements showed the slowly propagating event of SD in all whole HOTCs (n = 58) quantified in this study (Fig. 1). Furthermore, these measurements confirmed that SD began significantly (p < 0.001; Mann-Whitney rank sum test) more often in CA3 (n = 52) than in CA1 (n = 6) and propagated (2.63 ± 0.61 mm/min; n = 7) toward its regional counterpart. This is consistent with our previous observations of SD in HOTCs (Kunkler and Kraig, 1998a, 2004; Kunkler et al., 2004) and opposite of that seen in acute hippocampal brain slices in which SD most often begins in CA1 (Snow et al., 1983). However, these cellular potential maps alone were incapable of revealing any temporally or spatially distinct electrophysiological phenomena related to SD or its initiation.
Current flow changes from spreading depression initiation
Conversion of HOTC voltage maps to two- and one-dimensional OCSDA, as well as single-cell OCSDA, each showed similarly unique (but progressively more resolved) spatiotemporal features. This allows separation of current flow characteristics of SD into those that begin with its trigger and persist early into SD from those present during the main phase of SD and its propagation. For example, Figures 1, 2, 3, 4, 5, representative of all records for one- and two-dimensional OCSDA, were derived from the same raw voltage map to show progressively improved spatiotemporal resolution, indicating the complementary utility of each analysis format.
Figure 2.
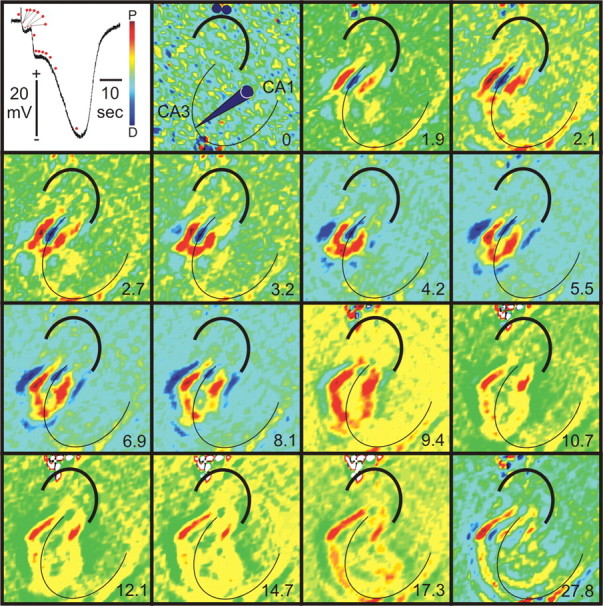
Two-dimensional optical current source density analysis of spreading depression in hippocampal organotypic cultures. Two-dimensional OCSDA of SD provided initial evidence for unique sequence and orientation of current flow changes from SD. Images show typical (n = 10) interstitial DC changes of SD in an HOTC at CA3 (top image to left) plus recording paradigm (top, second image from left as described in Fig. 1) and associated two-dimensional OCSDA montage at selected time points (indicated as seconds after SD trigger to bottom right of each image). Red dots in interstitial DC record correspond to time points of associated two-dimensional OCSDA. Polarization of neural tissue in these images is oriented so that depolarization (D) is indicated toward the blue (i.e., current sink) and polarization (P) to the red (i.e., current source) of the pseudocolor voltage scale (top image to left). Pyramidal cell layer is indicated by thin black curve and dentate gyrus by thicker black curve in each OCSDA image. The first OCSDA image (time 0) shows relatively uniform green-yellow coloration, indicating relatively uniform potential across the HOTC. Irregularly appearing small areas of blue (sink)-red (source) change may reflect spontaneous electrical activity. This pattern was replaced (images 1.9-2.7 s) by comparatively large current flow changes in a small zone of CA3 consisting of a large pyramidal neuron cell layer current sink (blue) with equally large current sources (red) to either side, presumably stemming from proximal pyramidal neuron dendrites. This cellular area of increased current flow was 420 μm on a side. At the same time, an elongated source (yellow-red) extends toward CA1, possibly involving current outflow through Schaffer collateral axons. These changes occur after the stimulus pulse used to initiate SD, a period correlated to a small negative DC shift in the interstitial record and before the large DC shift associated with SD. Accordingly, they may reflect current flow changes associated with triggering SD and its initial development in CA3. Conversely, the main component of SD itself (e.g., red dots noting images at 5.5-27.8 s) occurs with a predominant current source (red) that travels toward CA1 from a leading edge at the pyramidal neuron cell body layer. Images are 2368 × 2368 μm.
Figure 3.

Cytoarchitectural staining of hippocampal organotypic cultures emphasizes suggested neuronal distribution of current sources and sinks involved in triggering spreading depression. A phase-contrast image was always used to superimpose an estimation of the dentate gyrus (thick black curve) and pyramidal cell layer (thin black curve) to each OCSDA image (left image). This maneuver provided the initial basis to suggest that triggering SD by a bipolar electrical pulse to the dentate gyrus evoked a localized current flow in CA3 that consisted of a pyramidal neuron cell body layer current sink (blue) and dendritic sources (red) to either side. To further emphasize this spatial orientation of SD trigger current flow, the pseudocolored sources and sink areas were next superimposed with images marked for axons (using neurofilament immunostaining; middle image) and for pyramidal cell neurons (using RH795/biocytin injections; right image). In each case, overall HOTC dimensions were scaled to the phase-contrast image. Scale bar, 250 μm.
Figure 5.
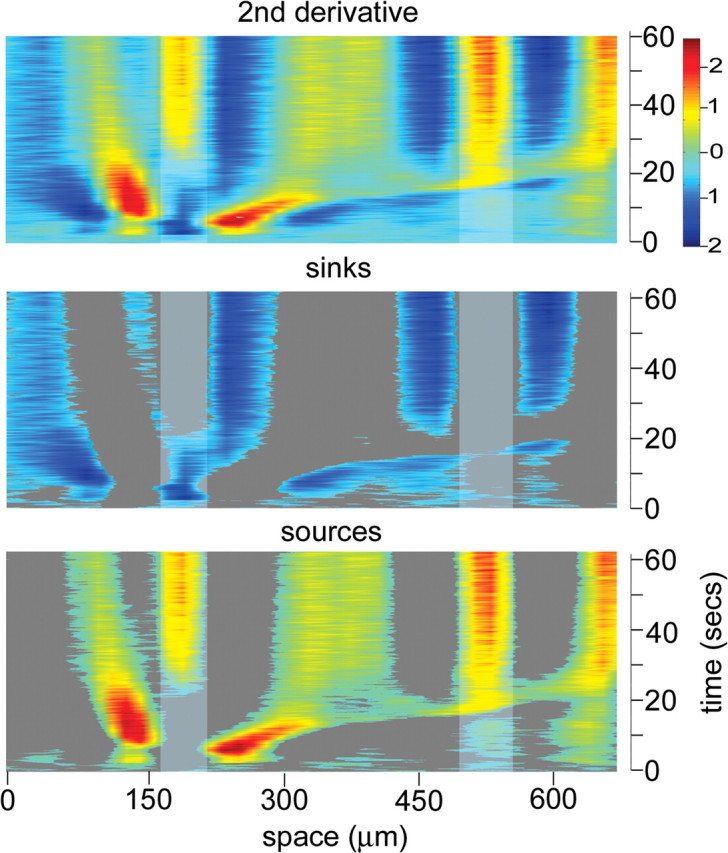
One-dimensional optical current source density analysis of spreading depression in hippocampal organotypic cultures. The second derivative of the voltage intensity map of raw data shown in Figure 4 was used to approximate the current sources and sinks of SD (top) with the pseudocolor scale showing depolarization (i.e., current sinks) toward the blue and polarization (i.e., current sources) toward the red. For further clarity, the current profiles were separated into associated sinks (middle) and sources (bottom). The vertical light gray-shaded columns reflect respective positions of the CA3 and CA1 neuronal cell body layers indicated in the “raw data” image (Fig. 4). Records show that little distinct current information was initially present. However, with the triggering pulse of SD (correlated to a small negative DC deflection in interstitial record), a distinct current sink (blue) became evident at the CA3 pyramidal neuron cell body layer. This was surrounded on either side by current sources (red) and more distally by less intense sinks (lighter blue), which presumably stemmed from pyramidal neuron dendrites. Then, at 20 s, a point that includes the initial inverted saddle-shaped first DC deflection in CA3, this dendrosomatic current flow relationship reversed for the remainder of SD. The pyramidal neuron cell body layer became a current source (yellow-red), and the proximal dendritic areas to either side became current sinks (light blue-dark blue). A predominant current source band (red-yellow) extended from the CA3 apical dendritic area to CA1 pyramidal neuron dendritic and cell body layer at ∼1.3 mm/min, possibly reflecting current source spread through the Schaeffer collaterals. CA1 area current flow changes resembled those during the main component of SD in CA3, namely a current source (yellow-red) along the pyramidal neuron cell body layer and current sinks (blue) to either side. A triggering phase current flow pattern was never seen in CA1.
The triggering pulse for SD elicited (n > 100) a positive-going DC potential change that rapidly shifted to a more slowly decaying negative wave that preceded (Fig. 2, DC record, 6 dots after the electrical pulse) the classical “inverted saddle-shaped” DC change of hippocampal SD (Herreras and Somjen, 1993; Kunkler and Kraig, 1998a, 2004). Continued ability to record aspects of dentate gyrus evoked field potentials during this phase (R. P. Kraig and P. E. Kunkler, unpublished observations) supports the notion that it precedes SD, which occurs in the absence of evoked electrophysiological activity. During this pre-SD phase, two distinctive OCSDA changes were seen. The first consisted of a trilaminar square-shaped (420 ± 42 μm2; n = 10) current flow pattern that developed shortly after the triggering pulse. This pattern included a current sink at the CA3 pyramidal neuron cell body layer and current sources on either side in the dendritic layers (Fig. 2). Then, 2.6 ± 0.7 s (n = 10) after the stimulus pulse, the pyramidal neuron cell body layer current sink developed a leading-edge current source. The latter became contiguous with the dendritic current sources but remained relatively stationary until 3.7 ± 1.6 s (n = 10) after the stimulus pulse before beginning to slowly (∼3 mm/min) propagate toward CA1 (Fig. 2, images through 4.2 s). This pattern persisted for 8.3 ± 3.3 s (n = 10), a period that included the first, rapid DC change of the inverted saddle-shaped waveform (Fig. 2, image at 9.4 s). The latter wave propagated more rapidly (∼5 mm/min), consistent with that noted previously for SD in HOTCs (Kunkler and Kraig, 1998a).
The second distinctive OCSDA change was an initial current flow pattern that consisted of a current source in the form of a curved ribbon that extended toward the CA1 area, whose structural analog could be Schaeffer collaterals (Fig. 2, image at 2.1 s). This impression is enhanced by relating the triggering OCSDA changes to images of pyramidal neuronal structure (via biocytin staining; n = 5) and their axonal processes (via neurofilament immunostaining; n = 5) (Fig. 3).
One-dimensional OCSDA provided improved spatiotemporal detail over that seen with two-dimensional analyses and further demonstrated that the triggering pulse of SD elicited a somatic current flow sink with adjacent dendritic sources that persisted into the first saddle-shaped interstitial DC change of SD (Figs. 4, 5). Current flow positions were estimated by superimposing the AOI for OCSDA onto an initial, phase-contrast image. Consistent with two-dimensional analyses, the CA3 pyramidal neuron cell layer showed a current flow sink (n = 8) immediately after the bipolar electrical pulse used to trigger SD. However, dendrites, in addition to showing proximal current sources, initially showed more distal current flow sinks. Furthermore, this somatic and proximal current flow pattern persisted for 24.6 ± 6.1 s (n = 8), a period that included both the trigger DC change and the initial deflection of the inverted saddle-shaped DC waveform of SD itself.
Single-cell OCSDA revealed the most resolved dendritic current changes of SD (Fig. 6). During the triggering phase, current flow patterns along the apical dendrites extending to the soma showed a current flow orientation consisting of a sink-source-sink-source pattern. Only three pyramidal neurons from a total of 15 monitored showed this initial dendritic current flow pattern and the somatic current sink (with reversal to source during SD), perhaps because these cells were outside of the SD current flow trigger zone (see below).
Figure 6.

Single-cell optical current source density analysis of spreading depression in hippocampal organotypic cultures. Single pyramidal neurons (n = 15) were injected with RH795/biocytin to maximize spatial resolution via OCSDA of SD-related current source and sinks. Records (distance vs time) shown are derived from a typical injected CA3 pyramidal neuron (middle black/white image) oriented as in Figure 4 with raw data (top image) used to approximate via the second derivative, the current sources, and sinks of SD (second from top image). Reliable current flow information is limited to ∼50-225 μm (e.g., the extent of cellular fluorescence), with more distal changes consistent with processed image edge noise. The latter results were then separated for emphasis to current sinks (third image from top) and current sources (bottom image). Current flow changes for this single cell resembled those seen in CA3 using one-dimensional analyses (Fig. 5), namely an initial current sink (blue) that reversed to current sources and then sinks movingout to the dendrites on either side. Then, with the second phase of SD (i.e., at ∼5-10 s), this current pattern reversed to one showing a current source at the soma with a sink-source-sink pattern extending into the dendrites, consistent with known synaptic inputs to pyramidal neurons. Top image shows related interstitial DC changes associated with triggering pulse and SD itself. Black dots on interstitial DC record correspond to 5 s marks on OCSDA images.
Current flow changes of spreading depression
Current flow patterns during the predominant interstitial DC negativity of SD in CA3 were reversed from those seen during the triggering and initial phase of SD at the soma and proximal (but not distal) dendrites (Figs. 2, 5, 6). Evidence for this reversal is apparent from the two-dimensional analyses. Shortly after the first deflection of the inverted saddle-shaped interstitial DC potential of SD, two-dimensional OCSDA (n = 8) showed a predominant current source at the pyramidal neuron cell body layer. The latter principally propagated toward the CA1 layer (Fig. 2). Current sinks appeared at either side and slightly behind, as if in the wake, of the current source leading edge.
A similar current flow pattern in CA3 was evident during the peak interstitial DC change of SD using one-dimensional analyses (Fig. 5). For example, after the triggering pulse and first DC deflection aspect of SD, the current flow sink evident at the pyramidal neuron cell body layer in CA3 reversed to a current flow source for the remainder of SD (n = 8). At the same time, adjacent proximal dendritic areas became current flow sinks.
One-dimensional OCSDA from the CA1 area also supports the suggestion that the current flow characteristics of the SD trigger and its first inverted saddle-shaped DC waveform component are different from those of the maximal DC shift component. Current flow changes appear to propagate from CA3 to CA1 at the rate of SD (Fig. 5). However, unlike the changes seen in CA3, those of CA1 consist of only a pyramidal neuron cell body layer current source, surrounded by proximal dendritic sinks and more distal sources (n = 8). Neither the SD triggering change nor the initial, sharp DC deflection of the inverted saddle-shaped waveform of SD were seen in CA1 (Kunkler and Kraig, 2004), suggesting that this aspect may be involved in triggering SD but is not essential for its propagation. This notion is supported by single-cell measurements. Only 3 of 15 single-cell OCSDA measurements showed a current reversal with SD like that seen in CA3 using whole HOTCs. The initiation trigger current zone for SD is ∼420 × 420 μm and persists for ∼6 s while propagating ∼3 mm/min. Thus, the triggering phase of SD and its first large interstitial DC deflection would only be evident to an area ∼900 μm in diameter (Fig. 2). Because RH795/biocytin-injected cells were distributed over a wide area (Fig. 3), perhaps 12 of the 15 cells were beyond this initiation area and so would only show OCSDA changes like that seen in CA1 from one-dimensional measurements.
Discussion
Application of OCSDA in HOTCs allowed detection of distinctive current flow features of SD. First, the trigger for SD consisted of a trilaminar current flow that began with a large current sink localized to the pyramidal neuron cell body layer in CA3 that was surrounded on either side by current sources, persisting for seconds. At the same time, a thin ribbon-like current source briefly appeared extending toward CA1, consistent with the course of Schaeffer collaterals. Second, the initial trilaminar current pattern evolved to a slowly propagating, leading-edge wave with a predominant current source and lesser trailing sinks. The latter persisted long enough to include the initial, interstitial DC deflection of SD. Third, the longer-lasting secondary interstitial DC potential deflection of SD occurred with a spatially reversed current flow pattern that persisted for the duration of SD. Here, the CA3 pyramidal neuron cell body layer was a current source and proximal dendrites to either side current sinks. Fourth, OCSDA changes that extended to CA1 plus those from single cells, most of which were outside of the initial trigger and SD zone, showed a current flow somatic source with surrounding dendritic sinks. These results indicate that currents of SD can be grouped to two specific time frames. The first involves triggering SD and extends into its early phase (i.e., first DC change of the inverted saddle waveform), whereas the second involves the predominant depolarizing phase of SD (i.e., second DC change of the inverted saddle waveform).
Other evidence exists to indicate that SD can be divided into these two phases. NMDA receptor antagonism blocks SD propagation but not necessarily initiation (Marrannes et al., 1988). Also, selective NMDA receptor inhibition blocks the late aspect of the inverted saddle DC change, but it blocks neither initiation nor propagation of the early phase (Herreras and Somjen, 1993). Additionally, computer-based simulations from experimental data suggest that interstitial potassium changes are essential for induction of SD but not its propagation (Kager et al., 2000), whereas the early phase of SD includes NMDA and persistent sodium currents and the late phase currents more exclusively involves NMDA (Somjen, 2001).
Current flow changes from triggering SD and its early evolution
Although the ion species for the somatic inward current flow remain uncertain, movement of the current sink from the soma to proximal apical dendrites is suggestive of recognized physiological processes. Spontaneous and evoked activation of CA1 (and by extension CA3) pyramidal neurons via EPSPs triggers an associated current sink at the proximal dendrites and a current source at cell bodies (for review, see Buzsáki and Traub, 1998). Furthermore, this current flow pattern is only briefly inverted at the soma when these dendritic EPSPs sufficiently depolarize the cell body area to generate an action potential. Conversely, inward somatic current flow can be seen when action potentials backpropagate from axons, through the soma and into dendrites, producing so-called backpropagating action potentials (b-APs) (for review, see Colbert, 2001). The somatic SD current sink movement to dendrites resembles the movement of b-APs, albeit at a much slower speed. The typical one-dimensional tissue OCSDA changes of Figure 5 show that the somatic sink moves to the apical dendritic area at ∼0.6 mm/min, whereas the speed along a single neuron (Fig. 6) is ∼1.4 mm/min. Movement of somatic action potentials into dendrites typically occurs at ∼100 μm/msec (Taylor and Dudek, 1984). The great difference in backpropagation speed of these two phenomena suggests that they may be mediated by different processes. However, because of the similarly unique origin and direction of the current flow patterns, we think it is useful to make the comparison.
Several physiological processes involve b-APs, including antidromic activation, seizures, and excitatory synaptic pathway activation. Some CA3 axons extend to the dentate gyrus in HOTCs (Gutierrez and Heinemann, 1999) as well as in vivo (Wu et al., 1998), and thus they could be activated by bipolar electrical stimulation of the dentate gyrus. However, because their density is comparatively low compared with mossy fibers, it is unlikely that their antidromic activation is the main source of somatic inward current from SD initiation. Alternatively, aspects of seizures resemble the OCSDA changes of SD. First, inward somatic currents are also seen during electrographic seizures in acute hippocampal brain slices (Wadman et al., 1992). Second, epileptiform discharges in acute hippocampal slices occur with increased b-APs (Bernard et al., 2004). Third, SD in acute hippocampal slices is often preceded by high-frequency bursting (Somjen, 2001), which conceivably could include b-APs. This follows from the fact that b-APs are an activity-dependent associative signal seen with long-term potentiation (Magee and Johnston, 1997; Markram et al., 1997), a form of cellular learning typically induced by high-frequency theta-burst electrical stimulation (Kandel, 2000). Bursting in CA3 is seen in HOTCs with the onset of SD from theta-burst stimulation in the dentate gyrus (without replacement of Ringer's chloride with acetate) (Kraig, unpublished observations). Fourth, although seizures do not occur with the onset of SD in HOTCs (Schmitt et al., 2002; Kunkler and Kraig, 2004; Kunkler et al., 2004), changes in somatic inhibition are similar to that seen with seizure initiation. Tonic somatic GABAergic inhibition (Soltesz et al., 1995; Poncer et al., 1997) in experimental epilepsy involving hippocampus is enhanced in the CA1 area (Cossart et al., 2001). However, Cohen et al. (2002) showed that somatic GABAergic-induced hyperpolarization (and associated inhibition) of human epileptic subiculum becomes depolarizing to involved principal neurons, which, as a result, synchronize with other principal neurons and related interneurons, and so may trigger epileptiform activity, although this point remains controversial (Wozny et al., 2003).
CA3 area pyramidal neurons also show a high capacity for synchronous activity (Traub and Jefferys, 1998) and so might also show depolarizing somatic GABAergic activity with SD activation in HOTCs (Kunkler and Kraig, 2004). Our typical SD induction paradigm includes transient exposure to Ringer's solution in which chloride is replaced with acetate (Kunkler and Kraig, 1998a). This likely prompts a reversal of IPSPs (Thompson et al., 1988), which when coupled to a single bipolar electrical pulse from the dentate gyrus, triggers SD in CA3 (Kunkler and Kraig, 1998a, 2004). Furthermore, the P/Q calcium channel blocker ω-agatoxin-IVA stops SD in HOTCs (Kunkler and Kraig, 2004). Importantly, ω-agatoxin-IVA also abolishes IPSPs generated by GABAergic neurons that terminate at the perisomatic level of pyramidal neurons in HOTCs (Poncer et al., 1997) and that are responsible for tonic, action potential-independent inhibition under normal circumstance in acute slices (Soltesz et al., 1995). Although sodium acetate exposure is unnecessary for hippocampal SD induction in vivo, SD may similarly involve reversed or reduced IPSPs. High-frequency neuronal activity, commonly used to induce SD, triggers either a reversal of IPSPs (Benardo, 1993) or retrograde-based signaling that inhibits IPSPs (Morishita and Alger, 2001).
Current flow changes of SD
Current sources evident in the proximal dendrites during triggering SD and during its early onset likely represent passive outward return current flow from the active somatic sink (Figs. 2, 5, 6). Although the ionic species for this outward current flow also remain undefined, it is likely to include potassium. Potassium accumulation to the interstitial space (ISS) occurs before the major DC depolarization wave of SD (Kraig and Nicholson, 1978), although such accumulation is disputed (Somjen, 2001). Early, selective and widespread (i.e., ∼420 μm2) synchronous depolarization of principal neuron dendrites has not been emphasized previously in SD. Potassium accumulation to the dendritic area ISS could prompt both excitatory and inhibitory transmitter release from local presynaptic terminals, as well as enhanced responses from so-called “silent” synapses (Voronin et al., 2004). If these transmitter effects are sufficiently large, they would become the dominant cellular current generating force and so help reverse the initial pyramidal neuron current flow pattern.
Afferents contacting pyramidal neurons from the distal dendrites to the soma are organized as excitatory-inhibitory-excitatory-inhibitory synaptic terminals (Schwartzkroin and McIntyre, 1998). Because the OCSDA changes [especially evident from single-cell recordings (Fig. 6)] during the predominant DC change of SD follow this current flow pattern of spontaneous and evoked synaptic activity (Buzsáki and Traub, 1998), their genesis may be related to the latter physiological means of pyramidal neuron activation. With SD, however, the volume and degree of synchronously activated dendrites and adjacent neural tissue would be greater. This latter dendritic area of tissue activation might be the nidus of activated neural tissue generating a self-sustaining reaction-diffusion process (Martins-Ferreira et al., 2000), recognized as the second phase of the phenomenon (Somjen, 2001).
Conclusions
Retrograde signaling from postsynaptic neurons is increasingly recognized as an important associative signaling mechanism that vitalizes synaptic activity, including that involving learning and memory (Antonov et al., 2003), which can be protective against brain injury (Kraig et al., 2004). Accordingly, study of principal neuron depolarization current flow and related retrograde signaling processes may not only be key to further deciphering the mechanism of SD but also the mechanisms by which SD induces neuroprotection (Kraig and Kunkler, 2002).
Footnotes
This work was supported by National Institute of Neurological Disorders and Stroke Grants NS-19108 and NS-045923 (R.P.K.) and NS-34115 (C.N.), an American Heart Association Scientist Development grant (P.E.K.), an American Heart Association Bugher Award (R.P.K.), and The University of Chicago Brain Research Foundation. Marcia P. Kraig assisted in the preparation and maintenance of the hippocampal organotypic cultures.
Correspondence should be addressed to Richard P. Kraig, Department of Neurology, MC2030, The University of Chicago, 5841 South Maryland Avenue, Chicago, IL 60637. E-mail: rkraig@neurology.bsd.uchicago.edu.
Copyright © 2005 Society for Neuroscience 0270-6474/05/253952-10$15.00/0
References
- Antic S, Major G, Zecevic D (1999) Fast optical recordings of membrane potential changes from dendrites of pyramidal neurons. J Neurophysiol 82: 1615-1621. [DOI] [PubMed] [Google Scholar]
- Antonov I, Antonova I, Kandel ER, Hawkins RD (2003) Activity-dependent presynaptic facilitation and Hebbian LTP are both required and interact during classical conditioning in Aplysia Neuron 37: 135-147. [DOI] [PubMed] [Google Scholar]
- Bahr BA, Kessler M, Rivera S, Vanderklish PW, Hall RA, Mutneja MS, Gall C, Hoffman KB (1995) Stable maintenance of glutamate receptors and other synaptic components in long-term hippocampal slices. Hippocampus 5: 425-439. [DOI] [PubMed] [Google Scholar]
- Benardo LS (1993) GABAA receptor-mediated mechanisms contribute to frequency-dependent depression of IPSPs in the hippocampus. Brain Res 607: 81-88. [DOI] [PubMed] [Google Scholar]
- Bernard C, Anderson A, Becker A, Poolos NP, Beck H, Johnston D (2004) Acquired dendritic channelopathy in temporal lobe epilepsy. Science 23: 532-535. [DOI] [PubMed] [Google Scholar]
- Buzsáki G, Traub RD (1998) Physiological basis of EEG activity. In: Epilepsy: a comprehensive textbook, Vol 1 (Engel Jr J, Pedley TA, eds), pp 819-830. Philadelphia: Lippincott-Raven. [Google Scholar]
- Caggiano AO, Kraig RP (1996) Eicosanoids and nitric oxide influence reactive gliosis from spreading depression in microglia but not astrocytes. J Comp Neurol 369: 93-108. [DOI] [PMC free article] [PubMed] [Google Scholar]
- Caggiano AO, Kraig RP (1998) Neuronal nitric oxide synthase expression is induced in neocortical astrocytes after spreading depression. J Cereb Blood Flow Met 18: 75-87. [DOI] [PMC free article] [PubMed] [Google Scholar]
- Caggiano AO, Breder CD, Kraig RP (1996) Long-term elevation of cyclooxygenase-2 but not lipoxygenase, in regions synaptically distant from spreading depression. J Comp Neurol 376: 447-462. [DOI] [PMC free article] [PubMed] [Google Scholar]
- Cohen I, Navarro V, Clemenceau S, Baulac M, Miles R (2002) On the origin of interictal activity in human temporal lobe epilepsy in vitro. Science 298: 1418-1421. [DOI] [PubMed] [Google Scholar]
- Colbert CM (2001) Back-propagating action potentials in pyramidal neurons: a putative signaling mechanism for the induction of Hebbian synaptic plasticity. Restor Neurol Neurosci 19: 199-211. [PubMed] [Google Scholar]
- Connors BW (1998) Neocortical anatomy and physiology. In: Epilepsy: a comprehensive textbook, Vol 1 (Engel Jr J, Pedley TA, eds), pp 307-321. Philadelphia: Lippincott-Raven. [Google Scholar]
- Contreras D, Llinás R (2001) Voltage-sensitive dye imaging of neocortical spatiotemporal dynamics to afferent activation frequency. J Neurosci 21: 9403-9413. [DOI] [PMC free article] [PubMed] [Google Scholar]
- Cossart R, Dinocourt C, Hirsch JC, Merchan-Perz A, DeFelipe J, Ben-Ari Y, Esclapez M, Bernard C (2001) Dendritic but not somatic GABAergic inhibition is decreased in experimental epilepsy. Nat Neurosci 4: 52-62. [DOI] [PubMed] [Google Scholar]
- Debanne D, Guerineau NC, Gähwiler BH, Thompson SM (1995) Physiology and pharmacology of unitary synaptic connections between pairs of cells in areas CA3 and CA1 of rat hippocampal slice cultures. J Neurophysiol 73: 1282-1294. [DOI] [PubMed] [Google Scholar]
- Dirnagl U, Simon RP, Hallenbeck JM (2003) Ischemic tolerance and endogenous neuroprotection. Trends Neurosci 26: 248-254. [DOI] [PubMed] [Google Scholar]
- Freeman JA, Nicholson C (1975) Experimental optimization of current source-density technique for anuran cerebellum. J Neurophysiol 38: 369-382. [DOI] [PubMed] [Google Scholar]
- Grinvald A, Lieke EE, Frostig RD, Hildesheim R (1994) Cortical point-spread function and long-range lateral interactions revealed by real-time optical imaging of macaque monkey primary visual cortex. J Neurosci 14: 2545-2568. [DOI] [PMC free article] [PubMed] [Google Scholar]
- Gutierrez R, Heinemann U (1999) Synaptic reorganization in explanted cultures of rat hippocampus. Brain Res 815: 304-316. [DOI] [PubMed] [Google Scholar]
- Harris KM, Jensen FE, Tsao B (1992) Three-dimensional structure of dendritic spines and synapses in rat hippocampus (CA1) at postnatal day 15 and adult ages: implications for the maturation of synaptic physiology and long-term potentiation. J Neurosci 12: 2685-2705. [DOI] [PMC free article] [PubMed] [Google Scholar]
- Herreras O, Somjen GG (1993) Analysis of potential shifts associated with recurrent spreading depression and prolonged unstable SD induced by microdialysis of elevated K+ in hippocampus of anesthetized rats. Brain Res 610: 283-294. [DOI] [PubMed] [Google Scholar]
- Hulse RE, Kunkler PE, Fedynyshyn JP, Kraig RP (2004) Optimization of multiplexed bead-based cytokine immunoassays for rat serum and brain tissue. J Neurosci Methods 136: 87-98. [DOI] [PMC free article] [PubMed] [Google Scholar]
- Kager H, Wadman WJ, Somjen GG (2000) Simulated seizures and spreading depression in a neuron model incorporating interstitial space and ion concentrations. J Neurophysiol 84: 489-537. [DOI] [PubMed] [Google Scholar]
- Kandel E (2000) Cellular mechanisms of learning and the biological basis of individuality. In: The new cognitive neurosciences, Ed 2 (Gazzaniga M, ed), pp 121-158. London: MIT.
- Kraig RP, Kunkler PE (2002) Spreading depression—a teleologic means for self-protection from brain ischemia. In: Cerebrovascular disease, 22nd Princeton Research Conference (Chan P, ed), pp 142-158. New York: Cambridge UP.
- Kraig RP, Nicholson C (1978) Extracellular ionic variations during spreading depression. Neuroscience 3: 1045-1059. [DOI] [PubMed] [Google Scholar]
- Kraig RP, Hulse RE, Kunkler PE, Nicholson C (1999) Optical current source densities with spreading depression in hippocampal organ cultures. Soc Neurosci Abstr 25: 841.4. [Google Scholar]
- Kraig RP, Hulse RE, Kunkler PE, Nicholson C (2000) Optical current source density analyses show that chloride flow contributes to the somatic current source from hippocampal pyramidal cells during spreading depression. Ann Neurol 58: 445. [Google Scholar]
- Kraig RP, Hulse RE, Kunkler PE, Nakajima A, Tang Y (2004) Increased learning and diurnal corticosterone changes may trigger environmental enrichment (EE)-based neuroprotection (NP). Soc Neurosci Abstr 30: 681.16. [Google Scholar]
- Kunkler PE, Kraig RP (1997) Reactive astrocytosis from excitotoxic injury in hippocampal organ culture parallels that seen in vivo. J Cereb Blood Flow Metab 17: 26-43. [DOI] [PMC free article] [PubMed] [Google Scholar]
- Kunkler PE, Kraig RP (1998a) Calcium waves precede electrophysiological changes of spreading depression in hippocampal organ cultures. J Neurosci 18: 3416-3425. [DOI] [PMC free article] [PubMed] [Google Scholar]
- Kunkler PE, Kraig RP (1998b) Axon terminals may be a current flow locus of spreading depression. Soc Neurosci Abstr 24: 807.15. [Google Scholar]
- Kunkler PE, Kraig RP (2003) Hippocampal spreading depression bilaterally activates the caudal trigeminal nucleus in rodents. Hippocampus 13: 835-844. [DOI] [PMC free article] [PubMed] [Google Scholar]
- Kunkler PE, Kraig RP (2004) P/Q Ca2+ channel blockade stops spreading depression and related pyramidal neuronal Ca2+ rise in hippocampal organ culture. Hippocampus 14: 356-367. [DOI] [PMC free article] [PubMed] [Google Scholar]
- Kunkler PE, Hulse RE, Kraig RP (2004) Multiplexed cytokine protein expression profiles from spreading depression in hippocampal organotypic cultures. J Cereb Blood Flow Metab 24: 826-839. [DOI] [PMC free article] [PubMed] [Google Scholar]
- Lanczos C (1956) Applied analysis. Englewood Cliffs, NJ: Prentice Hall.
- Lauritzen MC, Kraig RP (2005) Spreading depression and migraine. In: The headaches, Ed 3 (Olesen J, Goadsby P, Ramadan N, Tfelt-Hansen A, Welch KMA, eds). Philadelphia: Lippincott, in press.
- Leão AAP (1951) The slow voltage variation of cortical spreading depression of activity. Electroencephalogr Clin Neurophysiol 3: 315-321. [DOI] [PubMed] [Google Scholar]
- Lorente de Nó R (1947) A study of nerve physiology. Studies from the Rockefeller Institute, Vol 132, Chap 16. New York: Rockefeller Institute for Medical Research. [PubMed] [Google Scholar]
- Magee JC, Johnston D (1997) A synaptically controlled, associative signal for Hebbian plasticity in hippocampal neurons. Science 275: 209-212. [DOI] [PubMed] [Google Scholar]
- Markram H, Lübke J, Frotscher M, Sakmann B (1997) Regulation of synaptic efficacy by coincidence of postsynaptic APs and EPSPs. Science 297: 213-215. [DOI] [PubMed] [Google Scholar]
- Marrannes R, Willems R, De Prins E, Wauuquier A (1988) Evidence for a role of N-methyl-d-aspartate (NMDA) receptor in cortical spreading depression in the rat. Brain Res 457: 226-240. [DOI] [PubMed] [Google Scholar]
- Martins-Ferreira H, Nedergaard M, Nicholson C (2000) Perspectives on spreading depression. Brain Res Rev 32: 215-234. [DOI] [PubMed] [Google Scholar]
- McKinney RA, Capogna M, Dürr R, Gähwiler BH, Thompson SM (1999) Miniature synaptic events maintain dendritic spines via AMPA receptor activation. Nat Neurosci 2: 44-49. [DOI] [PubMed] [Google Scholar]
- Milner PM (1958) Note on possible correspondence between the scotomas of migraine and spreading depression of Leão. Electroencephalogr Clin Neurophysiol Suppl 10: 705. [DOI] [PubMed] [Google Scholar]
- Morishita W, Alger BE (2001) Direct depolarization and antidromic action potentials transiently suppress dendritic IPSPs in hippocampal CA1 pyramidal cells. J Neurophysiol 85: 480-484. [DOI] [PubMed] [Google Scholar]
- Moskowitz M, Nozaki K, Kraig RP (1993) Neocortical spreading depression provokes the expression of c-fos protein-like immunoreactivity within trigeminal nucleus caudalis via trigeminovascular mechanisms. J Neurosci 13: 1167-1177. [DOI] [PMC free article] [PubMed] [Google Scholar]
- Muller D, Buchs P-A, Stoppini L (1993) Time course of synaptic development in hippocampal organotypic cultures. Dev Brain Res 71: 93-100. [DOI] [PubMed] [Google Scholar]
- Nedergaard M, Hansen AJ (1988) Spreading depression is not associated with neuronal injury in the normal brain. Brain Res 449: 395-398. [DOI] [PubMed] [Google Scholar]
- Nicholson C, Freeman JA (1975) Theory of current source-density analysis and determination of conductivity tensor for anuran cerebellum. J Neurophysiol 38: 356-368. [DOI] [PubMed] [Google Scholar]
- Nicholson C, Kraig RP (1981) The behavior of extracellular ions during spreading depression. In: The application of ion-selective microelectrodes (Zeuthen, T, ed), pp 217-238. New York: Elsevier/North-Holland.
- Nixdorf-Bergweiler BE, Albrecht D, Heinemann U (1994) Developmental changes in the number, size and orientation of GFAP-positive cells in the CA1 region of rat hippocampus. Glia 12: 180-195. [DOI] [PubMed] [Google Scholar]
- Plenz D, Aertsen A (1993) Current source density profiles of optical recording maps: a new approach to the analysis of spatio-temporal neural activity patterns. Eur J Neurosci 5: 437-448. [DOI] [PubMed] [Google Scholar]
- Poncer JC, McKinney RA, Gähwiler BH, Thompson SM (1997) Either N- or P-type calcium channels mediate GABA release at distinct hippocampal inhibitory synapses. Neuron 18: 463-472. [DOI] [PubMed] [Google Scholar]
- Rall W (1962) Electrophysiology of a dendritic neuron model. Biophys J 2: 145-167. [DOI] [PMC free article] [PubMed] [Google Scholar]
- Schmitt M, Kunkler PE, Aptowicz CO, Kraig RP (2002) Seizures and neuronal loss need not be expected responses of maturing hippocampal organ cultures. Soc Neurosci Abstr 28: 95.6. [Google Scholar]
- Schwartzkroin PA, McIntyre DC (1998) Limbic anatomy and physiology. In: Epilepsy: a comprehensive textbook, Vol 1 (Engel Jr J, Pedley TA, eds), pp 323-340. Philadelphia: Lippincott-Raven. [Google Scholar]
- Snow RW, Taylor CP, Dudek FE (1983) Electrophysiological and optical changes in slices of rat hippocampus during spreading depression. J Neurophysiol 50: 561-572. [DOI] [PubMed] [Google Scholar]
- Soltesz I, Smetters DK, Mody I (1995) Tonic inhibition originates from synapses close to the soma. Neuron 14: 1273-1283. [DOI] [PubMed] [Google Scholar]
- Somjen GG (2001) Mechanisms of spreading depression and hypoxic spreading depression-like depolarization. Physiol Rev 81: 1065-1096. [DOI] [PubMed] [Google Scholar]
- Stoppini L, Buchs PA, Muller D (1991) A simple method for organotypic cultures of the nervous system. J Neurosci Methods 37: 173-182. [DOI] [PubMed] [Google Scholar]
- Streit P, Thompson SM, Gähwiler BH (1989) Anatomical and physiological properties of GABAergic neurotransmission in organotypic slice cultures of rat hippocampus. Eur J Neurosci 1: 603-615. [DOI] [PubMed] [Google Scholar]
- Tao L, Masri D, Hrabĕtová S, Nicholson C (2002) Light scattering in rat neocortical slices differs during spreading depression and ischemia. Brain Res 952: 290-300. [DOI] [PubMed] [Google Scholar]
- Taylor CP, Dudek FE (1984) Excitation of hippocampal pyramidal cells by an electrical field effect. J Neurophysiol 52: 126-142. [DOI] [PubMed] [Google Scholar]
- Thompson SM, Deisz RA, Prince DA (1988) Relative contributions of passive equilibrium and active transport to the distribution of chloride in mammalian cortical neurons. J Neurophysiol 60: 105-124. [DOI] [PubMed] [Google Scholar]
- Traub RD, Jefferys JGR (1998) Epilepsy in vitro: electrophysiology and computer modeling. In: Epilepsy: a comprehensive textbook, Vol 1 (Engel Jr J, Pedley TA, eds), pp 405-418. Philadelphia: Lippincott-Raven. [Google Scholar]
- Turner DA (1984) Segmental cable evaluation of somatic transients in hippocampal neurons (CA1, CA3, and dentate). Biophys J 46: 73-84. [DOI] [PMC free article] [PubMed] [Google Scholar]
- Világi I, Klapka N, Luhman HJ (2001) Optical recording of spreading depression in rat neocortical slices. Brain Res 898: 288-296. [DOI] [PubMed] [Google Scholar]
- Voronin LL, Altinbaev S, Bayazitov IT, Gasparini S, Kasyanov AV, Saviane C, Savtchenko L, Cherubini E (2004) Postsynaptic depolarization enhances transmitter release and causes the appearance of responses at “silent” synapses in rat hippocampus. Neuroscience 126: 45-59. [DOI] [PubMed] [Google Scholar]
- Wadman WJ, Juta AJA, Kamphuis W, Somjen GG (1992) Current source density of sustained potential shifts associated with electrographic seizures and with spreading depression in rat hippocampus. Brain Res 570: 85-91. [DOI] [PubMed] [Google Scholar]
- Wozny C, Kivi A, Lehmann TN, Dehnicke C, Heinemann U, Behr J (2003) Comment on “On the origin of interictal activity in human temporal lobe epilepsy in vitro.” Science 301: 463. [DOI] [PubMed] [Google Scholar]
- Wu K, Canning KJ, Leung LS (1998) Functional interconnections between CA3 and the dentate gyrus revealed by current source density analysis. Hippocampus 8: 217-230. [DOI] [PubMed] [Google Scholar]
- Zimmer J, Gähwiler BH (1984) Cellular and connective organization of slice cultures of the rat hippocampus and fascia dentata. J Comp Neurol 228: 432-446. [DOI] [PubMed] [Google Scholar]