Abstract
Selective subvolume boosting can theoretically improve tumour control probability while maintaining normal tissue complication probabilities similar to those of uniform dose distributions. In this work the abilities of intensity modulated x-ray therapy (IMXT) and intensity modulated proton therapy (IMPT) to deliver boosts to multiple subvolumes of varying size and proximities are compared in a thorough phantom study. IMXT plans were created using the step-and-shoot (IMXT-SAS) and helical tomotherapy (IMXT-HT) methods. IMPT plans were created with the spot scanning (IMPT-SS) and distal gradient tracking (IMPT-DGT) methods. IMPT-DGT is a generalization of the distal edge tracking method designed to reduce the number of proton beam spots required to deliver non-uniform dose distributions relative to IMPT-SS. The IMPT methods were delivered over both 180° and 360° arcs. The IMXT-SAS and IMPT-SS methods least and most optimally satisfied the non-uniform dose prescriptions, respectively. The IMPT delivery methods reduced normal tissue integral dose by a factor of about two relative to the IMXT delivery methods, regardless of the delivery arc. The IMPT-DGT method reduced the number of proton beam spots by a factor of about three relative to the IMPT-SS method.
Keywords: Intensity modulated radiation therapy, intensity modulated proton therapy, intensity modulated x-ray therapy, selective subvolume boosting, distal gradient tracking
1. Introduction
Selective subvolume boosting in tumours can theoretically increase tumour control probability (TCP) while reducing complications to normal tissues that would occur with a boost to the entire tumour region (Brahme and Ågren 1987, Goitein et al 1995, Tomé and Fowler 2000). Selective subvolume boosting would be especially beneficial for cases in which information on clonogen density, tumour hypoxia, proliferation, and/or radiosensitivity is available (Chao et al 2001, Deasy 2001, Popple et al 2002, Xing et al 2002, Tomé and Fowler 2003, Yang and Xing 2005). Functional imaging methods such as positron emission tomography (PET) and magnetic resonance spectroscopic imaging (MRSI) could be the key to obtaining such biological information, and the resulting non-uniform dose prescriptions could then be delivered with intensity modulated radiation therapy (Bentzen 2005).
According to Yang and Xing (2005), establishment of such biological information based dose delivery paradigms requires that the biological properties in the tumour and critical structures can be determined, that a dose prescription can then be based on those biological properties, and that inverse planning can be used to generate the required dose distribution. Assuming that sufficient progress toward the determination of the biological properties and dose prescription is made in the future, one principle remains clear: the delivery of non-uniform planned dose distributions will require intensity modulated radiation therapy (IMRT). Methods for determining dose prescriptions by analytically maximizing TCP for a given integral tumour dose have been found for the case where the distributions of radiosensitivity and tumour proliferation are known (Brahme and Ågren 1987, Ebert and Hoban 1996, Levin-Plotnik and Hamilton 2004, Bentzen 2005, Yang and Xing 2005). However, justification of the TCP models on which the dose distributions are based and the methods for obtaining the biological information still remains a complex problem. Many biology-based treatment planning studies have been conducted in the last several years, and, due to lack of clinical data, the authors have focused on the inverse treatment planning problem under the assumption that, at some point, the problem of obtaining biological data and basing prescriptions on such data, will be better understood. Such studies include the optimization of intensity modulated x-ray therapy (IMXT) treatment plans based on hypothetical biological knowledge (Yang and Xing 2005, Kim and Tomé 2006), biological knowledge obtained from PET images with Cu-ATSM as the tracer (Chao et al 2001), the FDG tracer (Mutic et al 2003, Das et al 2004, Nestle et al 2006, Vanderstraeten et al 2006), magnetic resonance spectoscopic imaging (MRSI) (Chen et al 2007), and dynamic contrast enhanced magnetic resonance imaging (DCEMRI) (Malinen et al 2006). In all of these studies it is shown theoretically that the delivery of biology-based non-uniform dose distributions provides an advantage over the corresponding uniform dose distributions, but, as all of the studies were done assuming IMXT as the delivery method, it is unclear whether or not intensity modulated proton therapy (IMPT) would produce even better dose distributions. It is possible that IMPT could deliver dose distributions that better satisfy the treatment objectives inside and near the boost regions than those delivered with IMXT. Such benefits would be in addition to those already shown for cases of uniform dose prescriptions: IMPT can lower integral dose to normal tissues by around a factor of two relative to IMXT and completely spare sensitive structures downstream of the treatment volume (Lomax et al 1999, Lomax et al 2003).
The spatial dose delivery resolution of IMXT has been assessed analytically using the delivery transfer function (DTF) method for both conventional IMXT (Huntzinger et al 2000, Otto et al 2002) and IMXT delivered with helical tomotherapy (IMXT-HT) (Kissick et al 2007), and, for the case of rotational therapy, analytical solutions exist for the delivery of arbitrary dose distributions, assuming that simple Gaussian kernels can be used to describe photon and electron scatter (Oelfke and Bortfeld 1999, Braunstein and Levine 2000). Although an analytical solution exists for the delivery of radially-symmetric dose distributions with rotational IMPT therapy that neglects the lateral penumbra of the proton beams (Oelfke and Bortfeld 2000), the authors are unaware of a DTF analysis method for proton beams. This is likely because proton beams have a finite range in the target, complicating the DTF analysis with an additional degree of freedom.
In this paper the abilities of IMPT vs. IMXT to deliver non-uniform dose prescriptions based on the concept of selective subvolume boosting are compared. To this end, a less elegant approach than DTF analysis is applied, and IMXT and IMPT are compared with an thorough phantom treatment planning study. IMXT and IMPT treatment plans are compared both qualitatively and quantitatively with dose distributions, cumulative dose volume histograms (DVHs), effective dose volume histograms (EDVHs), and locally calculated objective function values. The reduction in integral dose to normal tissue for IMPT plans vs. IMXT plans is quantified, and the ability of IMPT to deliver non-uniform dose distributions from a limited number of delivery angles that cover only 180° is demonstrated.
2. Materials and Methods
2.1. Phantom
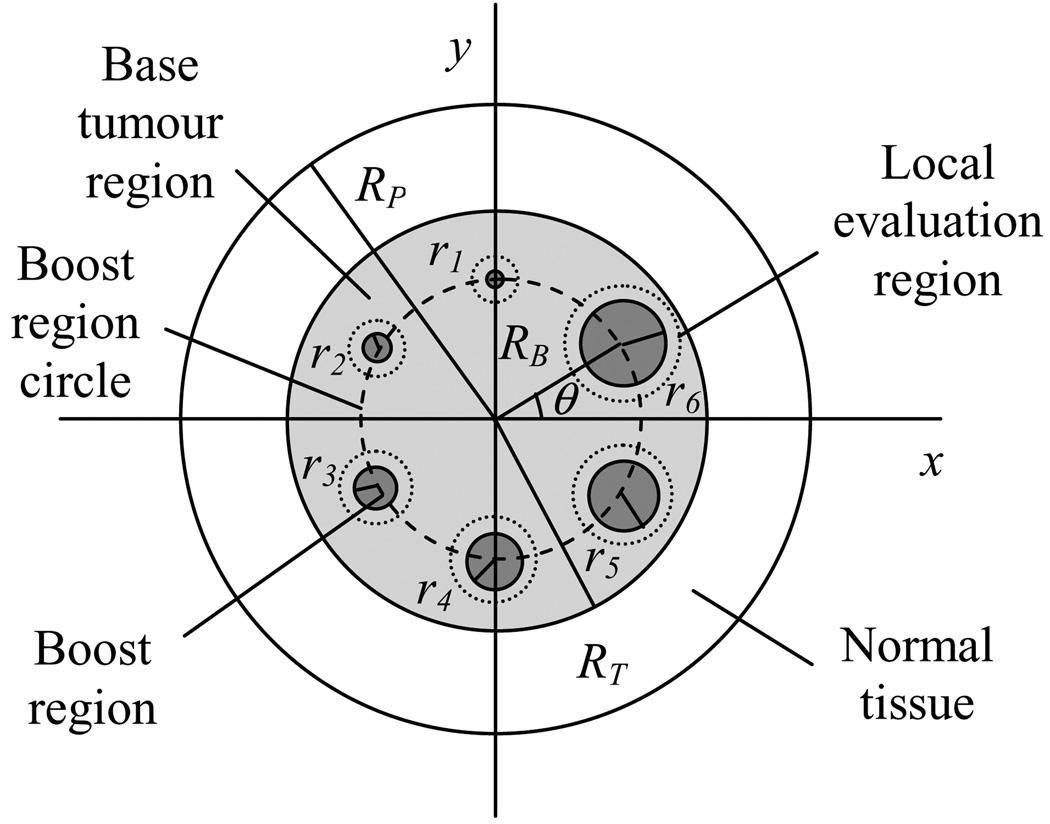
An electronic treatment planning phantom was designed to provide a consistent, controlled, and simple treatment planning situation in which the same dose prescriptions could be planned and compared for both IMXT and IMPT. The water-equivalent phantom was a cylinder with a radius of Rp, and a length of 20 cm. The phantom contained a cylindrical base tumour region of 6 cm radius and length of 10 cm, which was centred in the cylinder. An axial cross section through the phantom centre is shown in figure 1. The base tumour region contained six cylindrical boost regions with lengths of 5 cm and radii that increased linearly from 1.5 mm to 10 mm. The base tumour region corresponds to the clinical target volume (CTV). The boost regions either represent avoidance regions (negative boost) or gross tumour volume (GTV) regions in which an extra dose is to be delivered concomitantly. The centre of mass of each boost region lay on a boost region circle of radius Rb, which was centred in the phantom. Each boost region was separated from its neighbour by a 60° arc on the boost region circle. The voxel sizes in the phantom were 1×1×2 mm2. The volume between the base tumour region and the phantom boundary was considered normal tissue (NT).
Figure 1.
Axial cross section through the centre of mass of the cylindrical phantom. RP is the phantom radius, RT is the radius of the base tumour region (6 cm), and RB is the radius of the boost region circle, on which the centres of all boost regions lay. The radius of boost region m is rm (m=1,…6), which increases in size linearly between 1.5 mm and 10 mm. Each boost region is contained by a local evaluation region, which is defined as a disc of radius 4 mm greater than that of the corresponding boost region.
The parameters of the phantom were varied to simulate a large number of delivery scenarios. The Rp parameter was adjusted to four different values, Rb to three different values, and the relative boost region doses to ten different values. A listing of the parameters which define 112 different phantom variations is shown in table 1. The relative biological effectiveness for the proton beams was assumed to be 1.1, relative to the x-ray beams, applied uniformly to all proton dose distributions (Gueulette et al 1996). All boost region dose prescriptions were defined in terms of a percentage of the prescribed base tumour region dose equivalent, which was assumed to be 100%. Since one of the ten boost doses was 0%, this boost corresponded to the case of a uniform dose delivery to the entire tumour region.
Table 1.
Phantom parameters, which define 112 different phantom variations: (4 phantom radii ×3 boost region circles × 9 non-zero boosts) + (4 phantom radii × 1 zero boost).
| Boost region radii | Phantom radii, Rp (cm) |
Boost region circle radii, Rb (cm) |
Boost values (%) |
|---|---|---|---|
| Six equally spaced radii from 0.15 to 1.0 cm | 8, 10, 12, 15 | 2, 3, 4 | −100, −50, −20, −10, 0, 10, 20, 50, 100, 200 |
For each variant of the phantom, optimized treatment plans were created for step and shoot IMRT (IMXT-SAS), helical tomotherapy (IMXT-HT), distal gradient tracking delivered over a full 360° arc (IMPT-DGTfull) and over a 180° arc (IMPT-DGThalf), and intensity modulated spot scanning delivered over a full 360° arc (IMXT-SSfull) and over a 180° arc (IMPT-SShalf). The IMXT and IMPT delivery methods are explained in more detail in section 2.2 and section 2.3, respectively. Only the central slice of the phantom, shown in figure 1, was used in the optimization process. As such, the resulting dose distributions represent best-case scenarios for the dose achievable on the central slice, due to elimination of competition for satisfying prescription parameters on the nearby slices. Additional details of the optimization process are explained in section 2.4.
The boost doses were chosen to represent an extensive picture of the behaviour of IMXT and IMPT for selective subvolume boosting. To this end, extreme boost doses ranging from −100% to +200% were chosen, where a −100% boost to a region represented an attempt for total avoidance of that region. The positive boosts of up to 100% are realistic in clinical practice, as doses to the metastases that are twice the dose prescribed to the whole brain have been suggested for whole brain radiation therapy with a simultaneous integrated boost to the metastases (Bauman et al 2007).
2.2. IMXT delivery methods
2.2.1. Step and Shoot IMRT
With IMXT-SAS, intensity modulated radiation fields are delivered by superposing multiple 2-D subfields, each formed by a multileaf collimator (MLC), and possibly having different intensities, such that the sum of the intensity maps produced by all of the subfields creates the desired 2-D intensity map for each gantry angle (Bortfeld et al 1994, Webb 1998, Shepard et al 2002). Since the optimization in the current study was only performed on the central slice, it was assumed that only a single MLC leaf pair was used for the delivery of the radiation, thus an intensity profile (fan beam) was delivered rather than an intensity map (cone beam) at each delivery angle. The fan beam was assumed to be divided into 48 beamlets, each of which represented the dose distribution resulting from an aperture with an area of 5×5 mm2 in the beam's eye view (BEV) at isocentre. The source axis distance (SAD) was assumed to be 100 cm. It was assumed that each beamlet could be delivered with an arbitrary intensity. A total of 9 beam directions, equally spaced over 360°, were used for the SAS treatment plans. Delivery parameters for SAS and the other delivery methods are listed in table 2.
Table 2.
Delivery parameters for all of the six delivery methods.
| Delivery parameter | Delivery Method | |||||
|---|---|---|---|---|---|---|
| IMXT- SAS |
IMXT- HT |
IMPT- DGThalf |
IMPT- DGTfull |
IMPT- SShalf |
IMPT- SSfull |
|
| Beamlet/proton spot lateral width/FWHM at isocentre | 5 mm | 6.25 mm | 8 mm FWHM | 8 mm FWHM | 8 mm FWHM | 8 mm FWHM |
| Number of beam angles | 9 | 51 | 25 | 51 | 5 | 9 |
| Arc covered by beams (starting at 0°) | 360° | 360° | 180° | 360° | 180° | 360° |
| Total number of beamlets/beam spots | 234 | 1020 | 1319 | 2656 | 4643 | 8366 |
2.2.2. Helical tomotherapy
With IMXT-HT delivered from the Hi-Art™ unit (TomoTherapy Inc., Madison, WI), radiation is delivered from a 6 MV linac mounted on a CT-style ring gantry that rotates about a translating patient couch (Mackie et al 1993, Mackie 2006). Radiation is delivered with a fan beam that is modulated by a binary MLC with 64 leaves, each with a projection at isocentre of 6.25 mm (Fenwick et al 2004). Although the Hi-Art™ gantry rotates continuously during delivery, each full rotation is discretized into 51 angular increments. The intensity of the radiation exiting a given leaf in the fan beam is modulated by controlling the amount of time that the leaf is open in each angular gantry rotation increment. The maximum deliverable beam intensity is proportional to the gantry rotation period, as a greater period implies a greater amount of time available for the x-ray source to deliver the beam in a given direction. This relationship was neglected in the current study, and therefore it was assumed that the modelled IMXT-HT system could deliver arbitrary intensity profiles. As the optimizations were done only on the central slice, the pitch factor (couch travel distance per gantry rotation) was assumed to be zero, and the total number of rotations unity.
2.2.3. IMXT dose calculations
IMXT beamlets were calculated with a convolution superposition method that used a polyenergetic energy deposition kernel (Hoban et al 1994) derived from monoenergetic kernels (Mackie et al 1988). After each 3-D beamlet calculation, the central slice of the dose distribution the beamlet was extracted and used in the treatment planning process.
2.3. IMPT delivery methods
2.3.1. Intensity modulated spot scanning
The IMPT-SS method entails the magnetic and/or mechanical scanning of a proton beam spot over a 3-D Cartesian grid in the treatment volume, and the beam spot intensities for all of the delivery angles are optimized simultaneously during the treatment planning process. In one implementation at the Paul Scherrer Institute (PSI) in Villingen, Switzerland, the location of the beam spot in depth is controlled in 3-D by the insertion of a series of polyethylene plates in the path of the beam, the beam is then scanned in one dimension of the BEV using a sweeper magnet, and the patient couch is translated in the other dimension of the BEV (Pedroni et al 1995, Pedroni and Enge 1995, Lomax et al 2004). A new system has recently been implemented at PSI which utilizes full 2-D magnetic scanning (Meer et al 2007).
Two beam configurations were used for the SS plans: the IMPT-SSfull configuration used 9 beams equally spaced over 360°, and the IMPT-SShalf configuration used 5 beams with the same angular spacing as IMPT-SSfull, but the beams only extended over a 180° arc. The IMPT-SSfull configuration was limited to 9 beams since it was found that a further increase in the number of beam directions did not result in an improvement in the dose distributions. The IMPT-SShalf configuration was considered in order to assess the ability of IMPT-SS to deliver non-uniform dose distributions using beams spread over a limited arc of 180°. Confining the beam delivery directions to within 180° would have enabled the beams to be delivered through less normal tissue if the tumour was off centre in the patient, thereby lowering integral dose substantially as well as requiring lower energy beams. For the phantoms used in the current study this limited arc capability would not be expected to reduce the integral normal tissue dose by much, as the tumour region was centred in the phantom.
2.3.2. Distal gradient tracking
IMPT-DGT is a generalization of the distal edge tracking method (Deasy et al 1997), and is designed to reduce the number of proton beam spots required for the delivery of non-uniform dose distributions, relative to the IMPT-SS method. If the delivery time per beam spot is the same for both IMPT methods, then ideally the total delivery time relative to IMPT-SS will be reduced for IMPT-DGT by the same factor by which the number of beam spots is reduced.
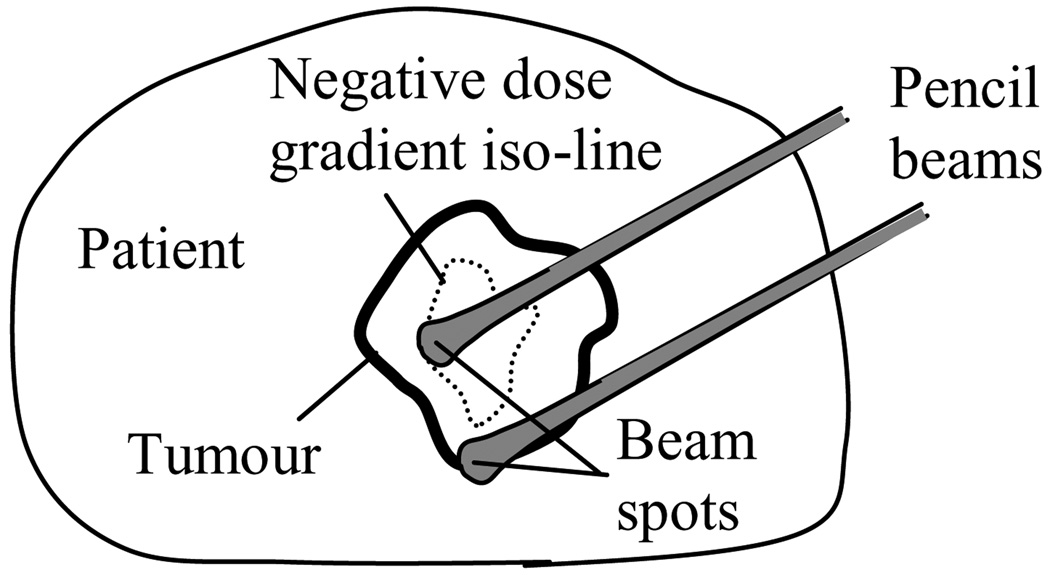
IMPT-DGT entails placing beam spots at the points along the central ray of a given proton beam at points at which one of the following two events occurs: (1) the dose gradient along the central ray drops below a user-defined negative threshold or (2) the dose gradient along the central ray rises above a user defined positive threshold, after event (1) has occurred at least once. This results in the placement of proton beam spots shown in figure 2. The beam spots that are placed due to the occurrence of event (1) are intended to deliver "peaks" in the dose prescription, whereas the spots that are placed due to event (2) are intended to deliver dose to the "valleys" in the dose prescription. If all of the "valleys" were prescribed doses of zero, spots placed due to event (2) would not be required, but, as this is not the case in general, these spots are required in order to deliver non-zero doses in the "valleys". For the case of a uniform dose prescription, beam spots will only be placed on the distal edge of the tumour, as would have been the case for distal edge tracking.
Figure 2.
Distal gradient tracking (DGT) for a non-uniform dose prescription. Proton beam spots are placed at points at which the dose gradient along the central ray drops below a negative threshold or rises above a positive threshold that occurs after a negative threshold or rises above a positive threshold that occurs after a negative threshold.
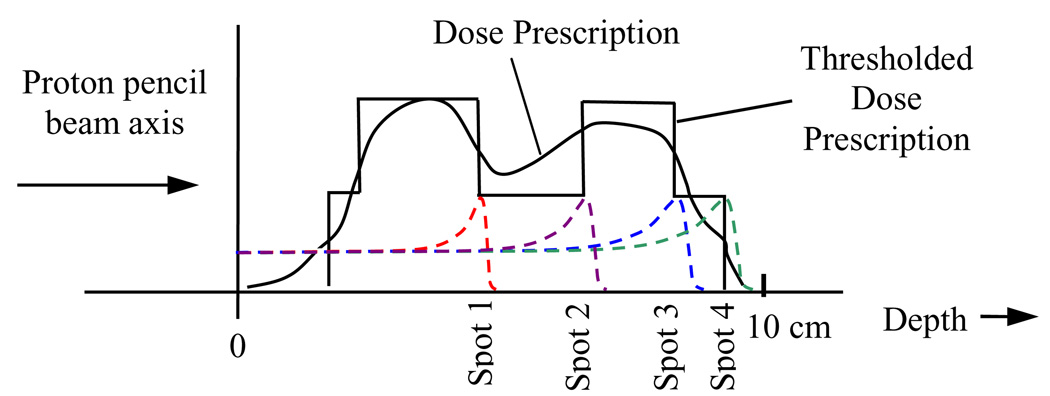
A simple method for defining dose gradient iso-lines is to discretize the non-uniform dose prescription into levels defined by dose thresholding, as shown along the ray of a single pencil beam in figure 3. In figure 3, the dose prescription is thresholded to two levels, and the dose gradient along the central ray will only be non-zero at the points where there is a transition from one thresholded dose level to the next. As a result, only four beam spots are placed in the prescription region. This is lower than the number of spots that would have been placed along the same ray by the IMPT-SS method, which would have required 20 spots along the same ray for a typical 5 mm spot separation in depth (Lomax et al 2004).
Figure 3.
Distal gradient tracking along a single pencil beam axis. In this case the dose prescription is segmented into two prescriptions levels, and proton beam spots are placed at the locations of the negative dose gradients in the thresholded dose prescription, and the positive gradients that occur after spots that were placed on negative gradients.
Although IMPT-DGT requires more beam directions than IMPT-SS to achieve similar non-uniform dose distributions, the determination of the optimal number of beam directions and orientations for both methods is a difficult problem that is not investigated in the current work.
Two beam configurations were used for the IMPT-DGT plans. The IMPT-DGTfull configuration used 51 beams equally spaced over 360°, and the IMPT-DGThalf configuration used 25 beams spaced over 180°. The angular separation between the beams was equal for both configurations.
2.3.3. IMPT dose calculations
The proton pencil beams had a Gaussian lateral full width at half maximum (FWHM) of 8 mm in air at isocentre, were separated by 3.5 mm in the lateral dimension, and 5 mm in the depth dimension for the case of IMPT-SS, as specified in table 2. These are similar to the parameters used for IMPT-SS at PSI (Lomax et al 2004). As only the central slice of the phantom was used in the optimization process, spots were placed on a 2-D matrix rather than throughout the entire 3-D volume. It was assumed that arbitrary proton beam spot intensities were deliverable.
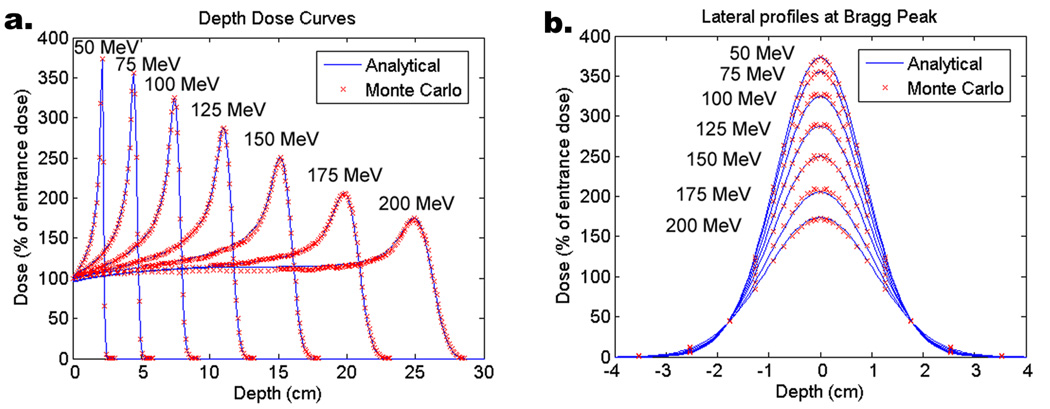
Proton beam spot calculations were done using a 1-D scaled pencil beam model (Hong et al 1996). Pristine Bragg peaks, which are proton depth dose curves under the condition of full lateral charged particle equilibrium, were calculated using the MCNPX Monte Carlo code and used in the analytical dose calculations. A comparison of the analytically-calculated to MCNPX-calculated dose distributions in water in figure 4 shows excellent agreement in both the depth and lateral dimensions of the proton beams. The analytical dose calculation curves in figure 4 were normalized such that the entrance dose was 100%.
Figure 4.
Proton dose calculation model verification in a water phantom with beams of Gaussian FWHM of 2 cm at the phantom surface. a. Depth dose plots for six different beam energies. b. Lateral dose profiles at the Bragg peak for the same six proton beam energies.
The effects of a realistic range modulation system on the proton beam spots (Lomax et al 2004) were not accounted for in the dose calculations, as an upper bound on the quality of the IMPT dose distributions was desired. Instead, for a given desired Bragg peak depth, a proton beam spot was calculated under the assumption that the delivery system was capable of producing a perfectly parallel proton beam, with a lateral FWHM of 8 mm at isocenter, and the energy required (within 1 MeV) to reach the desired depth.
2.4. Optimization
The planned dose to the voxel indexed by the integer i can be represented as a weighted sum over a dose transfer matrix, Dij, as follows:
| (1) |
where Dij is the dose per unit intensity delivered to voxel i due to the beamlet or beam spot indexed by j, and wj is the intensity weight for beamlet or proton beam spot j. The vector, wȜ, represents all of the intensity weights, and the value of each of its components must be greater than or equal to zero.
An optimal set of intensity weights was found for each delivery method and treatment plan by using the iterative linear least squares method (Shepard et al 2000) to minimize the following quadratic objective function of the beam intensities:
| (2) |
where is the dose prescribed to the voxel indexed by i, NT and T are subsets of all the voxel indices corresponding to normal tissue and tumour tissue, respectively, MNT and MT are the numbers of voxels corresponding to normal tissue and tumour tissue, respectively, and αNT and αT are importance weighting factors for normal tissue and tumour tissue, respectively. The set of tumor tissue indices, T, is the union of the base tumor region indices with all six of the boost region indices. The αNT/αT ratio was set to 0.01 for all optimizations. For the purpose of objective function evaluations the tissue importance factors were scaled to satisfy the following relationship:
| (3) |
thus E from equation 2 had units of dose (relative to the base tumour dose of 100%) and represented the root mean square deviation of the planned dose distribution from the dose prescription, weighted by the respective normal tissue and tumour tissue importance weighting factors.
2.5. Plan evaluation
Cumulative dose volume histograms (DVHs) for the normal tissue and effective dose volume histograms (EDVHs) for the tumour tissue were used to compare delivery methods. An EDVH is obtained by dividing the planned dose distribution by the prescribed dose distribution, multiplying by 100%, and plotting the DVH of the result (Alber et al 2003). The EDVH is a useful tool for evaluating non-uniform dose distributions, as deviations of the planned dose from the prescribed dose are appear as deviations of the EDVH from a vertical line at a dose of 100%.
Phantom plans were compared with the local objective function, or Eloc, by evaluating equation 2 using only the tumour voxels that lay within a disc of radius equal to the boost region radius plus 4 mm, or local evaluation region, as shown in figure 1. Tissue importance weights were rescaled to satisfy equation 3 for each Eloc calculation, thus ensuring that Eloc represented the root mean square deviation of the dose distribution from the prescription in each local evaluation region.
Dose homogeneity within the base tumour region was assessed by calculating the root mean square of the dose distribution within an origin-centred disc of radius 5 cm, excluding the local evaluation regions. The 5 cm radius disc was defined to be smaller than the 6 cm base tumour region in order to prevent relatively high dose differences near the tumour-normal tissue interface from dominating the root mean square calculation.
3. Results and Discussion
3.1. Dose distributions
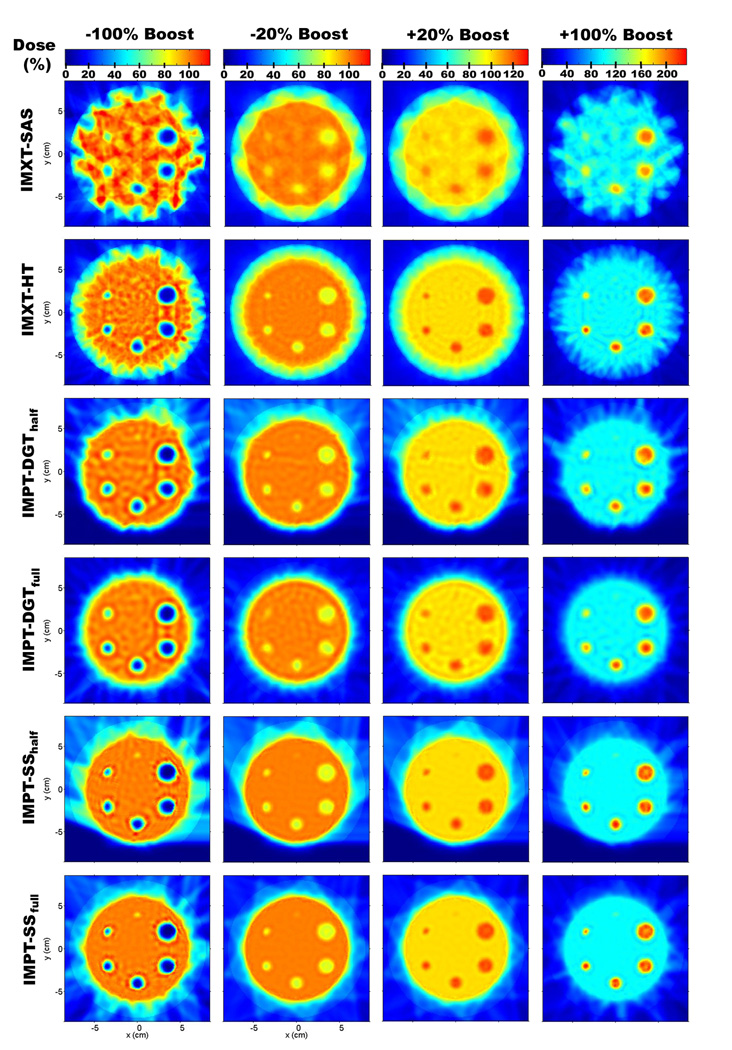
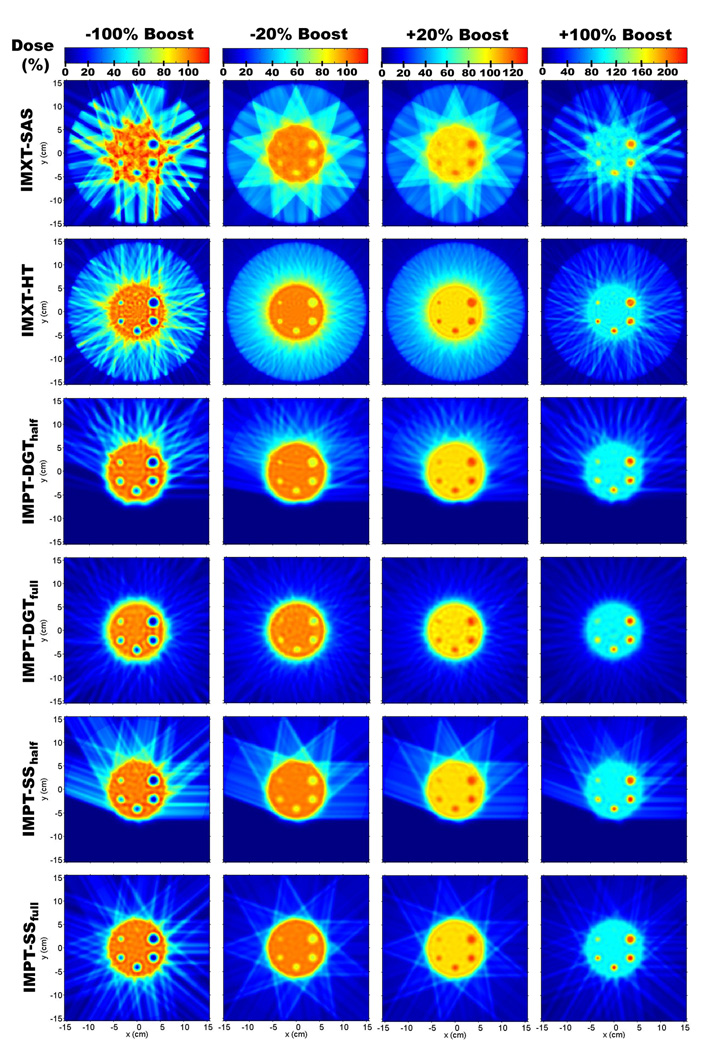
Due to the number of optimizations performed it is not possible to show all of the resulting dose distributions, therefore samplings of 24 of the phantom treatment plans are shown for (Rp, Rb) values of (8 cm, 4 cm) in figure 5, and (15 cm, 4 cm) in figure 6. In each of the figures, dose distributions for four of the boost values are shown: −100%, −20%, 20%, and 100%.
Figure 5.
Dose distributions for a phantom radius of 8 cm and a boost region circle of 4 cm.
Figure 6.
Dose distributions for a phantom radius of 15 cm and a boost region circle of 4 cm.
An obvious difference between the IMXT and IMPT methods is the higher dose delivered to the normal tissue region for the IMXT methods. This well known attribute of IMXT dose distributions is evident in the "crown" of mid range dose surrounding the base tumour region in an annulus with an inner radius of about 6 cm and an outer radius of about 8 cm. The dose uniformity within the base tumour region, excluding the boost regions, was noticeably worse for the IMXT-SAS method 295 than for the other five methods, especially for the −100% and 100% boosts. The dose non-uniformity in the base tumour region will be numerically explored in greater detail in section 3.4.
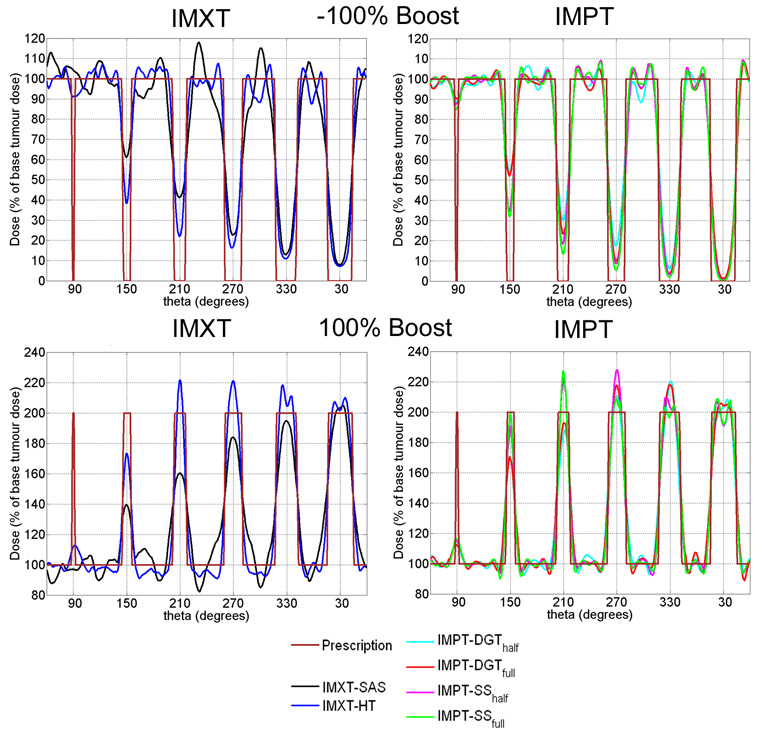
For the −100% and 100% columns in figure 5, a plot of the dose profile along the boost region circle line, or radial dose profile, is shown for each delivery method in figure 7. It is clear from the radial dose profiles in figure 7 that the boost doses for the IMXT-SAS method do not match the prescribed values as well as the other five methods within a given boost region. This is because of competition between achieving the desired boost doses while maintaining dose uniformity within the base tumour region. Any further improvement in the boost region doses would have resulted in poorer dose uniformity in the base tumour region, therefore boost region coverage was compromised. As the boost region size decreased, the ability of all of the methods to deliver dose to the boost regions diminished, especially for the smallest boost region, which was poorly covered by all delivery methods. It is possible that increasing the relative tissue importances for voxels in the boost regions during (Yang and Xing 2004a, Yang and Xing 2004b) or prior to the optimization process would have resulted in better boost region coverage. The use of such methods would likely result in poorer uniformity throughout the base tumour region, and it is likely that dose distributions delivered by IMXT-SAS would always have the least uniform dose distributions in the base tumour region of all of the treatment methods studied. This is due to the limited number of degrees of freedom, reflected in the number of beamlets, available to IMXT-SAS, relative to the other delivery methods.
Figure 7.
Radial dose profiles, defined as dose profiles along the boost region circle, for a phantom radius of 8 cm, boost region circle of 4 cm (dose distributions in the first and last columns of figure 5). The boost region circle passes through the centre of mass of each of the boost regions. The theta axes start at 60° in order to show the boost region radii in ascending order. Radial dose profiles for the −100% boost are shown in the top row, and profiles for the 100% boost are shown in the bottom row.
None of the delivery methods were able to resolve the smallest resolution boost region, which had a radius of 1.5 mm and was located at the 90° in the phantom. This was expected since the resolution of the beamlets or beam spots in any method was larger than this boost region, but it is unlikely that using finer resolution beams would have resulted in any improvement due to the lateral range of electrons for IMXT and the lateral spread of protons for IMPT.
3.2. Dose volume histograms and effective dose volume histograms
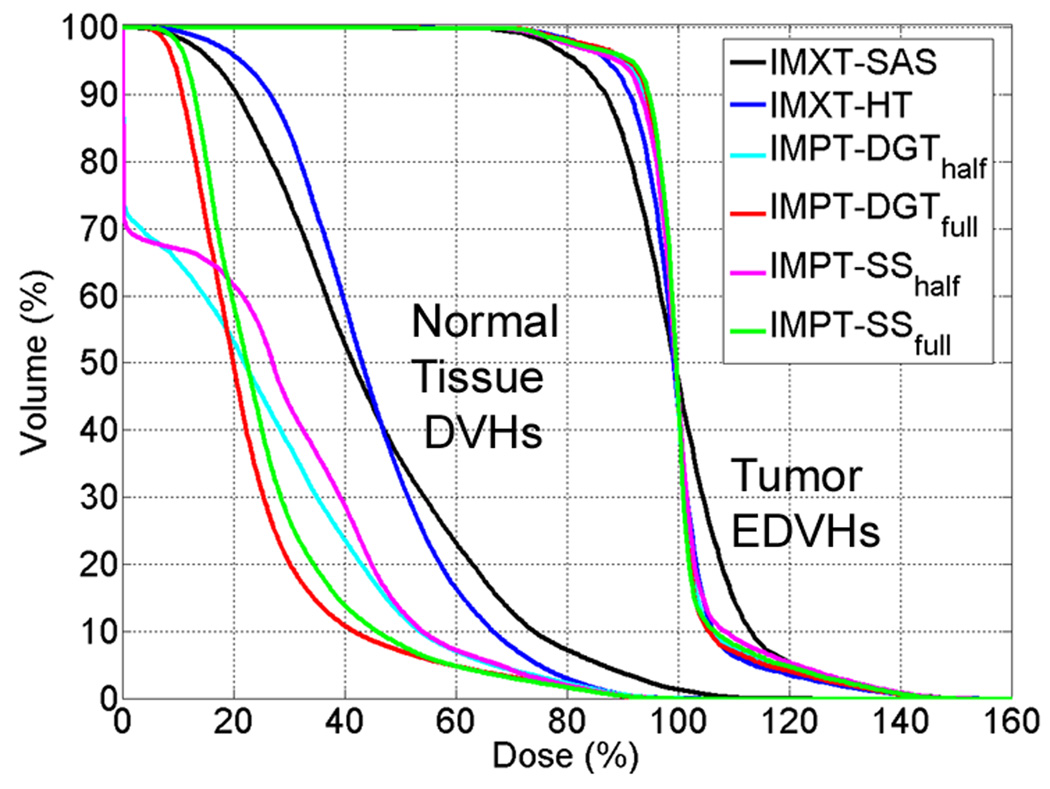
DVHs for the normal tissue and EDVHs for the tumour tissue are shown for a representative case, with (Rp,Rb) values of (15 cm, 4 cm), and a boost dose of 100%, in figure 8. The EDVHs in figure 8 demonstrate that the IMXT-SAS method satisfied the prescription goals the most poorly of all of the delivery methods. The DVHs for normal tissue indicate that the volume of normal tissue receiving a dose of less than 45% of the base tumour dose was lower for IMXT-SAS than for IMXT-HT, but the volume of normal tissue receiving a dose of greater than 45% of the base tumour dose was higher for IMXT-SAS than for IMXT-HT. This was because the normal tissue dose was distributed more uniformly for the IMXT-HT plans than for the IMXT-SAS due to the greater number of beam directions. Also, the volume of normal tissue receiving a dose of above 5% of the base tumour dose was higher for IMPT-SS than for IMPT-DGT. This was because the number of delivery beams was lower for the IMPT-SS cases than for the IMPT-DGT cases, which reduced smearing and resulted in a less uniform dose distribution in the normal tissue for the IMPT-SS cases.
Figure 8.
Normal tissue cumulative DVHs and tumour EDVHs for the a phantom radius of 15 cm, boost region circle of 4 cm, and boost dose of 100%, which are the dose distributions from the rightmost column of figure 6.
3.3. Local objective functions
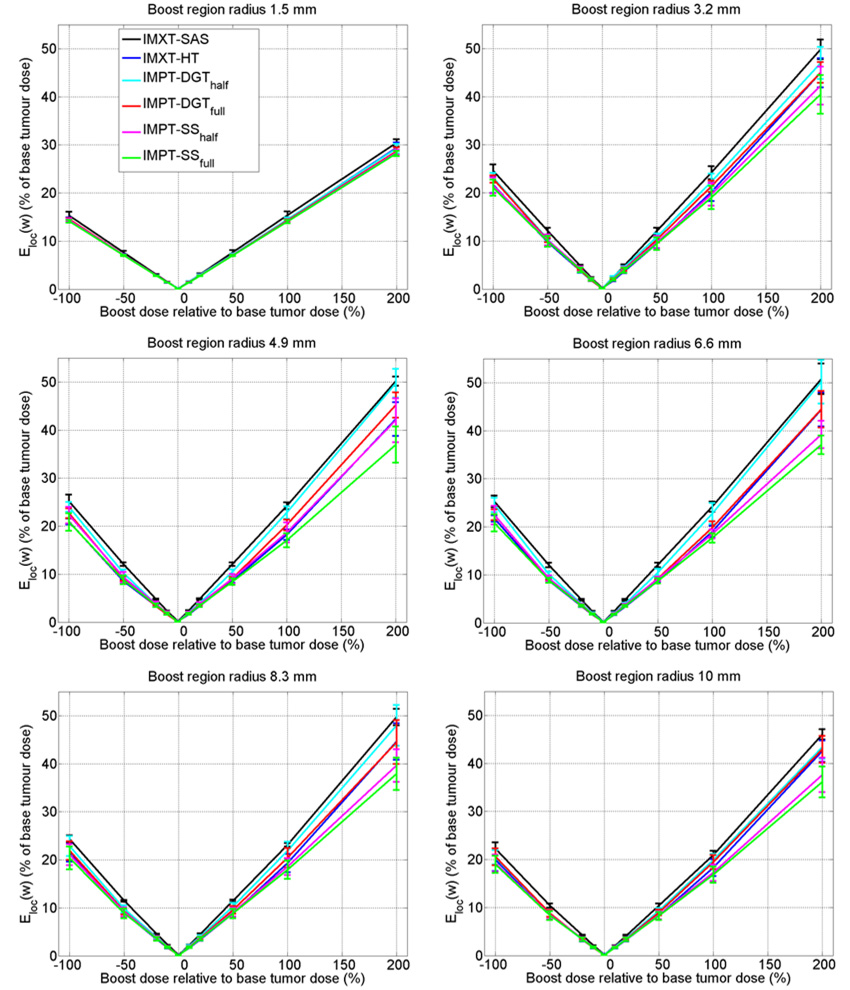
Plots of Eloc as a function of boost dose are shown in figure 9. For a given boost dose, the solid lines pass through the mean Eloc and the error bars represent one standard deviation of Eloc, calculated over all twelve of the phantom radius and boost region circle variations, except for the cases of 0% boosts, in which the mean and standard deviation Eloc values were calculated for only the four phantom radii. Lower Eloc values imply boost doses that more accurately match the prescription goals.
Figure 9.
Local objective function (Eloc) values. The plot lines and error bars represent the mean and one standard deviation of the Eloc values, calculated over all of the phantom radii and boost region circle radii. Lower curves represent boost doses that better satisfy the objective function.
The highest (i.e., worst) mean Eloc curves were for the IMXT-SAS deliveries, the second highest were for the IMPT-DGThalf deliveries, and the lowest (i.e., best) were for the IMPT-SSfull deliveries. The remainder of the mean Eloc curves fell in between, and did not seem to follow a particular order, except that the curve for IMPT-SShalf was usually the second lowest. The error bars for all of the delivery methods except SAS tended to overlap each other, especially for boost doses between −50% and 50%, making exact assessment of the boosting quality of each of the methods difficult.
As the absolute value of the slopes of the mean Eloc lines are nearly the same for both positive and negative boosts, this suggests that the resulting dose distributions in the positive boost regions are just the reverse of the dose distributions in the negative regions, reflected about dose prescription of 100% within the base tumour region.
3.4. Base tumour region dose uniformity
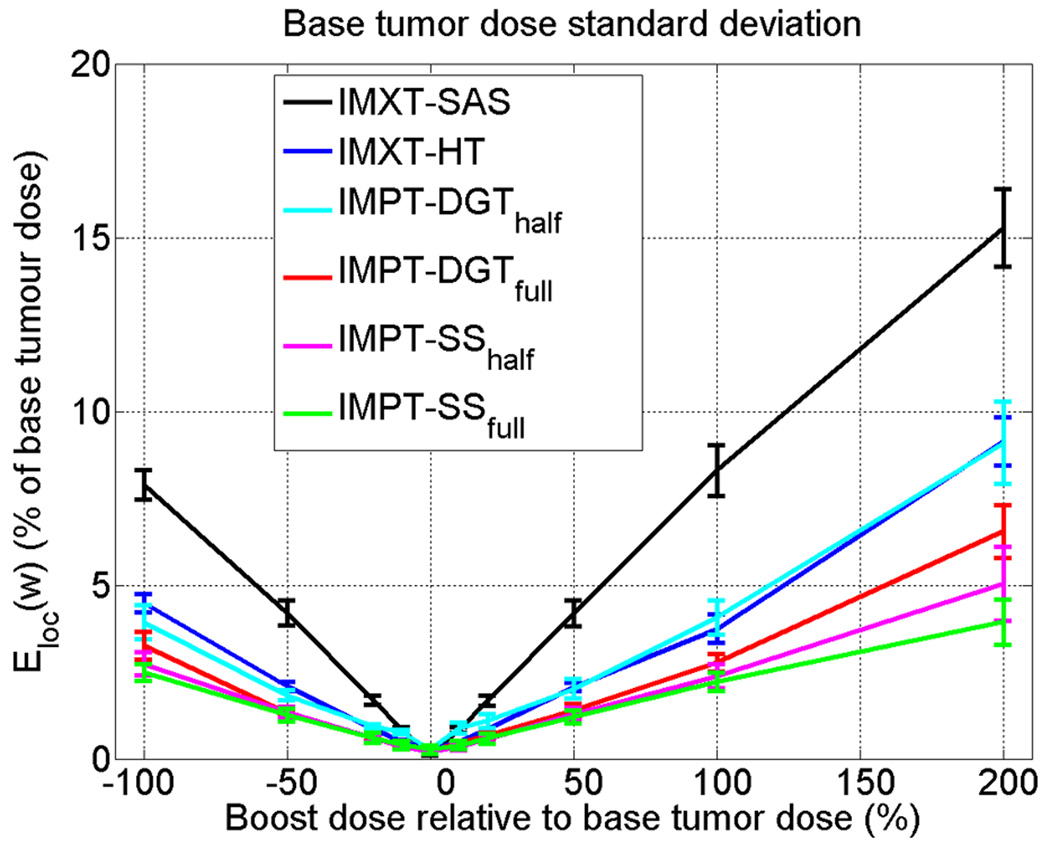
The root mean square of the dose within a 5 cm radius disc (1 cm smaller in radius than the disc comprising the base tumour region), excluding the local evaluation regions for the boosted regions, is shown in figure 10. As was the case for the local evaluation region plots, the solid lines represent the mean and the error bars represent one standard deviation of the dose standard deviations, calculated over the twelve phantom variations.
Figure 10.
Dose standard deviation within a 5 cm radius disc in the base tumour region, minus the local evaluation regions for the boost regions.
IMXT-SAS shows the worst dose uniformity, followed by IMPT-DGThalf and IMXT-HT, which are approximately the same. For boost doses between −100% and 100%, IMPT-DGTfull, IMPT-SShalf, and IMPT-SSfull show better uniformity than the other three methods For boosts of 200%, IMPT-SSfull cases have the lowest mean dose standard deviations in the base tumour region, followed by IMPT-SShalf, and then IMXT-HT. As the focus in the current study was on the physical dose distributions, the clinical consequences of the slightly decreased boost region coverage and increased dose non-uniformity in the base tumour region are unclear. It is possible that clinical cases exist for which dose non-uniformity in the base tumour region is unimportant, as long as the additional dose delivered to nearby critical structures is not significantly increased. For these cases it is likely that the relative importance of dose uniformity in the base tumour region could be relaxed relative to the importance of effectively boosting the subvolumes, and similar outcomes may be obtained with IMXT-SAS as with IMXT-HT.
Although not explicitly tested, it is unlikely that conventional non-intensity modulated proton radiotherapy as currently practised at most proton centers could achieve the high dose conformity of either IMXT or IMPT.
3.5. Integral dose to normal tissue
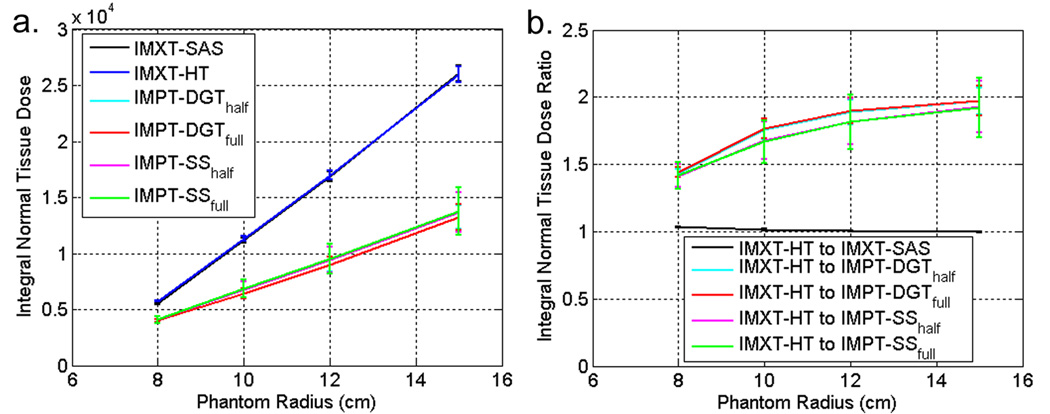
The absolute integral normal tissue dose and the integral normal tissue dose ratios between IMXT-HT and the other five delivery methods as a function of phantom size are shown in figure 11a and figure 11b, respectively. The solid lines and error bars represent the mean and one standard deviation of each quantity, respectively, calculated over all boost dose percentages and boost region circles for a given phantom radius. Thus each mean and standard deviation represents data from twenty eight optimizations.
Figure 11.
a. Integral normal tissue dose for each delivery method. b. Integral normal tissue dose ratios between IMXT-HT and the other five delivery methods. Higher curves imply a greater advantage over IMXT-HT.
Both IMXT methods deliver approximately the same integral dose regardless of the phantom size, which is consistent with previous findings that integral dose is nearly independent of the delivery technique for IMXT (Aoyama et al 2006). As the phantom radius increased, the mean integral normal tissue dose ratios between the IMPT and IMXT methods appeared to converge to approximately two. This is consistent with previous findings for uniform dose prescriptions (Lomax et al 1999).
It would be expected that if the target regions were displaced off centre in the phantom, the deliveries using only a limited arc would have a reduced integral dose as compared to the deliveries spread through all angles due to the shorter average pathlengths travelled in normal tissue. This was not tested, as the tumour region was always in the centre of the phantom in the current study.
3.6. Proton beam spot reduction with IMPT-DGT
In the current paper it was shown that IMPT-DGT can produce very similar dose distributions to IMPT-SS, delivered from beams spaced over either 180° or 360°, with a factor of three fewer proton beam spots. It is likely that the improvement factor in the number of proton beam spots used for IMPT-DGT plans relative to IMPT-SS plans could be further increased with the use of an optimization algorithm that places a constraint on the allowable number of proton beams spots used for IMPT-SS. The problem of determining the optimal placement of proton beam spots in a target is similar to the problem of determining the optimal orientation of beam directions for IMXT (Bortfeld and Schlegel 1993). A method has been presented that constrains the number of proton beam spots used by the IMPT-SS method by turning off a pre-selected percentage of beam spots that have relatively low intensities every iteration (Lomax and Bosshardt 2005), but it is unclear how effective such a method is for dealing with non-uniform dose prescriptions, or whether another, more optimal method, exists. The IMPT-DGT method was presented as an alternative to such methods, in which the proton beam spot locations are determined prior to the optimization process, rather than selected as a part of the optimization process.
3.7. Motion and range uncertainty considerations
Delivery of the IMPT dose distributions would require very accurate proton beam spot placement, which is challenging due to range uncertainties and patient motion. These effects were ignored in order to obtain a best-case scenario estimate of the quality of IMPT treatment plans for non-uniform dose prescriptions. The effects of patient motion can be managed online for example through immobilization techniques, and offline techniques have been developed that account for the effects of both range uncertainties and patient motion in the inverse treatment planning process (Unkelbach et al 2007). In order to determine whether selective boosting with IMPT is justifiable for a particular case, one must weigh the benefits of delivering a low integral dose to normal tissue and avoidance of structures downstream of the target region, against the technical difficulties of placing proton beam spots inside boost regions in an accurate manner.
4. Conclusions
For boost regions larger than 1.5 mm in diameter, the IMPT-SSfull method always showed the best local objective function values of the six delivery methods, and IMXT-SAS always showed the worst. The mean local objective function values improved for the IMPT-SShalf, IMPT-DGTfull, IMXT-HT, IMPT-DGThalf methods, in that order. But, as the local objective function error bars for these four methods tended to overlap, there is no obvious advantage for any of the four methods in terms of their capabilities to deliver the boosts.
The best dose uniformity within the base tumour region was exhibited by IMPT-SSfull and IMPT-SShalf, followed by IMPT-DGTfull. IMPT-DGThalf and IMXT-HT were approximately the same in terms of dose uniformity in the base tumour region, IMXT-SAS showed the worst dose uniformity in the base tumour region.
The difference in the integral normal tissue dose ratios for IMXT-SAS and IMXT-HT were negligible for all delivery situations explored in this work, as shown in figure 11. As the phantom radius increased, the integral normal tissue dose ratios between the IMXT and IMPT methods converged to approximately two, which was the case for the delivery of uniform dose distributions (Lomax et al 1999). Delivering the IMPT treatments with only a half rotation did not reduce the integral normal tissue dose relative to the IMPT treatments delivered with a full rotation.
The IMPT-DGT methods reduced the number of beam spots required by a factor of about three relative to the IMPT-SS methods for both half and full rotation deliveries.
The practical adoption of IMPT for selective subvolume boosting will require accurate management of patient motion and range uncertainties. The need for reduction in normal tissue integral dose relative to IMXT and/or the need to completely spare structures distal to the target region must be a driving force behind the justification of IMPT for SSB, as IMXT dose distributions within the target region are comparable to those of IMPT.
Acknowledgements
This work was funded by NIH grants P01 CA88960, T32 CA09206, and P30 CA14520, and NSF grant 047689. The authors gratefully acknowledge the efforts of Tim Bohm, John Vetter, and Michael Kissick, who maintained the UW-Medical Physics GLOW computer cluster on which the dose calculations and optimizations were run. The authors would like to thank Peter Hoban for his version of the convolution/superposition method.
Footnotes
Classification Numbers:
87.53.-j (Ionizing-radiation therapy physics)
87.53.Pb (Proton, neutron, and heavier particle dosimetry: theory and algorithms)
87.53.Tf (Treatment planning, optimization, tissue response factors, and dose-volume analysis)
References
- Alber M, Paulsen F, Eschmann SM, Machulla HJ. On biologically conformal boost dose optimization. Phys Med Biol. 2003;48:N31–N35. doi: 10.1088/0031-9155/48/2/404. [DOI] [PubMed] [Google Scholar]
- Aoyama H, Westerly DC, Mackie TR, Olivera GH, S.M B, Patel RR, Jaradat H, Tomé WA, Ritter MA, Mehta MP. Integral radiation dose to normal structures with conformal external beam radiation. International Journal of Radiation Oncology, Biology, Physics. 2006;64:962–967. doi: 10.1016/j.ijrobp.2005.11.005. [DOI] [PubMed] [Google Scholar]
- Bauman G, Yartsev S, Fisher B, Kron T, Laperriere N, Heydarian M, Van Dyk J. Simultaneous infield boost with helical tomotherapy for patients with 1 to 3 brain metastases. Amer. J. Clin. Onc. 2007;30:38–44. doi: 10.1097/01.coc.0000245473.41035.c4. [DOI] [PubMed] [Google Scholar]
- Bentzen SM. Theragnostic imaging for radiation oncology: dose-painting by numbers. Lancet Oncol. 2005;6:112–117. doi: 10.1016/S1470-2045(05)01737-7. [DOI] [PubMed] [Google Scholar]
- Bortfeld T, Schlegel W. Optimization of beam orientations in radiation therapy: some theoretical considerations. Phys Med Biol. 1993;38:291–304. doi: 10.1088/0031-9155/38/2/006. [DOI] [PubMed] [Google Scholar]
- Bortfeld TR, Kahler DL, Waldron TJ, Boyer AL. X-ray field compensation with multileaf collimators. Int J Radiat Oncol Biol Phys. 1994;28:723–730. doi: 10.1016/0360-3016(94)90200-3. [DOI] [PubMed] [Google Scholar]
- Brahme A, Ågren AK. Optimal dose distribution for eradication of heterogeneous tumours. Acta Oncol. 1987;26:377–385. doi: 10.3109/02841868709104364. [DOI] [PubMed] [Google Scholar]
- Braunstein M, Levine RY. Optimum beam configurations in tomographic intensity modulated radiation therapy. Phys Med Biol. 2000;45:305–328. doi: 10.1088/0031-9155/45/2/305. [DOI] [PubMed] [Google Scholar]
- Chao KS, Bosch WR, Mutic S, Lewis JS, Dehdashti F, Mintun MA, Dempsey JF, Perez CA, Purdy JA, Welch MJ. A novel approach to overcome hypoxic tumor resistance: Cu-ATSM-guided intensity-modulated radiation therapy. Int J Radiat Oncol Biol Phys. 2001;49:1171–1182. doi: 10.1016/s0360-3016(00)01433-4. [DOI] [PubMed] [Google Scholar]
- Chen G-P, Ahunbay E, Schultz C, Li XA. Development of an inverse optimization package to plan nonuniform dose distributions on spatially inhomogeneous radiosensitivity extracted from biological images. Med Phys. 2007;34:1198–1205. doi: 10.1118/1.2710948. [DOI] [PubMed] [Google Scholar]
- Das SK, Miften MM, Zhou S, Bell M, Munley MT, Whiddon CS, Craciunescu O, Baydush AH, Wong T, Rosenman JG, Dewhirst MW, Marks LB. Feasibility of optimizing the dose distribution in lung tumors using fluorine-18-fluorodeoxyglucose positron emission tomography and single photon emission computed tomography guided dose prescriptions. Med Phys. 2004;31:1452–1461. doi: 10.1118/1.1750991. [DOI] [PubMed] [Google Scholar]
- Deasy JO. Partial tumor boosts: even more attractive than theory predicts? Int J Radiat Oncol Biol Phys. 2001;51:279–280. doi: 10.1016/s0360-3016(01)01611-x. [DOI] [PubMed] [Google Scholar]
- Deasy JO, Shepard D, Mackie TR. Distal edge tracking: a proposed delivery method for conformal proton therapy using intensity modulation. Proceedings XIIth ICCR. 1997 [Google Scholar]
- Ebert MA, Hoban PW. Some characteristics of tumour control probability for heterogeneous tumours. Phys Med Biol. 1996;41:2125–2133. doi: 10.1088/0031-9155/41/10/019. [DOI] [PubMed] [Google Scholar]
- Fenwick JD, Tomé WA, Jaradat HA, Hui SK, James JA, Balog JP, DeSouza CN, Lucas DB, Olivera GH, Mackie TR, Paliwal BR. Quality assurance of a helical tomotherapy machine. Phys Med Biol. 2004;49:2933–2953. doi: 10.1088/0031-9155/49/13/012. [DOI] [PubMed] [Google Scholar]
- Goitein M, Niemierko A, Okunieff P. The probability of controlling an inhomogeneously irradiated tumor. Proceedings of the 19th LH Gray Conference; British Institute of Radiology; London. 1995. pp. 25–32. [Google Scholar]
- Gueulette J, Gregoire V, Octave-Prignot M, Wambersie A. Measurements of radiobiological effectiveness in the 85 MeV proton beam produced at the cyclotron CYCLONE of Louvain-la-Neuve, Belgium. Radiat Res. 1996;145:70–74. [PubMed] [Google Scholar]
- Hoban PW, Murray DC, Round WH. Photon beam convolution using polyenergetic energy deposition kernels. Phys Med Biol. 1994;39:669–685. doi: 10.1088/0031-9155/39/4/002. [DOI] [PubMed] [Google Scholar]
- Hong L, Goitein M, Bucciolini M, Comiskey R, Gottschalk B, Rosenthal S, Serago C, Urie M. A pencil beam algorithm for proton dose calculations. Phys Med Biol. 1996;41:1305–1330. doi: 10.1088/0031-9155/41/8/005. [DOI] [PubMed] [Google Scholar]
- Huntzinger C, Brooks K, Tang HR, Hasagawa B, Mohan R. The MTF of IMRT; Proceedings of the World Congress on Medical Physics and Bioengineering; Chicago, IL: 2000. pp. 23–28. [Google Scholar]
- Kim Y, Tomé WA. Risk-adaptive optimization: selective boosting of high-risk tumor subvolumes. Int J Radiat Oncol Biol Phys. 2006;66:1528–1542. doi: 10.1016/j.ijrobp.2006.08.032. [DOI] [PMC free article] [PubMed] [Google Scholar]
- Kissick MW, Mackie TR, Jeraj R. A delivery transfer function (DTF) analysis for helical tomotherapy. Phys Med Biol. 2007;52:2355–2365. doi: 10.1088/0031-9155/52/9/002. [DOI] [PubMed] [Google Scholar]
- Levin-Plotnik D, Hamilton RJ. Optimization of tumour control probability for heterogeneous tumours in fractionated radiotherapy treatment protocols. Phys Med Biol. 2004;49:407–424. doi: 10.1088/0031-9155/49/3/005. [DOI] [PubMed] [Google Scholar]
- Lomax A, Bosshardt M. Optimising spot numbers in IMPT. Radiotherapy & Oncology. 2005;76:S63. [Google Scholar]
- Lomax AJ, Bohringer T, Bolsi A, Coray D, Emert F, Goitein G, Jermann M, Lin S, Pedroni E, Rutz H, Stadelmann O, Timmermann B, Verwey J, Weber DC. Treatment planning and verification of proton therapy using spot scanning: initial experiences. Med Phys. 2004;31:3150–3157. doi: 10.1118/1.1779371. [DOI] [PubMed] [Google Scholar]
- Lomax AJ, Bortfeld T, Goitein G, Debus J, Dykstra C, Tercier PA, Coucke PA, Mirimanoff RO. A treatment planning inter-comparison of proton and intensity modulated photon radiotherapy. Radiother Oncol. 1999;51:257–271. doi: 10.1016/s0167-8140(99)00036-5. [DOI] [PubMed] [Google Scholar]
- Lomax AJ, Goitein M, Adams J. Intensity modulation in radiotherapy: photons versus protons in the paranasal sinus. Radiother Oncol. 2003;66:11–18. doi: 10.1016/s0167-8140(02)00308-0. [DOI] [PubMed] [Google Scholar]
- Mackie TR. History of tomotherapy. Phys Med Biol. 2006;51:R427–R453. doi: 10.1088/0031-9155/51/13/R24. [DOI] [PubMed] [Google Scholar]
- Mackie TR, Bielajew AF, Rogers DW, Battista JJ. Generation of photon energy deposition kernels using the EGS Monte Carlo code. Phys Med Biol. 1988;33:1–20. doi: 10.1088/0031-9155/33/1/001. [DOI] [PubMed] [Google Scholar]
- Mackie TR, Holmes T, Swerdloff S, Reckwerdt P, Deasy JO, Yang J, Paliwal B, Kinsella T. Tomotherapy: a new concept for the delivery of dynamic conformal radiotherapy. Med Phys. 1993;20:1709–1719. doi: 10.1118/1.596958. [DOI] [PubMed] [Google Scholar]
- Malinen E, Søvik Å, Hristov D, Bruland OS, Olsen DR. Adapting radiotherapy to hypoxic tumours. Phys Med Biol. 2006;51:4903–4921. doi: 10.1088/0031-9155/51/19/012. [DOI] [PubMed] [Google Scholar]
- Meer D, Bula C, Hibes C, Pedroni E, Zenklusen S. Developments towards advanced scanning in the Gantry 2 test area at PSI [Abstract]; Proceedings of the PTCOG; China: Zibo; 2007. p. 6. [Google Scholar]
- Mutic S, Malyapa RS, Grigsby PW, Dehdashti F, Miller TR, Zoberi I, Bosch WR, Esthappan J, Low DA. PET-guided IMRT for cervical carcinoma with positive para-aortic lymph nodes-a dose-escalation treatment planning study. Int J Radiat Oncol Biol Phys. 2003;55:28–35. doi: 10.1016/s0360-3016(02)03804-x. [DOI] [PubMed] [Google Scholar]
- Nestle U, Kremp S, Grosu AL. Practical integration of [18F]-FDG-PET and PET-CT in the planning of radiotherapy for non-small cell lung cancer (NSCLC): the technical basis, ICRU-target volumes, problems, perspectives. Radiother Oncol. 2006;81:209–225. doi: 10.1016/j.radonc.2006.09.011. [DOI] [PubMed] [Google Scholar]
- Oelfke U, Bortfeld T. Inverse planning for x-ray rotation therapy: a general solution of the inverse problem. Physics in Medicine & Biology. 1999;44:1089–1104. doi: 10.1088/0031-9155/44/4/019. [DOI] [PubMed] [Google Scholar]
- Oelfke U, Bortfeld T. Intensity modulated radiotherapy with charged particle beams: studies of inverse treatment planning for rotation therapy. Med. Phys. 2000;27:1246–1257. doi: 10.1118/1.599002. [DOI] [PubMed] [Google Scholar]
- Otto K, Clark BG, Huntzinger C. Exploring the limits of spatial resolution in radiation dose delivery. Med Phys. 2002;29:1823–1831. doi: 10.1118/1.1495865. [DOI] [PubMed] [Google Scholar]
- Pedroni E, Bacher R, Blattmann H, Bohringer T, Coray A, Lomax A, Lin S, Munkel G, Scheib S, Schneider U, Tuorovsky A. The 200-MeV proton therapy project at the Paul Scherrer Institute: conceptual design and practical realization. Med Phys. 1995;22:37–53. doi: 10.1118/1.597522. [DOI] [PubMed] [Google Scholar]
- Pedroni E, Enge H. Beam optics design of compact gantry for proton therapy. Med Biol Eng Comput. 1995;33:271–277. doi: 10.1007/BF02510499. [DOI] [PubMed] [Google Scholar]
- Popple RA, Ove R, Shen S. Tumor control probability for selective boosting of hypoxic subvolumes, including the effect of reoxygenation. Int J Radiat Oncol Biol Phys. 2002;54:921–927. doi: 10.1016/s0360-3016(02)03007-9. [DOI] [PubMed] [Google Scholar]
- Shepard DM, Earl MA, Li XA, Naqvi S, Yu C. Direct aperture optimization: a turnkey solution for step-and-shoot IMRT. Med Phys. 2002;29:1007–1018. doi: 10.1118/1.1477415. [DOI] [PubMed] [Google Scholar]
- Shepard DM, Olivera GH, Reckwerdt PJ, Mackie TR. Iterative approaches to dose optimization in tomotherapy. Phys Med Biol. 2000;45:69–90. doi: 10.1088/0031-9155/45/1/306. [DOI] [PubMed] [Google Scholar]
- Tomé WA, Fowler JF. Selective boosting of tumor subvolumes. Int J Radiat Oncol Biol Phys. 2000;48:593–599. doi: 10.1016/s0360-3016(00)00666-0. [DOI] [PubMed] [Google Scholar]
- Tomé WA, Fowler JF. On the inclusion of proliferation in tumour control probability calculations for inhomogeneously irradiated tumours. Phys Med Biol. 2003;48:N261–N268. doi: 10.1088/0031-9155/48/18/402. [DOI] [PubMed] [Google Scholar]
- Unkelbach J, Chan TC, Bortfeld T. Accounting for range uncertainties in the optimization of intensity modulated proton therapy. Phys Med Biol. 2007;52:2755–2773. doi: 10.1088/0031-9155/52/10/009. [DOI] [PubMed] [Google Scholar]
- Vanderstraeten B, Duthoy W, De Gersem W, De Neve W, Thierens H. [18F]fluoro-deoxyglucose positron emission tomography ([18F]FDG-PET) voxel intensity-based intensity-modulated radiation therapy (IMRT) for head and neck cancer. Radiother Oncol. 2006;79:249–258. doi: 10.1016/j.radonc.2006.03.003. [DOI] [PubMed] [Google Scholar]
- Webb S. Configuration options for intensity-modulated radiation therapy using multiple static fields shaped by a multileaf collimator. Phys Med Biol. 1998;43:241–260. doi: 10.1088/0031-9155/43/2/003. [DOI] [PubMed] [Google Scholar]
- Xing L, Cotrutz C, Hunjan S, Boyer AL, Adalsteinsson E, Spielman D. Inverse planning for functional image-guided intensity-modulated radiation therapy. Phys Med Biol. 2002;47:3567–3578. doi: 10.1088/0031-9155/47/20/301. [DOI] [PubMed] [Google Scholar]
- Yang Y, Xing L. Clinical knowledge-based inverse treatment planning. Phys Med Biol. 2004a;49:5101–5117. doi: 10.1088/0031-9155/49/22/006. [DOI] [PubMed] [Google Scholar]
- Yang Y, Xing L. Inverse treatment planning with adaptively evolving voxel-dependent penalty scheme. Med Phys. 2004b;31:2839–2844. doi: 10.1118/1.1799311. [DOI] [PubMed] [Google Scholar]
- Yang Y, Xing L. Towards biologically conformal radiation therapy (BCRT): selective IMRT dose escalation under the guidance of spatial biology distribution. Med Phys. 2005;32:1473–1484. doi: 10.1118/1.1924312. [DOI] [PubMed] [Google Scholar]


