

Summary
Thioflavin T (ThT) is a fluorescent dye commonly used to stain amyloid plaques, however, the binding sites of this dye onto fibrils are poorly characterized. We present molecular dynamics simulations of the binding of ThT and its neutral analog BTA-1 to model protofibrils of the Alzheimer Amyloid Aβ16-22 peptide. Our simulations reveal two binding modes located at the grooves of the β-sheet surfaces and at the ends of the β-sheet. These simulations provide new insight into recent experimental work and allow us to characterize the high-capacity, micromolar-affinity site seen in experiment as binding to the β-sheet surface grooves and the low-capacity, nanomolar-affinity site as binding to the β-sheet extremities of the fibril. The structure-activity relationship (SAR) upon mutating charged ThT to neutral BTA-1 in terms of increased lipophilicity and binding affinity was studied, with calculated solvation free energies and binding energies found to be in qualitative agreement with the experimental measurements.
Keywords: Amyloid fibrils, Alzheimer Aβ16-22 peptide, Aggregation, Thioflavin T, Molecular Dynamics Simulations
Introduction
Amyloidoses are a class of diseases characterized by the pathological deposition of protein aggregates in the form of amyloid plaques on organs and tissues in the body. Huntington's disease, Parkinson's disease, Type II diabetes and Alzheimer's disease are all examples of amyloid diseases.1; 2 While the precise causative agent of these diseases remains a matter of debate, it is well established that amyloidoses involve either the incorrect folding of proteins or the structuring of natively disordered peptides, followed by their self-assembly to protein/peptide aggregates. The aggregation process involves the formation of small soluble oligomers, protofibrils, fibrils and finally deposition as amyloid plaques. Fibrillar aggregates, regardless of the peptide or protein involved, have a generic structure, involving cross β-sheets in which cross-strand main-chain hydrogen-bonds lay parallel to the fibril axis. From a biomedical standpoint, it is critical to have a means of identifying amyloid aggregates in order to diagnose amyloid diseases in patients, and for the development of therapeutics. To date, one of the most common and powerful means of characterizing amyloid fibrils is through the use of fluorescent dyes, which include, among others, derivatives of Congo red (CR) and Thioflavin T (ThT).3 These dyes undergo a metachromatic shift in their absorbance spectrum (CR) or a change in their excitation spectrum (ThT) in the presence of amyloid fibrils, but not in the presence of amyloidogenic peptide or protein monomers. The spectrum change is believed to be due to the resulting change in chemical environment upon binding of the dye to the β-sheets of the fibril. While these dyes offer a reliable means of visualizing aggregates through staining, the current lack of high resolution structural information available has left several open questions, including the nature of the molecular form in which the dye binds the fibril, the binding locations on the fibril and the mechanism of fluorescence enhancement upon binding. Experiments by Krebs and coworkers4 suggest that TFT binds in a monomeric form along the fibril axis in the regular grooves formed by the side chains of residues n and n + 2 of the registered β-strands on the surface of the β-sheet of the fibril. In this model, steric interactions between dye molecules and the side chains of the fibril would be responsible for the fluorescence enhancement. Groenning et al. 5; 6, on the other hand, propose that ThT binds as a dimer either in the central pore of the fibril, along the fibril or at the interface between the protofilaments composing the mature fibril. In this case, formation of an excimer would account for the fluorescence increase upon ThT binding. Finally, Khurana et al.7 propose that ThT binds to amyloid fibrils as a preformed micelle of about 3 nm in diameter and that the fluorescence enhancement is due to the hydrogen-bonding of the micelle to the amyloid fibril. This later model has recently been challenged by Sabate and coworkers 8 who showed that the critical micelle concentration of ThT (∼35 μM) is an order of magnitude greater than the concentrations used in typical staining experiments (<5 μM), intimating that ThT cannot bind as a preformed micelle. It is clear that obtaining a molecular level understanding of binding is essential in order to interpret binding experiments as well as for the design of better dyes for clinical purposes.
The primary aim of this study is a theoretical investigation of the binding of Thioflavin T (ThT) and one of its neutral derivatives (2-(4′-Methylaminophenyl) benzothiazole/BTA-1) to amyloid fibrils. We wish to determine where these dyes bind on the fibril and how mutating ThT to BTA-1 affects solubility and binding affinity. We will focus on aggregates of the Alzheimer Amyloid-β (Aβ) peptide implicated in Alzheimer's disease for two reasons: 1) this system serves as a model case for the general class of amyloid aggregation and 2) much of the experimental work on amyloid imaging agents has involved this peptide. The Aβ peptide is a proteolytic by-product of the enzymatic cleavage of the Amyloid Precursor Protein and typically ranges from 39 to 42 residues in length, although shorter fragments have also been shown to aggregate into amyloid fibrils.9; 10; 11; 12 ThT (cationic benzothiazole aniline/C17H19ClN2S), shown in Figure 1, undergoes a characteristic 115 nm red shift of its excitation spectrum upon binding to Aβ (and other) amyloid fibrils.13 To improve the ability of this dye to cross the brain-blood barrier, a necessity for in-vivo studies, the lipophilicity of the dye was increased more than 600 fold by removing the positively charged quaternary heterocyclic nitrogen. Among the derivatives resulting from this substitution, the 2-(4′-Methylaminophenyl) benzothiazole (BTA-1) dye emerged as one of the more promising dyes, capable of binding to Aβ40 fibrils with much higher affinity (Ki = 20.2 nM) than ThT (Ki = 890 nM).14 A further variant (PIB) of BTA-1, a hydroxylated BTA-1 derivative, had brain clearance properties comparable to PET radiotracers15 and was shown to be capable of detecting amyloid fibrils in humans.16; 17; 18; 19; 20; 21; 22; 23 Experimental binding studies of ThT and its derivatives onto Aβ fibrils have identified at least three different sites, with different binding stoichiometries and affinities (see Table 1).24 These three sites can be grouped into two main types/modes based on their binding ratios and affinities: A high capacity, micromolar-affinity (type I) and a low capacity nanomolar-affinity (type II) sites. The two sites of type 1 appear to be located near one another, and, based on fluorescence studies, to correspond to hydrophobic pockets on the Aβ fibril.24 Detailed structural information of ThT binding at atomic level is not available, and this hinders not only our understanding of binding mechanisms, but also the design of better dyes for clinical purposes.
Figure 1.
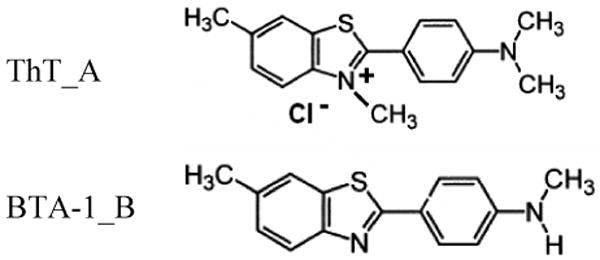
Structures of two amyloid dyes. A: Thioflavin T. B: a neutral analog BTA-1.
Table 1.
Summary of the three binding sites for the ThT class of amyloid dye onto Aβ40 fibrils seen in fluorescent experiments a and this simulation study.
Here, we use molecular dynamics simulations to study the binding of ThT and BTA-1 to model fibrils of the Aβ16-22 (sequence KLVFFAE) peptide. This seven-residue fragment encompasses the central hydrophobic core of the full-length Aβ peptide22 and has been shown by solid state NMR, electron microscopy, X-ray powder diffraction and optical birefringence measurements with amyloid dyes (including ThT) to form highly ordered amyloid fibrils, consisting of β-sheets with anti-parallel in-register β-strands in each β-sheet. Furthermore, in both Aβ4025; 26 and Aβ16-2211; 12 fibrils, the 16-22 KLVFFAE segment is in a β-strand configuration, with the requisite hydrophobic sites on the β-sheet surface available for type I binding. The small size of the Aβ16-22 peptide makes it an ideal model system for theoretical studies of early oligomerization,27; 28; 29; 30 fibril formation31 and inhibition,32 as well as the binding of dyes to amyloid aggregates. Our simulations enable us to identify at an atomic level the binding sites for the dyes, the binding form of the dyes and explain the binding stoichiometries from experiments. Our solvation free energy and binding energy analysis also sheds light on the enhancement of lipophilicity and binding affinity arising from modifying ThT to BTA-1.
Results
We constructed a protofibril consisting of two parallel β-sheets, each comprised of eight antiparallel in-register β-strands, as described in the Methods section. This Aβ16-22 protofibril, shown in Figure 2A, retained its two-layered β-sheet structure and was stable at 320 K over the course of all eight 20 ns ThT/protofibril and BTA-1/protofibril simulations, as indicated by the small root mean square distance (RMSD=1.7 ± 0.2 Å) from the starting structure. Reversible binding of dye to the protofibril was observed in trajectories (See Fig. S1 of a typical trajectory in the supplementary material). At the end of the simulations (each simulation involved one protofibril and four dye molecules, see Methods section), on average 3 out of 4 ThT dye molecules and 4 out of 4 BTA-1 dye molecules were stably bound to the protofibril (data not shown). While ThT bound the fibril as a monomer in all trajectories, BTA-1 formed a dimer in one trajectory through the stacking of a BTA-1 monomer on top of an already β-sheet surface bound BTA-1 monomer. In the three other trajectories, BTA-1 bound as a monomer. The neutral BTA-1 molecule would appear to have a higher tendency to form oligomers than the positively charged ThT dyes. We note that the absence of dimers of ThT in our simulations does not preclude their existence: we may not see dimer formation because of the system size (ie a limited number of dye molecules present in our periodic box). We do not expect to see micelles in our simulation as the effective concentration in the simulations is in the range used in staining experiments (< 5 μM), well below the critical micellar concentration (∼35 μM).
Figure 2.
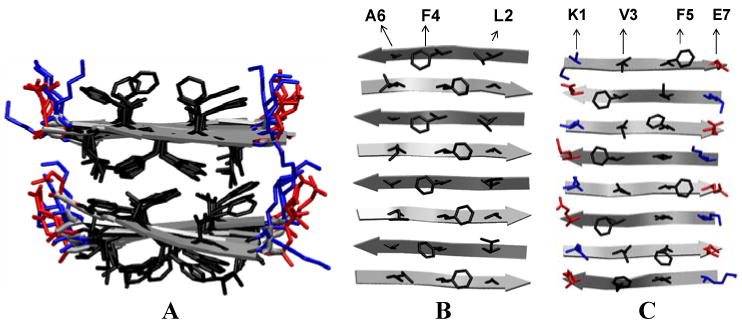
Aβ16-22 protofibril consisting of two β-sheets with eight anti-parallel in-register β-strands in each β-sheet. A: two β-sheets stacked in parallel B: the grooves along the β-sheet extension direction, between the surface side-chains on the surface of the lower sheet-layer. C: the grooves on the surface of the upper sheet-layer. The positively charged, negatively charged and hydrophobic side-chains are colored in blue, red and black, respectively.
To identify the binding sites of the dye, we superimposed the protofibril structure of the bound complexes identified from the trajectories (see Fig. 3). For ThT, four populated ligand clusters are identified: one cluster along the central straight groove [F4-;-F4] formed by the Phe rings on the surface of the lower sheet-layer (Fig. 3A1); another cluster along the central kink groove [V3-F5; F5-V3] between the side-chains of Val and Phe (this groove is due to the antiparallel arrangement of the β-strands in the upper sheet-layer); and finally two clusters at two ends of the β-sheet. Because the two ends of β-sheet are chemically equivalent, the last two clusters correspond to the same binding site. Thus, three binding sites are identified from the four clusters: two parallel to the β-sheet extension (main chain hydrogen bond) direction, and one parallel to the β-strand direction.
Figure 3.
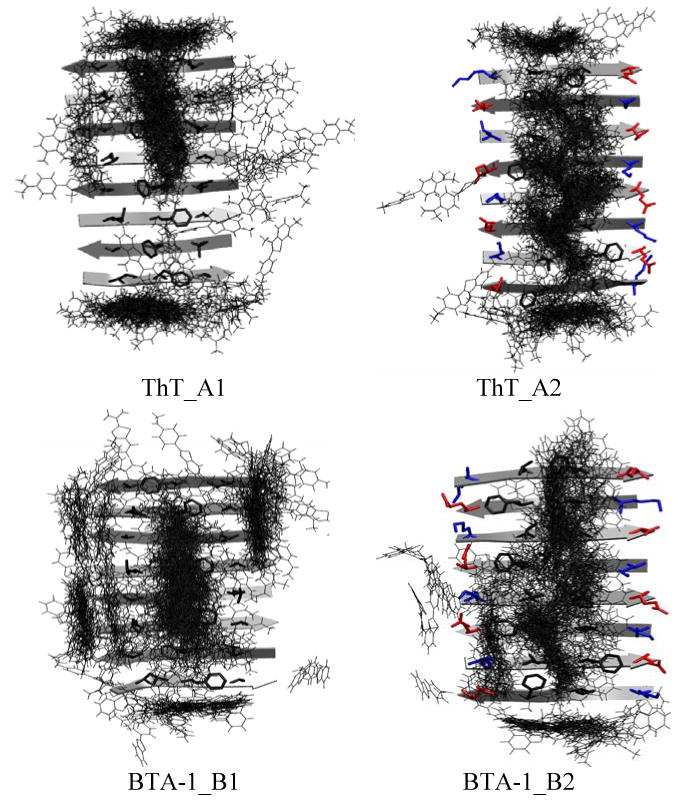
Distribution of the bound dyes around the protofibril. Panels A (A1 and A2) show the binding of ThT, while panels B (B1-B2) show the binding of BTA-1. In A1 and B1, binding is shown on the lower sheet-layer; In A2 and B2: binding is shown on the upper sheet-layer. Dyes are represented by lines; the positively charged, negatively charged and hydrophobic side-chains of the peptide are colored in blue, red and black, respectively.
The binding patterns for BTA-1 are shown in Figures 3B1 and 3B2. All three binding sites seen for ThT (Fig 3A) are also observed for BTA-1. This is consistent with the fact that the positively charged ThT molecules did not bind to the negatively charged E22, indicating that charge-charge interaction may not play a dominant role in recognizing the protofibril. Hence removing the charge on ThT (as was done to create the neutral analog BTA-1) should not alter the binding at the three binding sites. However, the following differences emerge: 1.) binding at the two ends of β-sheet was reduced and 2.) two additional bindings in the side grooves are observed on the surface of the two sheet-layers ([L2-; A6-] of the lower sheet-layer; [K1-V3; E7-F5] of the upper sheet-layer). The latter may indicate that charge removal enhances the hydrophobic interaction between the dye and the protofibril, leading to additional binding in the side grooves.
A two level clustering analysis as described in the method section was carried out. For ThT, the top 15 clusters of the bound complex could be grouped into the three binding sites described earlier: binding in the central grooves of the lower sheet-layer, binding in the central grooves of the upper sheet-layer and binding at the end of the β-sheet. For BTA-1, two more binding sites are again identified: the first involves binding in the side grooves of the lower sheet-layer, and the second binding in the side grooves of the upper sheet-layer. A representative complex structure at each site and its abundance are shown in Figure 4.
Figure 4.
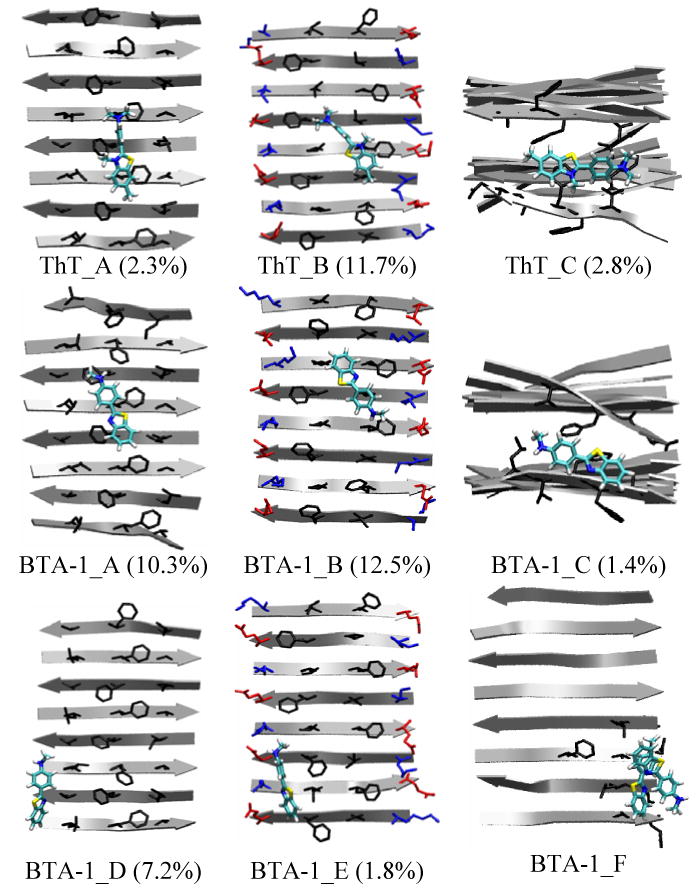
Binding sites of ThT and BTA-1 to the protofibril. A: Binding in the central groove of the lower sheet-layer. B: Binding in the central groove of the upper sheet-layer. C: Binding at the ends of the two-layer β-sheet. D: Binding in the side grooves of the lower sheet-layer. E: Binding in the side grooves of the upper sheet-layer. The aggregated abundance of the super-cluster over the total population (bound + unbound) shown in parenthesis is the sum over the clusters in each binding mode (e.g. ThT_A: A1-A3 in Fig. S1 of the Supplementary Material). F: Dimer formation by lateral stacking. For a protofibril, only the surface side-chains (blue: positively charged, red: negatively charged and black: hydrophobic) are shown in A-B and D-E, and only the side-chains in contact with a ThT/BTA-1 molecule are shown in C and F. Atoms C, N, S and H of the dye are colored by cyan, blue, yellow and white, respectively.
For both ThT and BTA-1, binding in the grooves (including the side grooves for BTA-1) of the sheet-layers appears to be more favorable than binding at the two ends, as indicated by the larger abundance seen in the clustering studies shown in Figure 4 (i.e 14% vs. 2.8% for ThT; 26.1 vs. 1.4% for BTA-1). The fact that there are more binding sites available in the grooves on the β-sheet surface than at the two end of the β-sheet further suggests that binding in the grooves rather than at the fibril ends is the primary recognition mode of amyloid fibrils by ThT and BTA-1. This binding scheme was also observed in the study of another amyloid dye—Congo red33 binding to fibrils of the amylin fragment (NFGAIL). In the case of ThT, the left double-ring with the positively charged nitrogen tends to lay parallel to the β-sheet surface, exposing the positively charged nitrogen to the solvent (Fig. 4 ThT_A and ThT_B). This arrangement avoids a desolvation penalty upon binding and enhances Phe ring-ring interactions. In contrast, when this charge is removed in BTA-1, the left double-ring is now capable of inserting into the side groove (Fig. 4 BTA-1_D). In sum, hydrophobic interactions and Van der Waal (VDW) interactions that help improve the fit of the dye into the protofibril grooves contribute to the enhanced fibril recognition by BTA-1 over ThT.
To gain a more quantitative understanding of the binding differences between ThT and BTA-1, we evaluated the binding energies at each binding site using the MM-GBSA method as described in the Method section. These energies, averaged from the representative structures shown in Fig. S1-S2 of the Supplementary Material, are listed in Table 2. Each binding site is seen to have different binding energies/enthalpies. Assuming that the binding entropies are similar in each case, these different energies correspond to different binding free energies. The three binding sites for ThT have binding energies ranging from ∼-2.2 - ∼-8.5 kcal/mol. The lowest binding energy (-8.5 kcal/mol) corresponds to binding in the central grooves [F4-;-F4] formed by the Phe rings of the lower sheet-layer. In the case of BTA-1, the binding energies of the five binding sites range from ∼-7.6 – -29.2 kcal/mol. Interestingly, BTA-1 and ThT do not share the same strongest binding site. The site with the highest binding affinity for BTA-1 is in the side grooves formed by [K1-V3; E7-F5] of the upper sheet-layer, while that for ThT is located at [F4-;-F4]. This observation may explain why BTA-1 interacts non-competitively with fibril-induced ThT fluorescence when the two dyes are tested in a competitive binding experiment to Aβ40 fibrils.14; 34
Table 2.
MM-GBSA binding energies (kcal/mol) at the different sites for each dye (See Fig. 4).
| Ligand | Site A a | Site B b | Site C c | Site D d | Site E e |
|---|---|---|---|---|---|
| ThT | -8.5 ± 3.5 | -2.2 ± 3.1 | -4.9 ± 0.9 | – | – |
| BTA-1 | -24.3 ± 3.5 | -14.1 ± 4.8 | -16.2 | -7.6 ± 3.3 | -29.2 |
Central grooves of the lower sheet-layer.
Central grooves of the upper sheet-layer.
Two ends of the β-sheet.
Side grooves of the lower sheet-layer.
Side grooves of the upper sheet-layer.
To compare with the experimentally determined overall dissociation constant of ThT and BTA-1 to the protofibril (Table 1), we averaged the binding energy over all sites (Table 3). The binding energy of ThT to the protofibril is ∼-4.3 kcal/mol, as compared to the more favorable binding of -16.3 kcal/mol in the case of BTA-1. The relative binding free energy difference between BTA-1 and ThT is ∼-12.0 kcal/mol (assuming similar binding entropy), which is qualitatively consistent with the experimental number of ∼-3 kcal/mol.17; 20; 34 The overestimation of this number seen in simulation is likely a result of approximations used in the MM-GBSA approach. Decomposition of the binding free energy into different components reveals that the solvation part (GB energy) contributes the most (∼-18.8 kcal/mole) to the binding energy difference between BTA-1 and ThT. Hence removing the charge from ThT to form BTA-1 significantly favors binding by decreasing the desolvation penalty upon binding, i.e. increasing hydrophobicity.
Table 3.
Averaged binding energies (kcal/mol) of ThT and its neutral analog BTA-1.
| Ligand | ΔEGASa | ΔESURb | ΔEGBc | ΔETOTd |
|---|---|---|---|---|
| ThT | -23.2 ± 10.0 | -1.7 ± 0.2 | 20.7 ± 9.8 | -4.3 ± 3.6 |
| BTA-1 | -16.5 ± 7.2 | -1.6 ± 0.6 | 1.9 ± 5.4 | -16.3 ± 8.1 |
| Change (ΔΔE) | 6.7 | 0.1 | -18.8 | -12.0 |
Change of potential energy in gas phase upon complex formation.
Change of energy due to surface area change upon complex formation.
Change of GB reaction field energy upon complex formation.
Change of potential energy in water upon complex formation (ΔEGAS + ΔEGB +ΔESUR).
The absolute solvation free energies of ThT+Cl- and its neutral derivative BTA-1 were calculated by thermodynamic integration as described in the Method section. The lipophilicity/hydrophobicity of BTA-1 is seen to be significantly improved in comparison to ThT, as indicated by the change in solvation free energy in water from -78.3 kcal/mol for ThT+Cl- to -5.3 kcal/mol for BTA-1 (Table 4). This is consistent with the experimental observation that BTA-1 is 600-fold more lipophilic than ThT.14
Table 4.
Calculated solvation free energies (kcal/mol) of the dyes.
| ΔGsolv | |||
|---|---|---|---|
| Ligand | Elec. | VDW | Totala |
| ThT++Cl- | -84.6 | -6.3 | -78.3 ± 0.3 |
| BTA-1 | -5.8 | -0.5 | -5.3 ± 0.2 |
| Change (ΔΔG) | – | – | -73.0 |
Errors were calculated by using three blocks of trajectories (3-4 ns, 4-5 ns, 5-6 ns).
Discussion and Conclusions
Fluorescent dyes (ThT, CR and their derivatives) are commonly used agents to identify the presence of amyloid aggregates in vitro and in vivo.13; 35; 36; 37 These dyes undergo a shift in their excitation spectrum when bound to protein and peptide aggregates, but not when bound to monomers. This shift is associated with binding to the β-sheets of the aggregates, but the precise location of the binding sites on the aggregates is not experimentally known.
The aim of this work is to elucidate the binding sites of ThT and its neutral analogy BTA-1 on amyloid protofibrils and fibrils and to determine the structure-activity relationship in term of solubility and binding affinity, upon mutating ThT to BTA-1. We considered a model system consisting of a protofibril of the Aβ16-22 (KLVFFAE) peptide, the smallest aggregating fragment of the Alzheimer Amyloid-β peptide. Fibrils of this peptide exhibit all the signatures of amyloid fibrils, including a cross-β structure and staining by ThT.
Our simulations revealed multiple binding sites for the two dyes at two types of locations (two binding modes): 1) Type 1: In the (side and central) grooves of the β-sheet surface along the β-sheet extension direction and 2) Type 2: at the ends of the β-sheet. These two types of binding sites are generic for any amyloid fibril. For the first type, the grooves arise from the repetition, along the β-sheet extension direction, of the small regular concave and convex surfaces of an extended β-strand. The surface pattern of an extended β-strand is due to the alternation of side-chain directions along the backbone of an extended β-strand. The density of this type of binding sites is high, because it is proportional to the surface area of exposed β-sheet in the protofibril (which typically contains 1 to 4 layers of β-sheets). This type of binding mode (type 1) is consistent with the one first proposed by Kreb et al.4 and subsequently by other groups.6; 8 In contrast, the site density of the second type of binding mode is low, because although the β-sheet is made of very large number of β-strands (∼100-10000), it clearly only has two ends. The larger site density in the first type of binding site is suggestive that binding on the β-sheet surface is the dominant binding mode for the amyloid dyes. This mode explains why linear amyloid dyes such as ThT, Congo red and their derivatives can bind to any amyloid fibril. Amyloid fibrils all possess a cross-β structure, regardless of the primary sequence of the protein or peptide constituting the fibrils. The linear grooves seen in amyloid fibrils are cross-β sheet specific and are rarely seen in normal ordered proteins and non-amyloid protein aggregates.
For type I mode, multiple sub-types of binding sites can occur, as the grooves are not identical (See Fig. 4). Their local chemical environment in the context of an amyloid fibril depends on the exposed side-chain types of the β-strands, the registry (parallel, antiparallel and mixed) between the neighboring β-strands, on the stacking between the β-sheets for forming a protofilament and on the association of protofilaments for forming a fibril. Hence the local chemical environment determines the binding specificity of a type of amyloid dye for a particular type of amyloid fibrils. A given type of amyloid dye could only have access to a subset of all the possible grooves of a particular fibril,8 while a different type of amyloid dye could have access to a different subset of the grooves of this same fibril type. In the case of the simple antiparallel β-sheet of the Aβ16-22 peptide protofibril studied here, ThT is seen to bind to two types of central grooves with a large binding affinity difference (-6.3 kcal/mol between the site A and the site B in Figure 4). With a small chemical modification to form BTA-1 from ThT, BTA-1 binds to two additional types of side grooves (sites D and E of Figure 4). We note that some regular grooves could be modulated by docked irregular peptides and/or defects in the β-sheet, as suggested by experimental38; 39 and MD 40 studies.
A recent experimental study24 provides evidence for three distinct binding sites for the thioflavin T class of amyloid dyes on the Aβ40 fibrils, with stoichiometry of these sites to the Aβ peptide of 1:300, 1:4 and 1:35 (Table 1). The experimental binding affinities of ThT on the three sites are ∼1610 nM, ∼6000 nM (1:6)34 and ∼750 nM, respectively, while those of BTA-1 are ∼19.5 nM, ND (not determined) and ∼200 nM, respectively. While the details of the protofibril structures are different for Aβ40 and Aβ16-22 (there is an additional β-strand (A30-V39) and the two β-strands form a U shape with parallel registry in Aβ40, as opposed to the antiparallel registry in Aβ16-22 fibrils), the binding modes seen in our simulations are generic to the β-sheets found in all amyloid structures. In both Aβ40 and Aβ16-22 fibrils, the 16-22 KLVFFAE segment is in a β-strand configuration as part of a β-sheet. Our simulations hence allow us to identify the experimentally determined binding sites. Based on stoichiometry, and the fact that we see a large enhancement (∼-10 kcal/mol) of the binding energy upon changing ThT to BTA-1 in our simulations (the same trend as the experimental ∼80 fold increase in binding affinity change), we assign binding at the ends of the β-sheet (mode C in Figure 4) to the low density site (1:300) (type 2 binding mode). Similarly, we assign the grooves (side grooves and central grooves) on the same sheet-layer to the high density sites (1:4 or 1:35) (type 1 binding mode). These grooves correspond to hydrophobic pockets located in close proximity. This is consistent with the inference (based on the increase of intrinsic fluorescence of the dyes upon binding and additional fluorescence energy transfer studies), that the two high density sites seen in experiment correspond to adjacent or partially overlapped sites in hydrophobic pockets.24 Solid state NMR studies by Tycko and co-workers26 indicate that the Aβ fibrils posses two such hydrophobic β-sheet regions, the first located between residues 17-21 (as in the Aβ16-22 fibril) and the second between residues 30-40. It is hence likely that in the context of the full length Aβ peptide, the type I binding mode corresponds to binding at the hydrophobic grooves of sheets 17-21 and 30-40. (Our unpublished preliminary results of the binding of ThT to the full Aβ protofibril confirm this binding mode).
Our simulations are performed at an effective concentration below the critical micellar concentration of ThT. Our simulations show that ThT can bind in a monomeric form, in agreement with the work of Krebs et al.4. In one of our simulations, BTA-1 bound to the fibril as a dimer (Fig 4F), a scenario consistent with the work of Groenning5; 6, with a mechanism involving the initial binding of the monomer, followed by the binding of a second BTA-1 monomer. Khurana et al.7 report atomic force microscopy (AFM) measurements in which 3nm micelles of ThT are seen bound to amyloid fibrils. Because their experiments were performed at ∼4 μM7, well below the critical micellar concentration of ∼35 μM8, it is unlikely that the micelles bound in a pre-formed manner to the fibril. Rather, our simulations suggest that the AFM experiments may be explained as follows: Binding to the fibrils would occur with ThT in a monomeric form. This would be followed by lateral stacking of additional ThT molecules to the bound ThT to form an oligomer with height of 3 nm containing up to 7 monomers (the thickness of a ThT is ∼4.3 Ǻ). The rotation of the ThT molecules along the lateral axis (Fig. 4F) leads to a circular shape consistent with the circular 2D projections observed in AFM experiments. The formation of such a bound aggregate would occur for a lower concentration of ThT than in the bulk and more rapidly, due to the reduction in mobility of ThT upon binding to the β-sheet surface (i.e. reducing the entropic barrier for further association). Our proposed mechanism, in which initial monomer binding can be followed by stacking of other ThT molecules offers an alternative explanation for the fluorescence enhancement of ThT. This new pictures unifies previously proposed mechanisms (namely enhanced fluorescence via: reduction of the internal motion of monomeric ThT by binding to the grooves4 of the fibril, excimer formation by ThT dimerization5; 6 or hydrogen bonding of a ThT micelle7 to the fibril).
Our simulation results might also shed light on the structural feature of early Aβ oligomers. These oligomers are increasingly believed to play a critical role in the pathology of AD, but little is known about the structure of these early aggregates. Recent studies41; 42 shows that ThT and Congo red analogs detect Aβ oligomers in vitro and in vivo and, based on binding ratio and affinity, that these oligomers may have the same two types of binding sites as the Aβ40 fibrils.41 Since our simulations indicate that the two binding modes correspond to binding to the β-sheets of the fibrils, this implicitly suggests that the oligomers also have a certain degree of β-sheet structure. In other words, the conformational transition from a random-coil to an extended β-sheet might already be partially completed in the oligomers. Further study on oligomerization is required to clarify this issue.
Finally, the structure-activity relationship upon mutating ThT to BTA-1 in term of solubility and binding affinity was studied. By removing the charge on ThT, BTA-1 remained quite soluble in water as indicated by the favorable solvation free energy -5.3 kcal/mol, but its hydrophobicity was nonetheless significantly increased by 73.0 kcal/mol (Table 4) leading to higher tendency to form small oligomers (such as the dimer seen in our simulations). In terms of binding, it is interesting to note that the positively charged ThT bound to hydrophobic and aromatic residues rather than to negatively charged residues, indicating that the ring-ring and hydrophobic interactions rather than the salt-bridges are the stabilizing forces for ligand binding. Indeed, by removing the charge and a methyl group of ThT, the overall binding energy of BTA-1 increased by ∼-16 kcal/mol in the MM-GBSA calculation, which is in qualitative agreement with experimental measurements (∼-3 kcal/mol). In addition, shape-complementary (ligand + groove) is an additional factor contributing to stabilizing binding as evidenced by the fact that BTA-1 has stronger binding affinity (20 nM) than neutral BTA-2 and BTA-0 (140 nM and 30 nM), which have 2 and 0 methyl groups respectively connecting to the aniline nitrogen14 (See Figure 1, left hand side of ligand). In other words, two methyl groups might block the insertion of the dye into the shallow grooves, but the complete absence of methyl groups would in turn weaken the hydrophobic interaction, both scenarios resulting in weaker binding affinities than in the case of BTA-1. As a general rule, amyloid dyes have a linear structure, and our simulations are consistent with a mechanism in which this linear structure facilitates their fit in the linear grooves of amyloid fibrils.
In conclusion, the simulations presented here have provided detailed information about the properties of amyloid dyes and their binding to β-sheet enriched amyloid aggregates, augmenting our knowledge from experimental studies.
Materials and Methods
System preparation
Our binding simulation system consisted of a 16-peptide oligomer (representing a protofibril), four ligand molecules and ∼9100 water molecules, with an additional four chloride ions in the case of the positively charged ThT (Table 5, ID 5-6). The 16-peptide oligomer was constructed from the seven-residue Aβ16-22 peptide fragment (N-Acetyl-KLVFFAE-NH2) arranged in a double-layered β-sheet structure. Each layer consists of 8 anti-parallel in-register β-strands, the arrangement suggested by solid NMR experiment.11; 12 The two layers could be stacked in parallel or in antiparallel, with the inter-layer hydrophobic core formed between the hydrophobic residues from the upper and lower layer, respectively, in three ways: [-V-F-, -V-F-], [-L-F-A-, -L-F-A-] and [-V-F-, -L-F-A-].43 The parallel arrangement with the mixed interface pattern [-V-F-, -L-F-A-] was shown to form stable and well-aligned aggregates in a previous simulation study43 and was used in this study (Fig. 2A). This construct has the additional advantage of enabling the simultaneously study of the binding of the amyloid dyes to the two different types of β-sheet surfaces (Fig. 2B-C). The dimensions of the peptide oligomer were ∼70×25×20 Å3 in the directions of β-sheet extension (main chain hydrogen bond direction), β-sheet stacking (perpendicular to the β-sheet surface), and β-strand, respectively. Four dye molecules were initially placed ∼10 Å away from the 16-peptide oligomer along the two directions: the β-sheet extension and β-sheet stacking directions (two molecules for each direction). In the case of ThT, four negative chloride ions (Cl-) were added to neutralize the four negative charges carried by the four ThT molecules. The solute molecules were immersed into a rectangular box of ∼9,100 water molecules with dimensions of 97×75×58 Å3. The periodic water box was constructed in such a way that the solute was at least ∼8 Å away from the box surface and the minimum distance between the solute and the image was ∼16 Å. The apparent concentrations of dye molecule and the peptide oligomer were ∼15.7 mM and ∼3.9 mM, respectively, but the effective concentrations are much lower due to the small number of molecules in the periodic box in the simulations. We estimate the effective concentration of ThT to be below 35 μM of CMC, which is likely why no ThT oligomers are formed in the simulations. The advantage of using four dye molecules in each simulation system is that it allows sampling of four conformations in a single trajectory and thus enhances sampling in comparison to systems with a single dye molecule (i.e four simulations on a system with four dye molecules are equivalent to 16 simulations a system with one dye molecule).44
The Duan et al all-atom point-charge force field45 (AMBER ff03) was chosen to represent the peptide. The solvent was explicitly represented by the TIP3P46 water model. The parameters for ThT were obtained from a previous study.33 Following the same protocol, the parameters for BTA-1 were developed as follows: after geometry optimization at HF/6-31G* level, the partial charges were derived by fitting to the gas-phase electrostatic potential calculated at HF/6-31G* level of quantum mechanical theory using RESP (Restrained ElectroStatic Potential) method47 and other force parameters of BTA-1 molecule were taken from the AMBER GAFF48 parameter set. The parameter files in AMBER format are available upon request.
Binding Simulations
The AMBER 8 simulation package48 was used in both molecular dynamics simulations and data processing. The ligand-protofibril-water system was subjected to periodic boundary conditions via both minimum image and discrete Fourier transform as part of the Particle Mesh Ewald method.9 After the initial energy minimization, a total of eight simulations (four runs for each dye) were performed with different initial random velocities. The initial velocities were generated according to the Maxwell-Boltzmann's distribution at 500 K. The simulations started after a 10.0 ps run at 500 K to randomize the orientations and positions of the four dye molecules. A short 1.0 ns molecular dynamics at 320K in the NPT ensemble (constant pressure and temperature) was performed to adjust system size and density, and to equilibrate the solvent. The simulations were continued at 320K for 19 ns in the NVT ensemble (constant volume and temperature). The elevated temperature (10 K higher than 37° C) was used in the simulations to enhance the hydrophobic effect. Particle-mesh Ewald method9 was used to treat the long-range electrostatic interactions. SHAKE49 was applied to constrain all bonds connecting hydrogen atoms and a time step of 2.0 fs was used. In order to reduce the computation, non-bonded forces were calculated using a two-stage RESPA approach50 where the forces within a 10 Å radius were updated every step and those beyond 10 Å were updated every two steps. Temperature was controlled at 320 K by using Berendsen's algorithm51 with a coupling constant of 2.0 ps. The center of mass translation and rotation were removed every 500 steps. Studies have shown this removes the “block of ice” problem.52; 53 The trajectories were saved at 2.0 ps intervals for further analysis. The strategy of using higher solute concentration and elevated temperature (320 K) used in this study has successfully been exploited previously to reduce the computational cost associated with simulating peptide association54; 55; 56 and ligand binding.44 The combined reduction in the computational cost due to the elevation of concentration of ligand and protein is expected to be close to six orders of magnitude (103×103). Nonetheless, 32 Opteron (2.2 GHz) CPUs were used for ∼40 days to complete the eight binding simulations.
Solvation free energy calculation
The calculation of the solvation free energy of a ligand was broken down into the two steps as shown in Figure 5: 1). Mutation of a ligand in gas phase into a dummy molecule by turning off non-bonded interactions (electrostatic and Lennard-Jones's (LJ) interactions) within the ligand; 2.) Mutation of the ligand in water into a dummy molecule by turning off the non-bonded interactions between the water molecules and the ligand, as well as within the ligand. For each step, two sets of parallel calculations were done to get the electrostatic and the LJ's parts of the free energy. The electrostatic interactions were turned off by removing the partial charges on the ligand, and the LJ's interactions were turned off by using the λ-dependent soft core (SC) potential implemented in AMBER 1057:
Figure 5.

Thermocycle used to calculate the absolute solvation free energy.
| (1) |
in which ε is well-depth, σ is inter-atom distance at zero LJ potential, r is the inter-atom distance, and α is an adjustable constant set to 0.5 in this study. The perturbation (λ=0→1) started from full non-bonded interactions (λ=0) and ended at null non-bonded interactions (λ=1), and each set of calculations consisted of 12 λ windows (see Table 5). The free energy change was obtained by thermodynamic integration (TI) with Gaussian integration scheme over 12 λ windows.58 The free energy change is given by the expression:
Table 5.
Simulated systems.
| ID | Content | Num. of water molecules | Box dimensions (Å3) | Ligand Concentration (mM) | Num. of simulations | Length of each (ns) |
|---|---|---|---|---|---|---|
| 1 | ThT++Cl- | – | – | – | 2 × 12 λ a | 6 |
| 2 | ThT++Cl- | 771 | 33×33×33 | – | 2 × 12 λ a | 6 |
| 3 | BTA-1 | – | – | – | 2 × 12 λ a | 6 |
| 4 | BTA-1 | 597 | 31×31×31 | – | 2 × 12 λ a | 6 |
| 5 | Protofibril b + 4ThT++4Cl- | 9106 | 97×75×58 | 15.7 | 4 | 20 |
| 6 | Protofibril b + 4BTA-1 | 9096 | 99×75×57 | 15.7 | 4 | 20 |
To obtain the solvation free energy, the thermo-integration simulations were conducted with 12 λ windows for Gaussian integration. Set 1: electrostatic interaction, Set 2: Lennard-Jones interaction; λ={0.00922 0.99078 0.04794 0.95206 0.11505 0.88495 0.20634 0.79366 0.31608 0.68392 0.43738 0.56262}.
The protofibril consists of two β-sheets stacked in parallel, each composed of 8 Aβ16-22 peptides in antiparallel registry, for a total of 16 peptides.
| (2) |
where the angular brackets denote an ensemble average, using V (λ) as the potential, and Wi is the weight in Gaussian integration. The simulation protocol is the same as the one in the binding simulation except for a few differences: the solvated simulations were done in NPT ensemble; a Langevin thermostat59 with a collision frequency of 2 ps-1 was employed to keep the system temperature at 310 K. To keep system neutral in the perturbation, the solvation free energy of ThT plus its counter ion (Cl-) was calculated instead.
Clustering analysis
To gain a clearer understanding of the binding interactions, the bound complexes are grouped into different structural clusters based on the Root Mean Square Deviation (RMSD) of the dye molecule (cutoff of 5 Å), after aligning the protofibril.44 A representative structure (the centroid) of the top 15 abundant clusters from the combined 4 simulation runs for each dye is shown in the Supplementary Material (Fig. S2-S3). In the second level of clustering, the clusters having the same binding site regardless dye pose are further merged into a super cluster (Fig. 4).
Binding energy calculation
A binding site is identified from the above two-level clustering analysis. The binding energy of a dye molecule to the protofibril in each site (Fig. 4) is evaluated on the centroids of the multiple structural clusters contained in a super cluster using the MM-GBSA (Molecular Mechanics-Generalized Born/Surface Area) module60 in AMBER package in which the solvation free energy is represented by the Generalized Born term (the polar part of the solvation) and a Surface Area term (the apolar part of the solvation free energy). Although the MM-GBSA calculations may overestimate the absolute binding free energy due to missing entropic terms (e.g. translation, rotation and conformational entropy change of the solute upon binding), they usually give a reasonable estimate of the relative binding free energy when the entropic change of two binding sites are comparable.60; 61 We attempted to calculate the binding free energies using the more accurate Thermodynamic Integration method, however, this method showed significant convergence problems associated with the large size of the complex systems studied.
Supplementary Material
Acknowledgments
This project is funded by the David and Lucile Packard Foundation, the NSF (MCB 0642086 to JSE) and the NIH (AG027818 to MB). The computer time is provided by genbeo cluster of the Genome Center of UC davis and lonestar cluster in Texas Advanced Computing Center (LRAC MCA 05S027). We thank Dr. Thomas Steinbrecher for providing the code on softcore potential and Dr. Cathreine Carpenter for help formatting the manuscript.
References
- 1.Chiti F, Dobson CM. Protein misfolding, functional amyloid, and human disease. Annual Review of Biochemistry. 2006;75:333–366. doi: 10.1146/annurev.biochem.75.101304.123901. [DOI] [PubMed] [Google Scholar]
- 2.Dobson CM. Principles of protein folding, misfolding and aggregation. Seminars in Cell & Developmental Biology. 2004;15:3–16. doi: 10.1016/j.semcdb.2003.12.008. [DOI] [PubMed] [Google Scholar]
- 3.Furumoto S, Okamura N, Iwata R, Yanai K, Arai H, Kudo Y. Recent advances in the development of amyloid Imaging agents. Current Topics in Medicinal Chemistry. 2007;7:1773–1789. doi: 10.2174/156802607782507402. [DOI] [PubMed] [Google Scholar]
- 4.Krebs MRH, Bromley EHC, Donald AM. The binding of thioflavin-T to amyloid fibrils: localisation and implications. Journal of Structural Biology. 2005;149:30–37. doi: 10.1016/j.jsb.2004.08.002. [DOI] [PubMed] [Google Scholar]
- 5.Groenning M, Olsen L, van de Weert M, Flink JM, Frokjaer S, Jorgensen FS. Study on the binding of Thioflavin T to β-sheet-rich and non-β-sheet cavities. Journal of Structural Biology. 2007;158:358–369. doi: 10.1016/j.jsb.2006.12.010. [DOI] [PubMed] [Google Scholar]
- 6.Groenning M, Norrman M, Flink JM, van de Weert M, Bukrinsky JT, Schluckebier G, Frokjaer S. Binding mode of Thioflavin T in insulin amyloid fibrils. Journal of Structural Biology. 2007;159:483–497. doi: 10.1016/j.jsb.2007.06.004. [DOI] [PubMed] [Google Scholar]
- 7.Khurana R, Coleman C, Ionescu-Zanetti C, Carter SA, Krishna V, Grover RK, Roy R, Singh S. Mechanism of thioflavin T binding to amyloid fibrils. Journal of Structural Biology. 2005;151:229–238. doi: 10.1016/j.jsb.2005.06.006. [DOI] [PubMed] [Google Scholar]
- 8.Sabate R, Lascu I, Saupe S. On the binding of Thioflavin-T to HET-s amyloid fibrils assembled at pH2. Journal of Structural Biology. 2008;162:387–396. doi: 10.1016/j.jsb.2008.02.002. [DOI] [PubMed] [Google Scholar]
- 9.Essmann U, Perera L, Berkowitz ML, Darden TA, Lee H, Pedersen LG. A smooth particle mesh Ewald method. J Chem Phys. 1995;103:8577–8593. [Google Scholar]
- 10.De Felice FG, Vieira MNN, Saraiva LM, Figueroa-Villar JD, Garcia-Abreu J, Liu R, Chang L, Klein WL, Ferreira ST. Targeting the neurotoxic species in Alzheimer's disease: inhibitors of Aβ oligomerization. Faseb J. 2004;18:1366–1372. doi: 10.1096/fj.04-1764com. [DOI] [PubMed] [Google Scholar]
- 11.Balbach JJ, Ishii Y, Antzutkin ON, Leapman RD, Rizzo NW, Dyda F, Reed J, Tycko R. Amyloid fibril formation by Aβ(16-22), a seven-residue fragment of the Alzheimer's β-amyloid peptide, and structural characterization by solid state NMR. Biochemistry. 2000;39:13748–13759. doi: 10.1021/bi0011330. [DOI] [PubMed] [Google Scholar]
- 12.Petkova AT, Buntkowsky G, Dyda F, Leapman RD, Yau WM, Tycko R. Solid state NMR reveals a pH-dependent antiparallel β-sheet registry in fibrils formed by a β-amyloid peptide. Journal of Molecular Biology. 2004;335:247–260. doi: 10.1016/j.jmb.2003.10.044. [DOI] [PubMed] [Google Scholar]
- 13.LeVine H. Quantification of β-sheet amyloid fibril structures with thioflavin T. Amyloid, Prions, and Other Protein Aggregates. 1999;309:274–284. doi: 10.1016/s0076-6879(99)09020-5. [DOI] [PubMed] [Google Scholar]
- 14.Klunk WE, Wang YM, Huang GF, Debnath ML, Holt DP, Mathis CA. Uncharged thioflavin-T derivatives bind to amyloid-β protein with high affinity and readily enter the brain. Life Sciences. 2001;69:1471–1484. doi: 10.1016/s0024-3205(01)01232-2. [DOI] [PubMed] [Google Scholar]
- 15.Mathis CA, Wang YM, Holt DP, Huang GF, Debnath ML, Klunk WE. Synthesis and evaluation of C-11-labeled 6-substituted 2-arylbenzothiazoles as amyloid imaging agents. Journal of Medicinal Chemistry. 2003;46:2740–2754. doi: 10.1021/jm030026b. [DOI] [PubMed] [Google Scholar]
- 16.Mathis CA, Holt DP, Wang Y, Huang GF, Debnath ML, Klunk WE. A lipophilic C-11-labeled derivative of thioflavin-T for amyloid assessments in Alzheimer's disease. Journal of Nuclear Medicine. 2001;42:113P–113P. [Google Scholar]
- 17.Mathis C, Holt D, Wang YM, Huong GF, Debnath M, Klunk W. Evaluation of a potent thioflavin-T analog for in vivo imaging of amyloid with PET. Neurobiology of Aging. 2002;23:S349–S349. [Google Scholar]
- 18.Mathis CA, Holt DP, Wang Y, Huang GF, Debnath ML, Klunk WE. F-18-labeled thioflavin-T analogs for amyloid assessment. Journal of Nuclear Medicine. 2002;43:166P–166P. [Google Scholar]
- 19.Mathis CA, Wang Y, Huang GF, Holt DP, Debnath ML, Klunk WE. Radioiodinated thioflavin-T derivative for imaging amyloid. Journal of Nuclear Medicine. 2002;43:359P–359P. [Google Scholar]
- 20.Mathis CA, Bacskai BJ, Kajdasz ST, McLellan ME, Frosch MP, Hyman BT, Holt DP, Wang YM, Huang GF, Debnath ML, Klunk WE. A lipophilic thioflavin-T derivative for positron emission tomography (PET) Imaging of amyloid in brain. Bioorganic & Medicinal Chemistry Letters. 2002;12:295–298. doi: 10.1016/s0960-894x(01)00734-x. [DOI] [PubMed] [Google Scholar]
- 21.Mathis C, Holt D, Wang YM, Huang GF, Debnath M, Klunk W. Development of thioflavin-T analogs for amyloid imaging with PET. Neurobiology of Aging. 2004;25:248–248. [Google Scholar]
- 22.Mathis C, Holt D, Wang YM, Huang GF, Debnath M, Klunk W. Evaluation of a potent thioflavin-T analog for in vivo imaging of amyloid with PET. Neurobiology of Aging. 2004;25:248–249. [Google Scholar]
- 23.Pike KE, Savage G, Villemagne VL, Ng S, Moss SA, Maruff P, Mathis CA, Klunk WE, Masters CL, Rowe CC. β-amyloid imaging and memory in non-demented individuals: evidence for preclinical Alzheimer's disease. Brain. 2007;130:2837–2844. doi: 10.1093/brain/awm238. [DOI] [PubMed] [Google Scholar]
- 24.Lockhart A, Ye L, Judd DB, Merritt AT, Lowe PN, Morgenstern JL, Hong GZ, Gee AD, Brown J. Evidence for the presence of three distinct binding sites for the thioflavin T class of Alzheimer's disease PET imaging agents on β-amyloid peptide fibrils. Journal of Biological Chemistry. 2005;280:7677–7684. doi: 10.1074/jbc.M412056200. [DOI] [PubMed] [Google Scholar]
- 25.Buchete NV, Tycko R, Hummer G. Molecular dynamics simulations of Alzheimer's β-amyloid protofilaments. Journal of Molecular Biology. 2005;353:804–821. doi: 10.1016/j.jmb.2005.08.066. [DOI] [PubMed] [Google Scholar]
- 26.Petkova AT, Ishii Y, Balbach JJ, Antzutkin ON, Leapman RD, Delaglio F, Tycko R. A structural model for Alzheimer's β-amyloid fibrils based on experimental constraints from solid state NMR. Proceedings of the National Academy of Sciences of the United States of America. 2002;99:16742–16747. doi: 10.1073/pnas.262663499. [DOI] [PMC free article] [PubMed] [Google Scholar]
- 27.Gnanakaran S, Nussinov R, Garcia AE. Atomic-level description of amyloid β-dimer formation. Journal of the American Chemical Society. 2006;128:2158–2159. doi: 10.1021/ja0548337. [DOI] [PubMed] [Google Scholar]
- 28.Favrin G, Irback A, Mohanty S. Oligomerization of amyloid Aβ(16-22) peptides using hydrogen bonds and hydrophobicity forces. Biophysical Journal. 2004;87:3657–3664. doi: 10.1529/biophysj.104.046839. [DOI] [PMC free article] [PubMed] [Google Scholar]
- 29.Klimov DK, Straub JE, Thirumalai D. Aqueous urea solution destabilizes Aβ(16-22) oligomers. Proceedings of the National Academy of Sciences of the United States of America. 2004;101:14760–14765. doi: 10.1073/pnas.0404570101. [DOI] [PMC free article] [PubMed] [Google Scholar]
- 30.Nguyen PH, Li MS, Stock G, Straub JE, Thirumalai D. Monomer adds to preformed structured oligomers of Aβ-peptides by a two-stage dock-lock mechanism. Proceedings of the National Academy of Sciences of the United States of America. 2007;104:111–116. doi: 10.1073/pnas.0607440104. [DOI] [PMC free article] [PubMed] [Google Scholar]
- 31.Ma BY, Nussinov R. Stabilities and conformations of Alzheimer's β-amyloid peptide oligomers (Aβ(16-22′) Aβ(16-35′) and Aβ(10-35)): Sequence effects. Proceedings of the National Academy of Sciences of the United States of America. 2002;99:14126–14131. doi: 10.1073/pnas.212206899. [DOI] [PMC free article] [PubMed] [Google Scholar]
- 32.Soto P, Griffin MA, Shea JE. New insights into the mechanism of Alzheimer amyloid-β fibrillogenesis inhibition by N-methylated peptides. Biophysical Journal. 2007;93:3015–3025. doi: 10.1529/biophysj.107.112086. [DOI] [PMC free article] [PubMed] [Google Scholar]
- 33.Wu C, Wang ZX, Lei HX, Zhang W, Duan Y. Dual binding modes of Congo red to amyloid protofibril surface observed in molecular dynamics simulations. Journal of the American Chemical Society. 2007;129:1225–1232. doi: 10.1021/ja0662772. [DOI] [PubMed] [Google Scholar]
- 34.Levine H. Multiple ligand binding sites on Aβ(1-40) fibrils. Amyloid-Journal of Protein Folding Disorders. 2005;12:5–14. doi: 10.1080/13506120500032295. [DOI] [PubMed] [Google Scholar]
- 35.Levine H. Thioflavine-T Interaction with Amyloid β-Sheet Structures. Amyloid-International Journal of Experimental and Clinical Investigation. 1995;2:1–6. [Google Scholar]
- 36.Klunk WE, Pettegrew JW, Abraham DJ. Quantitative-Evaluation of Congo Red Binding to Amyloid-Like Proteins with a β-Pleated Sheet Conformation. Journal of Histochemistry & Cytochemistry. 1989;37:1273–1281. doi: 10.1177/37.8.2666510. [DOI] [PubMed] [Google Scholar]
- 37.Klunk WE, Jacob RF, Mason RP. Quantifying amyloid β-peptide (Aβ) aggregation using the Congo red Aβ (CR-Aβ) spectrophotometric assay. Analytical Biochemistry. 1999;266:66–76. doi: 10.1006/abio.1998.2933. [DOI] [PubMed] [Google Scholar]
- 38.Wetzel R. Ideas of order for amyloid fibril structure. Structure. 2002;10:1031–1036. doi: 10.1016/s0969-2126(02)00809-2. [DOI] [PubMed] [Google Scholar]
- 39.Esler WP, Stimson ER, Jennings JM, Vinters HV, Ghilardi JR, Lee JP, Mantyh PW, Maggio JE. Alzheimer's disease amyloid propagation by a template-dependent dock-lock mechanism. Biochemistry. 2000;39:6288–6295. doi: 10.1021/bi992933h. [DOI] [PubMed] [Google Scholar]
- 40.Takeda T, Klimov DK. Temperature-induced dissociation of Aβ monomers from amyloid fibril. Biophysical Journal. 2008;95:1758–1772. doi: 10.1529/biophysj.108.131698. [DOI] [PMC free article] [PubMed] [Google Scholar]
- 41.Maezawa I, Hong H, Liu R, Wu C, Cheng RH, Kung M, Kung HF, Lam KS, Oddo S, LaFela FM, Jin L. Congo red and thioflavin-T analogs detect Ab oligomers. Journal of Neurochemistry. 2008;104:457–468. doi: 10.1111/j.1471-4159.2007.04972.x. [DOI] [PubMed] [Google Scholar]
- 42.Chimon S, Ishii Y. Capturing intermediate structures of Alzheimer's β-amyloid, Aβ(1-40), by solid-state NMR spectroscopy. Journal of the American Chemical Society. 2005;127:13472–13473. doi: 10.1021/ja054039l. [DOI] [PubMed] [Google Scholar]
- 43.Rohrig UF, Laio A, Tantalo N, Parrinello M, Petronzio R. Stability and structure of oligomers of the Alzheimer peptide Aβ(16-22): From the dimer to the 32-mer. Biophysical Journal. 2006;91:3217–3229. doi: 10.1529/biophysj.106.088542. [DOI] [PMC free article] [PubMed] [Google Scholar]
- 44.Wu C, Lei H, Wang ZX, Zhang W, Duan Y. Phenol red interacts with the protofibril-like oligomers of an amyloidogenic hexapeptide NFGAIL through both hydrophobic and aromatic contacts. Biophys J. 2006;91:3664–3672. doi: 10.1529/biophysj.106.081877. [DOI] [PMC free article] [PubMed] [Google Scholar]
- 45.Duan Y, Chowdhury S, Xiong G, Wu C, Zhang W, Lee T, Cieplak P, Caldwell J, Luo R, Wang J, Kollman PA. A point-charge force field for molecular mechanics simulations of proteins based on condensed-phase QM calculations. J Comp Chem. 2003;24:1999–2012. doi: 10.1002/jcc.10349. [DOI] [PubMed] [Google Scholar]
- 46.Jorgensen WL, Chandrasekhar J, Madura JD, Impey RW, Klein ML. Comparisons of simple potential functions for simulating liquid water. J Chem Phys. 1983;79:926–935. [Google Scholar]
- 47.Bayly CI, Cieplak P, Cornell WD, Kollman PA. A Well-Behaved Electrostatic Potential Based Method Using Charge Restraints for Deriving Atomic Charges - the Resp Model. J Phys Chem. 1993;97:10269–10280. [Google Scholar]
- 48.Wang JM, Wolf RM, Caldwell JW, Kollman PA, Case DA. Development and testing of a general amber force field. J Comp Chem. 2004;25:1157–1174. doi: 10.1002/jcc.20035. [DOI] [PubMed] [Google Scholar]
- 49.Ryckaert JP, Ciccotti G, Berendsen HJC. Numerical Integration of the Cartesian Equations of Motion of a System with Constraints: Molecular Dynamics of n-Alkanes. J Chem Phys. 1977;23:327–341. [Google Scholar]
- 50.Procacci P, Berne BJ. Multiple Time-Scale Methods For Constant-Pressure Molecular-Dynamics Simulations Of Molecular-Systems. Mol Phys. 1994;83:255–272. [Google Scholar]
- 51.Berendsen HJC, Postma JPM, van Gunsteren WF, DiNola A, Haak JR. Molecular Dynamics with coupling to an external bath. J Chem Phys. 1984;81:3684–3690. [Google Scholar]
- 52.Chiu SW, Clark M, Subramaniam S, Jakobsson E. Collective motion artifacts arising in long-duration molecular dynamics simulations. J Comp Chem. 2000;21:121–131. [Google Scholar]
- 53.Harvey SC, Tan RKZ, Cheatham TE. The flying ice cube: Velocity rescaling in molecular dynamics leads to violation of energy equipartition. J Comp Chem. 1998;19:726–740. [Google Scholar]
- 54.Wu C, Lei H, Duan Y. Formation of partially-ordered oligomers of amyloidogenic hexapeptide (NFGAIL) in aqueous solution observed in molecular dynamics simulations. Biophys J. 2004;87:3000–3009. doi: 10.1529/biophysj.104.047076. [DOI] [PMC free article] [PubMed] [Google Scholar]
- 55.Wu C, Lei H, Duan Y. The role of Phe in the formation of well-ordered oligomers of amyloidogenic hexapeptide (NFGAIL) observed in molecular dynamics simulations with explicit solvent. Biophys J. 2005;88:2897–2906. doi: 10.1529/biophysj.104.055574. [DOI] [PMC free article] [PubMed] [Google Scholar]
- 56.Wu C, Lei H, Duan Y. Elongation of Ordered Peptide Aggregate of an Amyloidogenic Hexapeptide (NFGAIL) Observed in Molecular Dynamics Simulations with Explicit Solvent. J Am Chem Soc. 2005;127:13530–13537. doi: 10.1021/ja050767x. [DOI] [PubMed] [Google Scholar]
- 57.Steinbrecher T, Mobley DL, Case DA. Nonlinear scaling schemes for Lennard-Jones interactions in free energy calculations. Journal of Chemical Physics. 2007;127 doi: 10.1063/1.2799191. [DOI] [PubMed] [Google Scholar]
- 58.Hummer G, Szabo A. Calculation of free-energy differences from computer simulations of initial and final states. Journal of Chemical Physics. 1996;105:2004–2010. [Google Scholar]
- 59.Chandrasekhar S. Stochastic problems in physics and astronomy. Rev Mod Phys. 1943;15:1–89. [Google Scholar]
- 60.Kollman PA, Massova I, Reyes C, Kuhn B, Huo S, Chong L, Lee M, Lee T, Duan Y, Wang W, Donini O, Cieplak P, Srinivasan J, Case DA, Cheatham TE., III Calculating Structures and Free Energies of Complex Molecules: Combining Molecular Mechanics and Continuum Models. Acc Chem Res. 2000;33:889–897. doi: 10.1021/ar000033j. [DOI] [PubMed] [Google Scholar]
- 61.Gilson MK, Zhou HX. Calculation of protein-ligand binding affinities. Annual Review of Biophysics and Biomolecular Structure. 2007;36:21–42. doi: 10.1146/annurev.biophys.36.040306.132550. [DOI] [PubMed] [Google Scholar]
Associated Data
This section collects any data citations, data availability statements, or supplementary materials included in this article.