

Abstract
This study examined the impact of task-irrelevant affective information on early visual processing regions V1 through V4. Fearful and neutral faces presented with rings of different colors were used as stimuli. During the conditioning phase, fearful faces presented with a certain ring color (e.g., black) were paired with mild electrical stimulation. Neutral faces shown with rings of that color, as well as fearful or neutral faces shown with another ring color (e.g., white), were never paired with shock. Our findings revealed that fearful faces evoked enhanced blood oxygen level dependent (BOLD) responses in V1 and V4 compared to neutral faces. Faces embedded in a color ring that was paired with shock (e.g., black) evoked greater BOLD responses in V1 to V4 compared to a ring color that was never paired with shock (e.g., white). Finally, BOLD responses in early visual cortex were tightly interrelated (i.e., correlated) during an affectively potent context (i.e., ring color) but not during a neutral one, suggesting that increased functional integration was present with affective learning. Taken together, the results suggest that task-irrelevant affective information not only influences evoked responses in early, retinotopically organized visual cortex, but also determines the pattern of responses across early visual cortex.
Keywords: primary visual cortex, conditioning, faces, vision, emotion, fMRI
Accumulating evidence shows that the processing of affectively significant visual objects is prioritized (Compton, 2003; Vuilleumier, 2005). Affective stimuli have dominance in visual awareness (Alpers & Gerdes, 2007; Alpers & Pauli, 2006), are processed faster (Stolarova, Keil, & Moratti, 2006) and are more likely to be processed when only limited resources are available (Anderson, 2005; Anderson & Phelps, 2001). Neuroanatomical connections between orbitofrontal cortex (OFC), and both the ventral and dorsal visual streams (Barbas, 1988, 1995; Carmichael & Price, 1995; Cavada, Company, Tejedor, Cruz-Rizzolo, & Reinoso-Suarez, 2000), as well as projections from the amygdala all along the ventral stream (Amaral, Behniea, & Kelly, 2003; Amaral, Price, Pitkänen, & Carmichael, 1992), suggest that affective brain regions functionally modulate visual processing regions (Barrett & Bar, 2009; Duncan & Barrett, 2007; Lang, et al., 1998; Pessoa & Ungerleider, 2004; Vuilleumier, 2005). There is accumulating neuroimaging evidence that objects with affective value receive enhanced visual processing even in early, retinotopically organized cortex (e.g., V1 through V4). Both affectively salient images (Lane, Chua, & Dolan, 1999; Lang, et al., 1998; Mourão-Miranda, et al., 2003) and faces (Büchel, Morris, Dolan, & Friston, 1998; Vuilleumier, Richardson, Armony, Driver, & Dolan, 2004) evoke enhanced blood oxygen level dependent (BOLD) responses in early visual areas. A recent meta-analytic investigation summarizing fMRI and PET studies of emotion published from 1990 to 2005 confirmed that visual processing areas are consistently activated in response to affectively potent as compared with neutral stimuli (Kober, et al., 2008; see Figure 2 in Wager, et al., 2008).
Recent studies have examined how learning the association between a neutral stimulus and electrical stimulation affects associated responses in early sensory areas more generally. For instance, Li and colleagues (2008) reported that pairing an odor with electrical stimulation changed the pattern of activity in primary olfactory cortex and enabled participants to discriminate previously indiscriminable odors. In a related study, Padmala and Pessoa (2008) paired the presence of a near-threshold visual patch with electrical stimulation during an initial conditioning phase. In a subsequent experimental phase, participants were better at detecting the visual stimulus when it was predictive of electrical stimulation, a result that was paralleled by increased signal changes in V1, as well as other retinotopically organized visual areas. Related studies have capitalized on the fine temporal resolution of EEG to address analogous questions (e.g., Harald T. Schupp, 2003; Keil, Stolarova, Moratti, & Ray, 2007).
Several properties of the impact of affective learning on early sensory representations remain poorly understood, however. For instance, in previous studies, the effect of learning on sensory representations was typically evaluated for stimuli that are both task relevant and explicitly attended. Here, we reasoned that, like intrinsically affective stimuli (e.g., fearful face), learned affective stimuli would impact visual processing even when the stimuli are taskirrelevant and unattended, at least if processing capacity is not exhausted by the main task (Pessoa, McKenna, Gutierrez, & Ungerleider, 2002). It also remains unclear how learning the association between compound stimuli and electrical stimulation impacts evoked responses in early visual cortex. For instance, if a learned stimulus is defined in terms of a conjunction of features, is the impact on early visual responses specific to the conjunction of those features? To investigate these questions, subjects viewed faces depicting neutral or fearful expressions that were surrounded by either a black or a white ring while undergoing functional magnetic resonance imaging (fMRI). During an initial aversive learning phase, fearful faces presented with a certain ring color (e.g., black) acquired additional affective salience via pairing with electrical stimulation (Figure 1). During a subsequent phase, face-ring compound stimuli were task-irrelevant and subjects performed a simple letter-detection task at fixation (Figure 2). Our goal was to evaluate fMRI responses in early, retinotopically organized areas to the four types of facering pairs.
Figure 1.
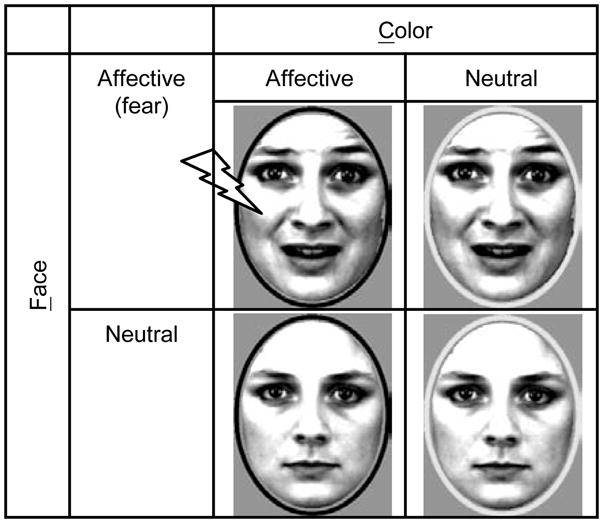
The experimental design contained four face-ring stimuli combinations. During aversive conditioning, only FaCa faces were paired with mild electrical stimulation; the other three stimuli were never paired with shock. FaCa: Face affective, Color affective; FaCn: Face affective, Color neutral; FnCa: Face neutral, Color affective; FnCn: Face neutral, Color neutral.
Figure 2.

Trial structure. Participants were asked to report the number of times that the target letter “X” was shown in a stream of four letters while ignoring task-irrelevant face stimuli. For clarity, no all trial phases are shown (see text).
Importantly, in addition to investigating evoked fMRI responses in early visual cortex, we were interested in probing the pattern of activity across retinotopically organized areas. To do so, we computed the correlations between fMRI responses for early visual areas for different face-ring pairings, and then compared the correlation structure to those observed in other brain regions robustly engaged by our task. Overall, the correlational analyses allowed us to probe not only the effects of affective significance on individual visual areas (as described above), but also how the pattern of effects varied as a function of facial expression under different ring colors, namely, affective contexts.
Methods
Participants
Twenty-eight (8 male) right-handed subjects ranging in age from 20–37 years participated in the study. All participants were in good health with no history of neurological or psychiatric disorders as assessed by a neuropsychiatric interview (MINI) and gave written informed consent, as approved by the Institutional Review Board of Indiana University. Participants had normal or corrected-to-normal vision. Two participants were excluded from data analysis: one participant was excluded due to excessive head motion during scanning (> 2 voxels); one participant was excluded due to poor behavioral performance (4 SDs below the average of all participants). Two participants did not participate in the retinotopic mapping session, leaving 24 participants for visual region of interest analyses.
Stimuli and Task Design
Face stimuli were taken from the Karolinska Directed Emotional Faces (KDEF), the Ekman set (Lundqvist, Flykt, & Öhman, 1998) and the Ishai-NIMH set (Ishai, Pessoa, Bikle, & Ungerleider, 2004). Only neutral and fearful faces were used in this study. All faces were converted to black and white, and both contrast and brightness were adjusted to maintain consistency across the face sets. Faces were cropped of hair and enclosed in a black or white oval ring as shown in Figure 2. Presentation software (Neurobehavioral Systems, CA) was used to display the stimuli and record behavioral responses throughout the experiment.
Procedure
Overview
Participants first completed a conditioning phase during which they were presented with fearful faces surrounded by a colored ring (Figure 1) that were paired with electrical stimulation (Face affective, Color affective, or FaCa) or not (Face affective, Color neutral, or FaCn), as well as neutral faces that were similarly surrounded but never paired with electrical stimulation (Face neutral, Color affective or FnCa; Face neutral, Color neutral or FnCn). For example, for some participants fearful faces ringed in black were paired with electric stimulation (FaCa), whereas fearful ringed in white were not (FaCn). Color was counterbalanced across participants. During the experimental phase, participants attended to the center of a computer screen while face-ring pairings varying in degree of affective salience were presented parafoveally (3.5 degrees from the center of the stimulus to the center of the display). On a separate day, participants completed a retinotopic mapping session to allow the delineation of early visual areas (see below).
Conditioning phase
The conditioning phase employed a 2 facial expression (affective vs. neutral) × 2 color (affective: ring color that was associated with electrical stimulation; neutral: ring color that was not associated with electrical stimulation) experimental design. The participants viewed 34 face-ring pairs during this stage. The face-ring stimuli used in each trial were presented in random order with the constraint that no more than two face-ring stimuli of the same type were presented successively. Thirteen trials contained fearful faces embedded in a ring color that was associated with electrical stimulation (FaCa; participants received electrical stimulation in 6 of these trials). Seven trials contained neutral faces embedded in a ring color that was associated with electrical stimulation (FnCa; participants did not receive electrical stimulation in these trials). Seven trials contained fearful faces embedded in a ring color that was not associated with electrical stimulation (FaCn). Seven trials contained neutral faces embedded in a ring color that was not associated with electrical stimulation (FnCn). In summary, electrical stimulation was delivered in approximately 50% (6/13) of the displays that contained both a fearful face and a specific ring color. The first presentation of each stimulus type not involving shock (i.e., FnCa, FaCn, and FnCn) served as a “habituation” trial; data from these trials were eliminated from further analysis to reduce novelty effects. Using this design, participants viewed each stimulus type equally often (except 6 times instead of 7 for FaCa with electrical stimulation). Due to a programming error, 28 face identities (and not 34) were employed, such that 6 of them were presented twice.
Each conditioning trial started with a 400-ms presentation of the fixation cross followed by a 100-ms blank screen (Figure 2). Next, two identical faces depicting the same emotion and surrounded by the same color were simultaneously presented for 2 s. The participants were instructed to maintain focus on the white cross located at the center of the display while using their right index finger to indicate facial expression. The participants were asked to respond as rapidly and accurately as possible. Face-ring stimuli were presented simultaneously in the upper two quadrants centered at an eccentricity of 3.5 degrees from the fixation, subtended 3.5° × 4.5° of visual angle, and were presented on a gray background. During trials with aversive stimulation, a mild electrical stimulus was delivered 1500 ms after the onset of fearful face-ring stimuli and co-terminated with the fearful face-ring pair. After stimuli offset, there was a 9500-ms blank inter-trial-interval.
The electrical stimulation was administered for 500 ms (at 50 Hz) to the distal phalange of the fifth finger of the right hand through a stimulator (E13–22; Coulbourn instruments, PA), which included a grounded RF filter, and MR-compatible leads and electrodes (BIOPAC systems, CA). Before the experiment, participants were informed that they would receive electrical stimulation only after the presentation of a certain type of stimulus (i.e., fearful faces paired with black or right rings; the pairing was counterbalanced across subjects), but were not informed about how often the electrical stimulation would be delivered upon the presence of this type of stimulus. The intensity of the “highly unpleasant but not painful” stimulation (range: 1.4 –4.0 mA) was determined for each participant while he or she was prepared for MRI scanning.
Skin conductance responses (SCRs) were recorded during MRI data acquisition with the MP-150 system (BIOPAC systems, CA) and MRI-compatible Ag/AgCl electrodes placed on the distal phalange of the fifth finger of the left (non-dominant) hand. SCRs were amplified and sampled at 250 Hz. Recorded SCRs waveforms were detrended and smoothed with a median filter over 50 samples to filter out MRI-induced noise. On each trial, the SCR was calculated by subtracting a baseline (average signal between 0 and 1 s) from the peak amplitude during the 1–6 s time window following stimulus onset (Prokasy & Raskin, 1974). We obtained the average response of 6 trials for each condition and performed a repeated-measure ANOVA on these SCR estimates to assess if aversive learning was successful.
Experimental phase
The order of presentation of the four conditions of interest was randomized so as to optimize the estimation of condition-specific responses (Dale, 1999). The experimental session contained six fMRI runs, each of which consisted of 9 trials per stimulus type (36 experimental trials in total) and 1 “filler” trial. A total of 72 faces with unique identities, which did not appear during the conditioning phase, were used (18 per stimulus type) and each face was shown three times. The filler trial contained FaCa stimuli paired with electrical stimulation (the filler trial was discarded from subsequent analyses involving FaCa trials). At the end of each run, 5 short “booster” trials (one per each stimulus type and one FaCa presented along with electrical stimulation) were employed to minimize extinction (Lim & Pessoa, 2008); booster trials were identical to those presented during the conditioning phase. The participants were also instructed to rate the degree of fear they felt for the electrical stimulation at each run (1–4 scale).
For experimental trials, participants were asked to count the number of times the target letter ‘X’ appeared within a rapid stream of four letters. At the start of each trial, a green fixation cross appeared for 300 ms, followed by a 100-ms blank screen, after which a stream of four letters was presented (each for 400 ms) at fixation (see Figure 2). The letter stream contained one or two Xs (no letter appeared twice in a row). Between 600–1000 ms after the trial’s onset, two identical face-ring stimuli were presented parafoveally for 200 ms. Face-ring stimuli were presented at the same screen location as during the conditioning phase. The slight jitter in the onset time was used to reduce temporal expectancy. Participants were instructed to maintain fixation at the center of the display, where the letter stream was presented, and to indicate the number of times the target letter X was presented. The inter-trial interval was 4 s.
For the booster trials at the end of each run, the participants were instructed to judge facial expression as in the conditioning session. A display was shown for 5000 ms to notify the participants that they now needed to judge the face as either neutral or fearful. Each trial started with a green fixation lasting for 500 ms followed by 2000-ms presentation of the faces at the same location as in the conditioning phase. A white fixation remained on the screen for 9500 ms after the faces disappeared. As stated, following booster trials, participants rated the degree of fear felt concerning the electrical stimulation. Stimulation intensity was maintained at the same level throughout the experiment and the participants’ unpleasantness ratings remained virtually unchanged (e.g., after run 1: 2.2; after run 6: 2.1).
Retinotopic phase
During a separate experimental session, participants underwent standard retinotopic mapping (Engel, 1997; Engel, et al., 1994) which allowed the determination of boundaries between early, retinotopically organized visual areas V1, V2, V3, and V4. In addition, a set of “localizer” runs were employed that presented a flashing checkerboard stimulus (8 Hz) at the same locations as those at which face stimuli were shown during the main scanning session containing conditioning and experimental phases. Evoked responses in these runs were combined with retinotopic mapping information to determine the cortical representation of the face stimuli across early visual cortex.
MRI Data Acquisition and Analysis
Functional MR data were collected using a 3 Tesla Siemens TRIO scanner (Siemens Medical Systems, Erlangen, Germany). Structural images were acquired first with a high-resolution MPRAGE anatomical sequence (TR = 1900 ms; TE = 4.15 ms; TI = 1100 ms; 1-mm isotropic voxel; 256-mm field of view). Next, BOLD contrast functional images were acquired with gradient-echo echo-planar T2*-weighted imaging. Each functional volume consisted of forty slices oriented perpendicular to the calcarine sulcus with a slice thickness of 3 mm (TR = 2500 ms; TE = 30 ms; FA = 90°; field of view: 192 mm; 64 × 64 matrix; interleaved acquisition order). Similar parameters were used for functional data acquisition during the retinotopic session except that 32 slices were acquired per volume.
Analysis of fMRI data was performed using AFNI tools (Cox, 1996), unless indicated otherwise. The first two functional volumes of each run were removed to account for equilibration effects. Functional data underwent the following processing steps: slice-time correction, motion correction, Gaussian spatial smoothing (full width at half maximum: 6 mm), and intensity normalization (each voxel’s mean was set to 100). Each individual’s functional data were analyzed via standard multiple linear regression. The linear models included constant and trend parameters that served as covariates of no interest. A two-stage mixed-effects analysis was performed in which regression coefficients for each condition (fixed factor) were tested across participants (random factor) via t tests or repeated-measures ANOVAs.
Region of Interest (ROI) analysis for early visual areas
ROIs for early visual areas were defined as voxels within each of the early visual areas V1–V4 that were significantly active during the localizer runs relative to fixation (p < .001, uncorrected). No spatial smoothing was applied to the data. A representative time series for each visual area was obtained by averaging the time series of supra-threshold voxels. Condition-specific coefficients of interest were determined as in the voxelwise analysis above.
ROI analysis for other regions
ROIs for other regions were selected based on the group map of general task activation (all-task vs. rest; p < .001, uncorrected). ROIs were then mapped onto each participant’s brain if those voxels also showed general task activation at the individual level (p < .001, uncorrected). A representative time series for each ROI was obtained by averaging the time series of supra-threshold voxels. Condition-specific coefficients of interest were determined as in the voxelwise analysis above.
Functional connectivity analysis
Functional connectivity typically refers to the correlations of spatially separate neurophysiological events (Friston, 1994). Here, we were interested in determining how the pattern of responses across early visual areas changed as a function of the stimulus feature, namely, ring color (affective vs. neutral). Our approach was somewhat different than other formulations of functional connectivity. Because a rapid event-related design was employed, and we were interested in the effect of context (i.e., ring color), we performed an analysis based on the estimated responses to the specific experimental conditions instead of correlating the entire time series from visual areas V1–V4. For instance, to investigate the effect of ring color on “connectivity”, we correlated the differential responses (i.e., contrast images; FaCa – FaCn) for all pairs of regions (e.g., V1–V2, V2–V3, etc.) to generate a correlation matrix (see, e.g., Fig. 5A). Employing differential responses had the added benefit of removing potential contaminations from unspecific signals (including any potential changes in baseline, linear, and non-linear drifts).
Figure 5.

Correlation matrix of differential responses for fearful vs. neutral faces in both affective and neutral contexts (i.e., ring colors). Abbreviations: Varea: correlations within early visual areas; Oarea: correlations within “other areas”; VOarea: correlations between early visual and “other areas”. L: left; R: right; PrCu: precuneus; STS: superior temporal sulcus; IPS: intraparietal sulcus; pSMA: pre-supplementary motor area; PrCS: precentral sulcus; FEF: frontal eye field; INS: insula. Colors code for correlation values as indicated by the color scale.
According to our procedure, evaluating differences in functional connectivity amounted to comparing correlation matrices for different conditions. For present purposes, we adopted simple, first-order comparisons of the correlation pattern. Specifically, we assessed whether the average correlation between visual areas V1–V4 differed during affective vs. neutral ring-color conditions. To evaluate the statistical significance of the potential correlation differences, a permutation-based statistic was determined by (1) randomly assigning parameter estimates to a specific experimental condition (e.g., FaCn), (2) computing contrasts (e.g., FaCa - FaCn) while keeping subjects fixed, (3) computing a “null” correlation matrix across individuals and pairs of visual areas, and (4) repeating this procedure 10,000 times to generate the sampling distribution of the correlation matrix under the null hypothesis. Finally, the average correlation value obtained experimentally was compared to critical values of the null distribution. The same logic was employed to compare correlations between early visual areas and other brain regions (see Figures 5A and B).
Finally, in the functional connectivity analyses involving “other areas” (i.e., not V1–V4), we did not include the fusiform gyrus (FFG). Although the FFG was robustly engaged during the experimental procedure, the posterior aspect of the FFG abutted area V4 in some participants such that these regions shared functional data and could not be separated in a precise and reliable fashion.
Results
Affective Learning during the Conditioning Phase
Mean SCRs are shown in Figure 3. A 2 facial expression (affective vs. neutral) × 2 color (affective vs. neutral) repeated-measures ANOVA found evidence of affective learning. Specifically, a statistically significant main effect of facial expression indicated that participants showed stronger SCRs to fearful vs. neutral faces, F (1, 23) = 10.336, p < .01, regardless of whether the fearful faces were paired with electrical stimulation or not. Furthermore, a statistically significant main effect of color, F (1, 23) = 4.451, p < .05, revealed that participants showed stronger SCRs for faces surrounded by the color that was paired with electrical stimulation (FaCa) even when that color was not paired with shock (FnCa) relative to the unpaired color (FaCn and FnCn). Finally, the interaction failed to reach statistical significance, F (1, 23) = 2.111, p = .15.
Figure 3.

Skin conductance responses (SCRs) during the initial conditioning phase as a function of trial type. Abbreviations as in Figure 1.
Behavioral Performance during the Experimental Phase
Accuracy and reaction time (RT) results during the experimental session revealed that participants performed the task as intended. Participants were just as accurate to perform the letter-counting task on trials that contained fearful faces as those containing neutral faces (97.02% vs. 97.04%), indicating that facial expression did not disrupt task performance, F (1, 23) = .004, p = .9. Nor did facial expression affect response latency (fear: 498.81 ms vs. neutral: 499.94 ms), F (1, 23) = .014, p = .9.
In addition, participants were just as accurate on trials containing faces that were embedded in an affectively salient color ring as on trials containing faces that were embedded in a neutral color ring (96.60% vs. 97.46%), indicating that color did not affect task performance, F (1, 23) = 2.015, p =.15. They were also just as fast; participants were just as quick to judge the number of Xs presented in a trial when it contained faces that were embedded in an affective color ring (503.98 ms) as when they were embedded in a neutral color ring (494.77 ms), F (1, 23) = .473, p = .44.
For both accuracy and speed, the interaction failed to reach statistical significance, F (1, 23) = 1.985, p = .15, and F (1, 23) = .034, p = .85, respectively. Taken together, the accuracy and RT data reveal that different types of face-ring stimuli did not cause different degrees of interference on the behavioral task, which was designed to be a relatively easy, unchallenging task.
BOLD Responses during the Experimental Phase
Early visual areas
BOLD signal changes in each early visual area (V1, V2, V3 and V4) were subjected to a 2 facial expression (affective vs. neutral) × 2 color (affective vs. neutral) repeated-measures ANOVA (one per visual area). The results revealed that affective learning increased BOLD responses in early visual areas, although the effect was not limited to the compound stimuli that were directly paired with electrical stimulation (Table 1 and Figure 4). Specifically, fearful (vs. neutral) faces produced increased BOLD responses in areas V1 and V4 (i.e., a main effect of facial expression was significant). In addition, all faces shown with the ring color that was paired with electrical stimulation increased BOLD responses in V1–V4 (i.e., a main effect of color was significant). No significant interaction between facial expression and color was observed in V1 – V4. Note that because no significant differences were observed for regions on the right or left hemisphere, signals from both hemispheres were pooled.
Table 1.
Summary of ANOVA Results for Early Visual Areas.
| Effect of facial expression | Effect of color | Interaction effect | |
|---|---|---|---|
| V1 | F = 4.39, p < .05 | F = 7.97, p < .01 | F = 0.87, n.s. |
| V2 | F = 0.85, n.s. | F = 9.63, p < .01 | F = 0.08, n.s. |
| V3 | F = 0.49, n.s. | F = 16.81, p < .001 | F = 0.10, n.s. |
| V4 | F = 8.11, p < .01 | F = 4.82, p < .05 | F = 0.30, n.s. |
All F’s had the same degrees of freedom (numerator: 1; denominator: 23).
n.s: not significant.
Figure 4.

BOLD signal changes as a function of visual area and experimental condition Abbreviations as in Figure 1.
Fusiform Face Gyrus
BOLD signal changes in the right and left FFG were each subjected to a 2 facial expression (affective vs. neutral) × 2 color (affective vs. neutral) repeated-measures ANOVA. The effect of facial expression was not statistically significant in either right or left FFG (p = .15 and .20, respectively). The effect of color was statistically significant in both hemispheres; F(1, 23) = 7.684, p < .05 for right FFG and F(1, 23) = 11.988, p < .001 for left FFG. Again, the results suggest that affective learning was not specific to specific compound stimuli. All faces shown with the ring color that was paired with electrical stimulation increased BOLD responses in FFG.
Functional Connectivity Analysis
Functional connectivity analyses were performed to evaluate the co-activation of brain regions during the processing of fearful faces (vs. neutral faces) when embedded in an affective vs. neutral color ring. We were interested in investigating correlations involving two main “blocks” of regions: early visual areas (V1–V4) and “other areas” (i.e., defined as regions that showed general task activation, excluding V1–V4 and FFG). We first report correlations computed either within early visual areas (V1–V2, V1–V3, etc.) or within “other areas” (IPS-FEF, IPS-pSMA, etc.; see Figure 5 for region labels).
The sub-matrices labeled “Varea” in Figures 5A and B show the correlation matrix of differential responses between fearful and neutral faces across V1–V4 under affective and neutral ring-color conditions, respectively. Whereas correlations were sizeable in the affective color condition (average r = 0.62), they were significantly smaller (p < .01) during the neutral color condition (average r = 0.20). Functional connectivity within “other areas” under affective and neutral ring-color conditions were not statistically different (see “Oarea” labeled in Figures 5A and B; average r = 0.43 vs. 0.33 for right hemisphere; average r= 0.47 vs. 0.50 left hemisphere). The above pattern of results within visual and within other areas indicates that the relationship between them (i.e., the Varea and Oarea sub-matrices) changed as a function of color. Indeed, a significant area (Varea, Oarea) by ring-color (black, white) interaction was detected (p < .001), such that the difference in (average) correlation between the blocks of early visual and other areas (i.e., Varea – Oarea) was larger during the affective versus the neutral ring color.
We also determined correlations between early visual areas, on the one hand, and “other areas”, on the other hand (V1-IPS, V1-FEF, etc.); the “VOarea” labels in Figures 5A and B indicate the sub-matrices displaying these correlations. Functional connectivity during the presentation of faces presented with an affective ring color (average r = 0.09 and 0.17 for right and left hemispheres, respectively) were similar to those presented with a neutral one (average r = 0.09 and 0.16 for right and left hemispheres, respectively); no significance differences were observed in these cases (p =.49 and .46 for right and left hemispheres, respectively).
In summary, when fearful (vs. neutral) faces were presented with an affective ring color, there was strong coupling between early visual areas, but weak functional connectivity between these areas and “other areas”, and moderate connectivity within those “other areas”. In contrast, during a neutral ring-color condition, there was relatively little functional connectivity within early visual areas, but moderate connectivity within “other areas” (as well as weak connectivity between early visual and “other areas”).
Discussion
This study demonstrated three important findings. First, early visual cortex is modulated by affective salience, even when that salience is learned. Second, this modulation occurs even when visual material is unattended. Third, affective salience modulates the functional connectivity within early visual areas. Each finding is discussed in turn.
Affective Modulation of Early Visual Areas
Our experimental design did not involve stimuli that optimally drive early visual cortex (such as high-contrast gratings), yet we observed that face-ring stimuli evoked responses throughout V1–V4 that were modulated by affective learning (due to facial expression and/or ring color). Previous fMRI studies have shown that both affectively salient stimuli (Lang, et al., 1998; Mourão-Miranda, et al., 2003) and intrinsically neutral stimuli that are associated with electrical stimulation (Büchel, et al., 1998; Padmala & Pessoa, 2008) evoked increased BOLD responses across visual cortex. Furthermore, several EEG studies have reported that affective salience modulates evoked responses that likely arise in visual cortex within 200 ms following stimulus onset, supporting the notion that affective information impacts early visual processing (Keil, et al., 2007; Stolarova, et al., 2006). Thus, combined with previous studies, our findings suggest that visual cortex throughout occipitotemporal cortex is modulated by affective salience. The findings from our study extend the earlier findings by showing that the impact of affectively salient stimuli on early visual processing can be further enhanced via aversive learning even when the stimuli are complex objects such as faces (as opposed to, say, “low-level” gratings). In the past, evidence for affective modulation of visual cortex was partly confounded by differences in physical features (e.g., unpleasant vs. neutral scenes; but see Rotshtein, Malach, Hadar, Graif, & Hendler, 2001). The present findings revealed that early visual areas are modulated during an affectively potent context (i.e., color) even when physical features are matched.
Effect of Task-Irrelevant Affective Salience on Early Visual Processing
In past studies, robust effects of affective stimuli on visual responses have been reported for stimuli that were at the focus of attention and typically task relevant. The effectiveness of task irrelevant stimuli in eliciting such enhanced responses, such as those demonstrated in this study, is less well documented. For instance, some studies that manipulated the focus of attention did not report increased responses in early visual cortex (Anderson, Christoff, Panitz, De Rosa, & Gabrieli, 2003; Bishop, Duncan, Brett, & Lawrence, 2004). In the present study, attention was directed to a letter-detection task that helped participants maintain central fixation throughout the duration of the trial. In this manner, the cortical representation of the peripheral, task-irrelevant faces was stable and well defined. Critically, we employed an easy task that was not expected to substantially consume processing resources, so as to leave enough spare capacity for the task-irrelevant faces – unlike in previous studies in which the attentional manipulation sought to exhaust available resources (e.g., Bishop, Jenkins, & Lawrence, 2007; Lim, Padmala, & Pessoa, 2008; Pessoa, et al., 2002). Our results thus illustrate that robust modulation of early visual cortical responses is observed for task-irrelevant stimuli (under conditions of low attentional load).
Affect Changes the Functional Connectivity Structure of Early Visual Cortex
Recently, a wealth of studies has investigated how responses in different brain regions are functionally related (e.g., Bassett, Meyer-Lindenberg, Achard, Duke, & Bullmore, 2006; Honey, Kötter, Breakspear, & Sporns, 2007; Stam, Jones, Nolte, Breakspear, & Scheltens, 2007). In the present study, we demonstrated that the context within which a stimulus is presented (i.e., black or white ring color) influenced the functional connectivity across early visual regions. Our results revealed that responses were tightly interrelated during an affectively potent ring-color condition but not during a neutral one. An increase in functional connectivity was observed in early visual areas for fearful (vs. neutral) faces within an affective color context. This suggests that affective salience impacts the relationship between responses evoked in different brain regions and that signals are integrated in early, retinotopically organized areas in a manner that depends on affective information. Critically, the differential impact of ring color was specific to early visual areas, as the correlations observed within “other areas” did not differ as a function of context in the same manner.
Finally, the correlations between early visual and other areas were relatively low during both types of ring color conditions. Combined, these results indicate that during an affectively potent ring-color condition, responses across early visual cortex become more “coherent”, suggesting that an increase in functional integration accompanies such conditions. In this manner, early responses may become relatively more encapsulated, in the sense that correlations between early visual cortex and visual association areas are reduced. In the absence of potential threat, namely, during a neutral ring-color condition, responses across early visual cortex were more varied and less well integrated. This increased in functional integration in response to affective context may be an important way in which affective stimuli modulate visual processing and, accordingly, have an increased impact on perception and behavior.
Limitations of the Present Study
There are several potential limitations of the present study. First, during conditioning, participants were more frequently exposed to affectively significant features (i.e., fearful face and ring color paired with shock; conditions FaCa, FaCn, and FnCa) than to neutral features (i.e., condition FnCn). Note, however, that increased exposure to affective stimuli could have led to habituation in the amygdala (Büchel, et al., 1998; LaBar, Gatenby, Gore, LeDoux, & Phelps, 1998), which, if anything, would be expected to decrease the impact of affective features. Thus, stronger effects relative to those reported here may have been observed with a more balanced design. Second, despite being explicitly instructed that electrical stimulation was associated with a conjunction of facial expression and ring-color features, our results suggest that participants did not associate the compound stimulus with shock. Indeed, no significant statistical interactions between facial expression and ring-color were observed in the SCRs or BOLD responses in early visual cortex. Therefore, future experimental designs will be needed to investigate how simple vs. compound affective features are learned. Finally, we interpreted our findings as indicating that affective salience enhanced BOLD signal changes in early visual areas, consistent with a large body of studies (Büchel, et al., 1998; Lane, et al., 1999; Lang, et al., 1998; Mourão-Miranda, et al., 2003; Padmala & Pessoa, 2008; Vuilleumier, et al., 2004). It is also conceivable, however, that our results depended, at least in part, on inhibitory processes triggered by viewing neutral features. In other words, viewing a neutral face or a neutral ring may have decreased evoked responses. Because of the limited spatial coverage provided by our scanning protocol, we were unable to examine signal changes in anterior prefrontal regions that may be involved in inhibitory processes (Phelps & LeDoux, 2005).
Future Directions
The findings reported here further characterize how affect modulates early visual processing. Several issues remain to be explored, however. First, due to the focus on early visual areas, the scanning parameters did not allow us to examine evoked responses in critical brain regions involved in affective processing, including the amygdala and OFC, that might be driving the observed changes in visual cortex. Consistent with other suggestions (Adolphs, 2002; Adolphs & Spezio, 2006; Lang, et al., 1998; Mourão-Miranda, et al., 2003; Padmala & Pessoa, 2008; Vuilleumier, et al., 2004), we hypothesize that signals from the amygdala and/or OFC, which are important for the processing of affective information, likely modulated responses in visual cortex when an affectively potent stimulus or context was encountered. Follow-up studies would be needed to inform the current findings regarding possible modulatory effects from these regions (e.g., assessed via connectivity analysis, including dynamic causal modeling (Friston, Harrison, & Penny, 2003)). Second, the consequences for perception of the observed modulation remain unclear. Are the unattended faces “seen” better? A study that more directly examined the link between increased visual responses and behavioral performance, on the one hand, and stimulus visibility, on the other hand, would be required to advance our understanding of this challenging question. Finally, the consequences of the observed increase in functional integration in early visual cortex during an affectively potent context deserve to be explored by future studies, too.
Acknowledgments
Preparation of this manuscript was supported by a National Institutes of Health Director’s Pioneer Award (DP1OD003312), grants from the National Institute of Aging (AG030311) and the National Science Foundation (BCS 0721260; BCS 0527440), and a contract with the Army Research Institute (W91WAW), as well as by a James McKeen Cattell Award and a Sabbatical Fellowship from the American Philosophical Society to Lisa Feldman Barrett. Support was also provided by a grant from the National Institute of Mental Health (MH071589) to Luiz Pessoa. The authors thank the anonymous reviewers for their constructive feedback.
Footnotes
Publisher's Disclaimer: This is a PDF file of an unedited manuscript that has been accepted for publication. As a service to our customers we are providing this early version of the manuscript. The manuscript will undergo copyediting, typesetting, and review of the resulting proof before it is published in its final citable form. Please note that during the production process errors may be discovered which could affect the content, and all legal disclaimers that apply to the journal pertain.
Contributor Information
Eswar Damaraju, Indiana University.
Yang-Ming Huang, Indiana University.
Lisa Feldman Barrett, Boston College, Massachusetts General Hospital/Harvard Medical School.
Luiz Pessoa, Indiana University.
References
- Adolphs R. Neural systems for recognizing emotion. Current Opinion in Neurobiology. 2002;12:169–177. doi: 10.1016/s0959-4388(02)00301-x. [DOI] [PubMed] [Google Scholar]
- Adolphs R, Spezio M. Role of the amygdala in processing visual social stimuli. Progress in Brain Research. 2006;156:363–378. doi: 10.1016/S0079-6123(06)56020-0. [DOI] [PubMed] [Google Scholar]
- Alpers G, Gerdes A. Here is looking at you: Emotional faces predominate in binocular rivalry. Emotion. 2007;7:495–506. doi: 10.1037/1528-3542.7.3.495. [DOI] [PubMed] [Google Scholar]
- Alpers G, Pauli P. Emotional pictures predominate in binocular rivalry. Cognition & Emotion. 2006;20:596–607. [Google Scholar]
- Amaral D, Behniea H, Kelly JL. Topographic organization of projections from the amygdala to the visual cortex in the macaque monkey. Neuroscience. 2003;118:1099–1120. doi: 10.1016/s0306-4522(02)01001-1. [DOI] [PubMed] [Google Scholar]
- Amaral D, Price J, Pitkänen A, Carmichael S. Anatomical organization of the primate amygdaloid complex. In: Aggleton J, editor. The amygdala: neurobiological aspects of emotion, memory, and mental dysfunction. New York: Wiley-Liss; 1992. pp. 1–66. [Google Scholar]
- Anderson AK. Affective influences on the attentional dynamics supporting awareness. Journal of Experimental Psychology: General. 2005;134:258–281. doi: 10.1037/0096-3445.134.2.258. [DOI] [PubMed] [Google Scholar]
- Anderson AK, Christoff K, Panitz D, De Rosa E, Gabrieli JDE. Neural correlates of the automatic processing of threat facial signals. The Journal of Neuroscience. 2003;23:5627–5633. doi: 10.1523/JNEUROSCI.23-13-05627.2003. [DOI] [PMC free article] [PubMed] [Google Scholar]
- Anderson AK, Phelps EA. Lesions of the human amygdala impair enhanced perception of emotionally salient events. Nature. 2001:305–307. doi: 10.1038/35077083. [DOI] [PubMed] [Google Scholar]
- Barbas H. Anatomic organization of basoventral and mediodorsal visual recipient prefrontal regions in the rhesus monkey. Journal of Comparative Neurology. 1988;276:313–342. doi: 10.1002/cne.902760302. [DOI] [PubMed] [Google Scholar]
- Barbas H. Anatomic basis of cognitive-emotional interactions in the primate prefrontal cortex. Neuroscience and Biobehavioral Reviews. 1995;19:499–510. doi: 10.1016/0149-7634(94)00053-4. [DOI] [PubMed] [Google Scholar]
- Barrett LF, Bar M. See it with feeling: Affective predictions during object perception. Philosophical Transactions of the Royal Society B: Biological. 2009;364:1325–1334. doi: 10.1098/rstb.2008.0312. [DOI] [PMC free article] [PubMed] [Google Scholar]
- Bassett DS, Meyer-Lindenberg A, Achard S, Duke T, Bullmore E. Adaptive reconfiguration of fractal small-world human brain functional networks. Proceedings of the National Academy of Sciences. 2006;103:19518–19523. doi: 10.1073/pnas.0606005103. [DOI] [PMC free article] [PubMed] [Google Scholar]
- Bishop SJ, Duncan J, Brett M, Lawrence A. Prefrontal cortical function and anxiety: controlling attention to threat-related stimuli. Nature Neuroscience. 2004;7:184–188. doi: 10.1038/nn1173. [DOI] [PubMed] [Google Scholar]
- Bishop SJ, Jenkins R, Lawrence AD. Neural Processing of Fearful Faces: Effects of Anxiety are Gated by Perceptual Capacity Limitations. Cerebral Cortex. 2007;17:1595–1603. doi: 10.1093/cercor/bhl070. [DOI] [PubMed] [Google Scholar]
- Büchel C, Morris J, Dolan RJ, Friston KJ. Brain Systems Mediating Aversive Conditioning: an Event-Related fMRI Study. Neuron. 1998;20:947–957. doi: 10.1016/s0896-6273(00)80476-6. [DOI] [PubMed] [Google Scholar]
- Carmichael ST, Price JL. Limbic connections of the orbital and medial prefrontal cortex in macaque monkeys. Journal of Comparative Neurology. 1995;363:615–641. doi: 10.1002/cne.903630408. [DOI] [PubMed] [Google Scholar]
- Cavada C, Company T, Tejedor J, Cruz-Rizzolo R, Reinoso-Suarez F. The anatomical connections of the macaque monkey orbitofrontal cortex. Cerebral Cortex. 2000;10:220–242. doi: 10.1093/cercor/10.3.220. [DOI] [PubMed] [Google Scholar]
- Compton R. The interface between emotion and attention: A review of evidence from psychology and neuroscience. Behavioral and Cognitive Neuroscience Reviews. 2003;2:115–129. doi: 10.1177/1534582303255278. [DOI] [PubMed] [Google Scholar]
- Cox RW. AFNI: Software for Analysis and Visualization of Functional Magnetic Resonance Neuroimages. Computers and Biomedical Research. 1996;29:162–173. doi: 10.1006/cbmr.1996.0014. [DOI] [PubMed] [Google Scholar]
- Dale A. Optimal experimental design for event-related fMRI. Human Brain Mapping. 1999;8:109–114. doi: 10.1002/(SICI)1097-0193(1999)8:2/3<109::AID-HBM7>3.0.CO;2-W. [DOI] [PMC free article] [PubMed] [Google Scholar]
- Duncan S, Barrett LF. Affect is a form of cognition: A neurobiological analysis. Cognition & Emotion. 2007;21:1184–1211. doi: 10.1080/02699930701437931. [DOI] [PMC free article] [PubMed] [Google Scholar]
- Engel S. Retinotopic organization in human visual cortex and the spatial precision of functional MRI. Cerebral Cortex. 1997;7:181–192. doi: 10.1093/cercor/7.2.181. [DOI] [PubMed] [Google Scholar]
- Engel S, Rumelhart D, Wandell B, Lee A, Glover G, Chichilnisky E, et al. fMRI of human visual cortex. Nature. 1994;369:525–525. doi: 10.1038/369525a0. [DOI] [PubMed] [Google Scholar]
- Friston KJ. Functional and effective connectivity in neuroimaging: A synthesis. Human Brain Mapping. 1994;2:56–78. [Google Scholar]
- Friston KJ, Harrison L, Penny W. Dynamic causal modelling. Neuroimage. 2003;19:1273–1302. doi: 10.1016/s1053-8119(03)00202-7. [DOI] [PubMed] [Google Scholar]
- Schupp Harald T, MJ, Weike Almut I, Hamm Alfons O. Emotional facilitation of sensory processing in the visual cortex. Psychological Science. 2003;14:7–13. doi: 10.1111/1467-9280.01411. [DOI] [PubMed] [Google Scholar]
- Honey CJ, Kötter R, Breakspear M, Sporns O. Network structure of cerebral cortex shapes functional connectivity on multiple time scales. Proceedings of the National Academy of Sciences. 2007;104:10240–10245. doi: 10.1073/pnas.0701519104. [DOI] [PMC free article] [PubMed] [Google Scholar]
- Ishai A, Pessoa L, Bikle PC, Ungerleider LG. Repetition suppression of faces is modulated by emotion. Proceedings of the National Academy of Sciences. 2004;101:9827–9832. doi: 10.1073/pnas.0403559101. [DOI] [PMC free article] [PubMed] [Google Scholar]
- Keil A, Stolarova M, Moratti S, Ray WJ. Adaptation in human visual cortex as a mechanism for rapid discrimination of aversive stimuli. Neuroimage. 2007;36:472–479. doi: 10.1016/j.neuroimage.2007.02.048. [DOI] [PMC free article] [PubMed] [Google Scholar]
- Kober H, Barrett LF, Joseph J, Bliss-Moreau E, Lindquist K, Wager TD. Functional grouping and cortical-subcortical interactions in emotion: A meta-analysis of neuroimaging studies. Neuroimage. 2008;42:998–1031. doi: 10.1016/j.neuroimage.2008.03.059. [DOI] [PMC free article] [PubMed] [Google Scholar]
- LaBar KS, Gatenby JC, Gore JC, LeDoux JE, Phelps EA. Human Amygdala Activation during Conditioned Fear Acquisition and Extinction: a Mixed-Trial fMRI Study. Neuron. 1998;20:937–945. doi: 10.1016/s0896-6273(00)80475-4. [DOI] [PubMed] [Google Scholar]
- Lane RD, Chua PML, Dolan RJ. Common effects of emotional valence, arousal and attention on neural activation during visual processing of pictures. Neuropsychologia. 1999;37:989–997. doi: 10.1016/s0028-3932(99)00017-2. [DOI] [PubMed] [Google Scholar]
- Lang PJ, Bradley MM, Fitzsimmons JR, Cuthbert BN, Scott JD, Moulder B, et al. Emotional arousal and activation of the visual cortex: An fMRI analysis. Psychophysiology. 1998;35:199–210. [PubMed] [Google Scholar]
- Li W, Howard JD, Parrish TB, Gottfried JA. Aversive learning enhances perceptual and cortical discrimination of indiscriminable odor cues. Science. 2008;319:1842–1845. doi: 10.1126/science.1152837. [DOI] [PMC free article] [PubMed] [Google Scholar]
- Lim SL, Padmala S, Pessoa L. Affective learning modulates spatial competition during low-load attentional conditions. Neuropsychologia. 2008;46:1267–1278. doi: 10.1016/j.neuropsychologia.2007.12.003. [DOI] [PMC free article] [PubMed] [Google Scholar]
- Lim SL, Pessoa L. Affective learning increases sensitivity to graded emotional faces. Emotion. 2008;8:96–103. doi: 10.1037/1528-3542.8.1.96. [DOI] [PubMed] [Google Scholar]
- Lundqvist D, Flykt A, Öhman A. The Karolinska Directed Emotional Faces—KDEF, CD ROM from Departmet of Clinical Neuroscience, Psychology section, Karolinska Institutet. 1998. [Google Scholar]
- Mourão-Miranda J, Volchan E, Moll J, de Oliveira-Souza R, Oliveira L, Bramati I, et al. Contributions of stimulus valence and arousal to visual activation during emotional perception. Neuroimage. 2003;20:1955–1963. doi: 10.1016/j.neuroimage.2003.08.011. [DOI] [PubMed] [Google Scholar]
- Padmala S, Pessoa L. Affective learning enhances visual detection and responses in primary visual cortex. The Journal of Neuroscience. 2008;28:6202–6210. doi: 10.1523/JNEUROSCI.1233-08.2008. [DOI] [PMC free article] [PubMed] [Google Scholar]
- Pessoa L, McKenna M, Gutierrez E, Ungerleider LG. Neural processing of emotional faces requires attention. Proceedings of the National Academy of Sciences. 2002;99:11458–11463. doi: 10.1073/pnas.172403899. [DOI] [PMC free article] [PubMed] [Google Scholar]
- Pessoa L, Ungerleider LG. Neuroimaging studies of attention and the processing of emotion-laden stimuli. Progress in Brain Research. 2004;144:171–182. doi: 10.1016/S0079-6123(03)14412-3. [DOI] [PubMed] [Google Scholar]
- Phelps EA, LeDoux JE. Contributions of the Amygdala to Emotion Processing: From Animal Models to Human Behavior. Neuron. 2005;48:175–187. doi: 10.1016/j.neuron.2005.09.025. [DOI] [PubMed] [Google Scholar]
- Prokasy WF, Raskin DC. Electrodermal activity in psychological research. New York: Academic Press; 1974. [Google Scholar]
- Rotshtein P, Malach R, Hadar U, Graif M, Hendler T. Feeling or Features: Different Sensitivity to Emotion in High-Order Visual Cortex and Amygdala. Neuron. 2001;32:747–757. doi: 10.1016/s0896-6273(01)00513-x. [DOI] [PubMed] [Google Scholar]
- Stam C, Jones B, Nolte G, Breakspear M, Scheltens P. Small-World Networks and Functional Connectivity in Alzheimer’s Disease. Cerebral Cortex. 2007;17:92–99. doi: 10.1093/cercor/bhj127. [DOI] [PubMed] [Google Scholar]
- Stolarova M, Keil A, Moratti S. Modulation of the C1 visual event-related component by conditioned stimuli: Evidence for sensory plasticity in early affective perception. Cerebral Cortex. 2006;16:876–887. doi: 10.1093/cercor/bhj031. [DOI] [PubMed] [Google Scholar]
- Vuilleumier P. How brains beware: neural mechanisms of emotional attention. Trends in Cognitive Sciences. 2005;9:585–594. doi: 10.1016/j.tics.2005.10.011. [DOI] [PubMed] [Google Scholar]
- Vuilleumier P, Richardson MP, Armony JL, Driver J, Dolan RJ. Distant influences of amygdala lesion on visual cortical activation during emotional face processing. Nature Neuroscience. 2004;7:1271–1278. doi: 10.1038/nn1341. [DOI] [PubMed] [Google Scholar]
- Wager TD, Barrett LF, Bliss-Moreau E, Lindquist K, Duncan S, Kober H, et al. The neuroimaging of emotion. In: Lewis M, Haviland-Jones JM, Barrett LF, editors. The Handbook of Emotion. 3. New York: Guilford; 2008. pp. 249–271. [Google Scholar]