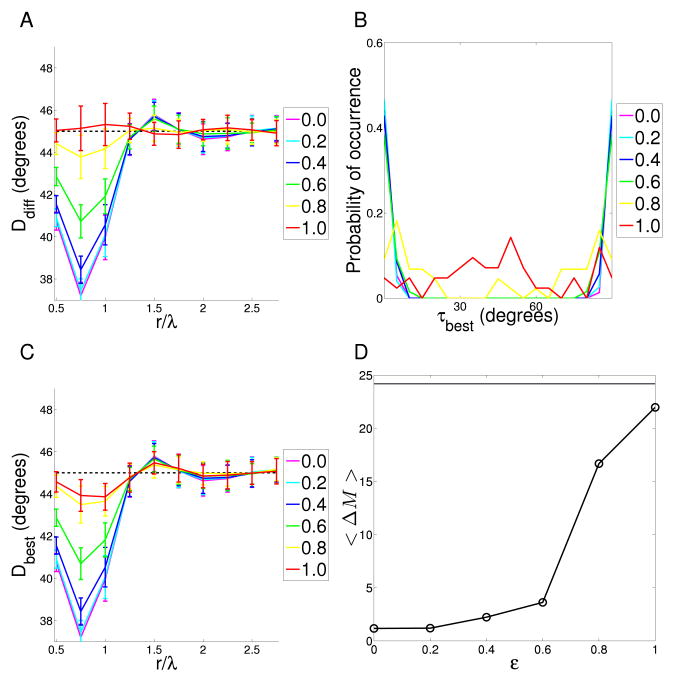
Figure 8. Analysis of reduced symmetry in elastic net maps.
A Co-circularity strength Ddiff(r) for elastic net maps trained on varying input correlation strength, ε. ε = 0.0 corresponds to maps trained on highly co-circular inputs while ε = 1.0 signifies maps trained on inputs without co-circular correlations. As input correlations are reduced the strength of co-circularity is also reduced. B Density plot of τbest, the angle of rotation of each orientation map required to bring it into maximal agreement with co-circularity for maps with varying input correlation, ε. Because τ is circularly symmetric at 90° the ends of the x-axis can be thought of as joined and τ values near 90° are also close to 0. For uncorrelated input ε = 1.0), there are no significant areas of high density (p = 0.12), however, for all other conditions the density is concentrated near τ = 0 (p < 0.01). This indicates that even a small amount of reduced symmetry in the input is enough to cause symmetry breaking along the initially defined axis. C Dbest for elastic net maps trained on varying strengths of input correlations ε. Since for most maps τbest is near 0 this plot is similar to (A). As input correlations are reduced the strength of the map co-circularity is also reduced. D The mean distance between pairs of τbest, < ΔM > (a measure of how grouped the τ values are). Each point on the plot is the mean of 40 elastic net maps. The horizontal line indicates the mean < ΔM > for the normal cat maps. As ε increases (inputs become less correlated) the maps exhibit more variability in τbest and reduced co-circularity. The best agreement in the variability of τbest values occurs when ε = 1.0. All statistical tests as described in Methods section.

