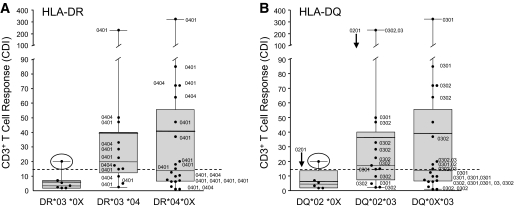
FIG. 4.
Graphic representation of the relationship between wheat-induced T-cell response and high-resolution HLA diabetes risk alleles. Box and Whisker plots with individual values for diabetic subjects. Each plot includes the mean (bold line), median (solid thin line), distribution, and range. A: Distribution of T-cell proliferation (CDI) to WP in type 1 diabetic patients with HLA-DRB1*03 and HLA-DRB1*04 or in those heterozygous for HLA-DRB1*03/*04. A CDI value greater than mean + 3 SD of the control group (CDI >14.6, dashed line) was used to define a positive proliferation response. One of the type 1 diabetic patients with HLA-DRB1*03+/*04− showed positive responses to WP (○). Type 1 diabetic patients who carried one risk allele HLA-DRB1*04 (10 of 20) or patients who carried both risk genes HLA-DRB1*03/*04 (9 of 12) showed positive reactivity to WP. High-resolution results of HLA-DR are labeled beside each individual. B: Distribution of T-cell proliferation (CDI) to WP in type 1 diabetic patients with HLA-DQB1*02 and HLA-DQB1*03 or in those heterozygous for HLA-DQB1*02/*03. High-resolution analyses for HLA-DQB1*02 and *03 are labeled beside each symbol. ↓ (beside 0201) means all individuals in the column carry HLA-DQB1*0201. (Three of the 42 type 1 diabetic individuals are neither DR3 nor DR4, and therefore they are not included in this figure. One of the seven individuals with DR3/non-DR4 in the left panel is heterozygous for DQ*02/*03 and was therefore placed in the middle column in the right panel [DQ*02*03]. Differences in high-resolution haplotypes between responders and nonresponders were not evaluated statistically because of the small sample size.)

