

Abstract
Chemical shift data from the BiomagResDataBank and conformational data derived from the protein data bank have been correlated in order to explore the conformational dependence of side chain 13C resonance shifts. Consistent with predictions based on steric compression, upfield shifts for Cγ resonances of Thr, Val, Ile, Leu, Met, Arg, Lys, Glu, and Gln residues correlate with both the number of heavy atom (nonproton) γ-substituents and with gauche conformational orientations of γ-substituents. The 13C shift/conformation correlations are most apparent for Cγ carbons but also can be observed at positions further from the backbone. Intraresidue steric conflict leads to a correlation between upfield-shifted side chain 13C resonances and statistically lower probabilities in surveys of protein side chain conformation. Illustrative applications to the DNA pol λ lyase domain and to dihydrofolate reductase are discussed. In the latter case, 13C shift analysis indicates that the conformation of the remote residue V119 on the βF-βG loop is correlated with the redox state of the bound pyridine nucleotide cofactor, providing one basis for discrimination between substrate and product. It is anticipated that 13C shift data for protein sidechains can provide a useful basis for the analysis of conformational changes even in large, deuterated proteins. Additionally, the large dependence of the leucine methyl shift difference, δCδ1-δCδ2, on both χ1 and χ2 is sufficient to allow this parameter to be used as a restraint in structure calculations if stereospecific assignment data are available.
1. Introduction
Although nuclear Overhauser effect interactions provide the primary basis for determining solution structures by NMR spectroscopy, structural information also has been derived from other parameters. For example, the use of protein chemical shift information as a structural tool has steadily increased. Chemical shift indexing (CSI)1,2 and TALOS3 analysis of backbone shifts have been demonstrated to provide reliable information on protein secondary structure. Furthermore, forcefields have been developed to refine NMR structures against 13Cα, 13Cβ, and 1H shifts.4,5 Most impressively, the inclusion of chemical shift-based restraints in molecular force field calculations leads to significant improvements in protein structure prediction.6 However, extending shift information to specific side chain conformations has proven to be more difficult.
Conversely, predicting shifts from structure also has been widely studied in order to better understand the physical basis of the chemical shift. Sidechain proton shifts are predicted by several convenient web-based programs which utilize density functional calculations7 or are based on combinations of empirical correlations, classical formulas, and quantum mechanical determinations.8 Extensive quantum mechanical calculations of protein 13C shifts have been performed by Oldfield and co-workers.9,10 The program SPARTA predicts backbone chemical shifts by matching, ϕ, ψ, and χ1 angles and sequence similarity of three residue groups with a database of high resolution X-ray structures for which the backbone chemical shifts have been assigned.11 Although these studies focus primarily on backbone shifts, some examples of side chain shifts have also been presented.10,12,13 Structure-based predictions for the 1H shifts of side chain nuclei have provided useful structural insights,14 but the 13C shift predictions for side chain nuclei have generally proven to be less useful. Neither of the currently available web-based prediction programs SHIFTS7 or SHIFTX8 provide 13C chemical shift values for residue sidechains, presumably because the correlation coefficients relating experimental to predicted data were substantially poorer than those obtained for 1H shift data or for the 13C and 15N backbone data, and since side chain shifts beyond Cβ have been considered not to differ substantially from random coil values.8 The programs SHIFTOR15 and PREDITOR16 predict side chain χ1 values from data that include 13Cγ shifts, so that the observed correlation may be derived in part from a conformational dependence of Cγ, but any such relationship remains implicit in the analysis.
Early studies of 13C shifts in aliphatic hydrocarbons by Grant and co-workers demonstrated a significant “γ-substituent effect”, according to which substituents positioned three bonds from the observed nucleus contribute to the 13C shift based on their number17 and subtended dihedral angle.18,19 The effect is believed to arise primarily from steric crowding leading to carbon-hydrogen bond polarization;18,20 however it subsequently has become clear that additional factors are also involved.21,22 Tonelli interpreted carbonyl and Cβ shifts in several peptides based on γ-effect contributions.23,24 Pearson et al. have calculated a significant dihedral angle dependence for the Cγ1 and Cγ2 13C shifts in studies of N-formylvaline.12 These results support the conclusion that, despite some controversy over the physical basis for the γ-effect,22 it can be extrapolated to studies of protein side chain conformation. In order to further explore this possibility, we have investigated the extent to which correlations between side chain dihedral angles (χ values) correlate with experimental 13C shift data for a set of well-characterized proteins. We also have evaluated the parameters ΔCγ12 = δCγ1 - δCγ2 and ΔCδ12 = δCδ1 - δCδ2 for valine and leucine, respectively, since many of the shift contributions arising from other factors might be expected to be similar for these pairs of methyl carbons, enhancing the predictive value of the shift difference.
2. Methods
In order to evaluate potential correlations between 13C shift and conformation, shift data were obtained from the Biomag Res data bank (BMRB)25 and correlated with structural data from the protein data bank (PDB).26 After considering various sample subsets, we combined the sample sets of structures and shifts that previously had been selected for determination of the relationships for TALOS3 and SHIFTX.8 Both studies attempted to compile data that featured reliable shift assignments and a corresponding high-resolution crystal structure. Importantly, none of the data is reported to have paramagnetic atoms present, which can lead to significant contact and pseudocontact shifts.
The BMRB contains NMR chemical shift information and other parameters derived from NMR studies. The information needed was extracted and collated using Perl scripts that parse through the BMRB-STAR files. The shift data were corrected to remove any referencing biases introduced when the original measurements were taken using the recommendations of Wang et al.27 For the 13C shifts of the prochiral methyl groups of valine and leucine, the data were filtered by ambiguity code = 1 (as defined in the BMRB), to include only residues which had been stereospecifically assigned. We note that according to the papers describing the structural analyses, in most cases these assignments have been based on the analysis of NOE data. For comparison we also tabulated a list of five proteins for which the methyl stereo assignments were made using the method of Neri et al.28 The name, pdb, and bmrb identification of these proteins are as follows: malate synthase G (1D8C, 5471), maltose binding protein (1omp, 4354), putidaredoxin (1OQR, 2278), phage 434 repressor (1R69, 195), and P22 c2 repressor (1ADR, 486).
The structural information required for calculating the bond angles can be found at the Protein Data Bank. We used the structural visualization programs MOLMOL29 and PyMol (DeLano Scientific, LLC 2008) to calculate the bond angles. We note that, for isoleucine residues, the program MOLMOL gave discrepancies in the calculated angles depending on the atomic nomenclature used. After manually visualizing the structures and rotameric conformations for a subset of our assembled database, we found PyMol did not have the same problem and utilized this software for the isoleucine χ2 calculations.
The amino acid type, shifts, and angles were correlated to analyze for trends again using Perl scripting. The results were saved in formats that could easily be read into a spreadsheet. We created templates, readable by Excel or Open Office Charts, that would read the shift and angle data and then automatically separate, analyze, and graph them while still including editable fields for filtering data based on other criteria (vide infra). This makes the process easy and quickly repeatable. The spreadsheet calculates statistical quantities including mean and standard deviation, performs t tests to verify significance in the results, allows for visual inspection, and reports the quantity of interest, the relative shift of the more sterically compressed conformation. Typical output is presented as Supporting Information. The t test compared the mean shift of two rotamers to determine if they were derived from significantly different populations. In most cases there was better than 99% confidence that the mean shifts were different, although when the shift difference was much less than 1, the confidence could be as low as 50%. We find that, generally, the significance attributed to the t test correlates with the calculated shift differences presented, as might be expected.
In our final analysis, we have applied the following filters in order to eliminate poorer quality structures. Structural analyses have shown that, for the amino acid sidechains in proteins, the conformations cluster around the relatively stable gauche and trans conformers.30 Structures with angles not falling into these ranges are generally characterized by higher B-factors. For this reason, we ultimately utilized only data falling within a 40° range of these minima, i.e. with χ angles equal to ±60° ± 20° and 180° ± 20°. In addition, we only use X-ray data which diffracted to 2.0 Å or better and B-factors less than 40.
Similarly the shift data needed to be examined for errors. 13C shift data falling greater than 2 standard deviations from the mean were eliminated from the analysis, in order to account for anomalies or incorrect assignments. For example, we found some lysine Cγ shifts of >49 ppm and methionine Cϵ shifts > 30 ppm which are clearly in error. Statistically, eliminating data 2 standard deviations from the mean will filter out 4.4% of the data. In the Supporting Information, we have included graphs and statistics showing the data used in this study, before and after the filtering procedures described above.
Statistical preferences for side chain conformations were taken from tables compiled by Penel et al.31 and are based on a set of 298 protein structures corresponding to 78 978 amino acids. The protein selection was based on a survey of the October 1997 pdb data set to select protein structures solved at a resolution higher than 2.0 Å, with an R-factor lower than 20%, and having less than 25% identity.32
3. Results and Discussion
In the studies described here, the analysis was restricted to aliphatic residues leucine, isoleucine, valine, and methionine and polar residues threonine, lysine, arginine, glutamate, and glutamine. Glycine, alanine, serine, and cysteine lack Cγ carbons and so cannot show an analogous γ-effect; the side chain conformation of proline is constrained, although dynamic,33,34 while residues aspartate, asparagine, phenylalanine, tyrosine, histidine, and tryptophan have quaternary Cγ nuclei which can be subject to different shift contributions; for example, the aspartate Cγ shift varies with protonation state.35 The Cδ nuclei of the aromatic residues above are, however, expected to exhibit a conformational dependence on χ1 and χ2, and this will be explored elsewhere.
In correlating 13C shift data with side chain conformational data derived from the protein data bank, it is important to note the significant differences between the conditions of crystallographic and NMR studies which ultimately limit the analysis. The most critical differences are temperature: generally ~ 100° K for crystal structures vs ~ 300° K for NMR solution studies, precipitants that cocrystallize and lattice contact interactions in the crystalline state, and the effects of buffer interactions and molecular aggregation in solution. The temperature difference is generally the most important factor. The higher temperatures required for solution state studies generally correspond to conformational mixtures, while the lower temperature of the crystallographic studies selects for the lowest energy conformer for most residues. The effects of temperature are expected to be most significant for surface residues, as discussed in greater detail for the analysis of lysine residues presented below. Further, this limitation is much more significant for the analysis of side chain conformation than for backbone conformation, which has been the object of most earlier studies.2,7,8,12,36 Lattice contacts also can result in a significant conformational bias, although it is expected that analysis of a large data set will reduce most of this bias since the effects of such interactions are presumably random. The use of high concentrations of precipitants in crystallographic studies may systematically perturb the conformations of some residues; however since these occur in only a few, well-defined positions in the crystal, they probably are of limited significance. Nevertheless, motional and conformational properties can be significantly impacted by crystal packing, and breathing motions in solution can relax not only interconversion barriers but also severe, longer range steric constraints that destabilize or even eliminate particular conformations in the crystal. Examples include Val1 in the cyclic peptide antamanide37 and Val21 in the β1 immunoglobulin binding domain of protein G (GB1).38
3.1. χ1 Correlations
Of the residues evaluated, threonine, with its single γ-methyl group, provides the most ideal system for evaluation of the potential significance of the γ-effect in protein side chains. Figure 1a summarizes the χ1 definitions for the three stable conformers of threonine; χ1 = 180° corresponds to the conformer in which Cγ is gauche to both N and C′, while, for χ1 = ±60°, one of the gauche substituents is a proton. Hence, threonine Cγ is predicted to experience a relative upfield 13C shift for residues with χ1 values near 180°. Figure 1b summarizes the data for this residue obtained from the analysis of the protein test sample. In generating this figure, only shift data within a 40° range, i.e., corresponding to dihedral angles of ±60° ± 20°, and 180° ± 20°, were used. In addition, shift values >2 standard deviations from the mean were also deleted, in order to eliminate extreme outliers from the analysis. Based on the data shown in Figure 1, it is immediately apparent that the Cγ resonance corresponding to χ1 = 180° is shifted upfield. This effect can be expressed quantitatively by comparing the 13C shift for the conformation(s) with two gauche heavy atoms to the shift for conformation(s) with a single gauche interaction:
where δχ1 corresponds to the mean shift corresponding to conformers with dihdedral angle χ1 ± 20°. As is also apparent from Figure 1b, the conformer in which both N and C′ adopt a gauche orientation relative to Cγ tends to be the least energetically favorable and hence is statistically the least populated, so that there are typically fewer examples in the data set corresponding to this conformer (Table 1). Considering the data prior to shift filtering, an observed 13C shift for Thr Cγ that falls below the mean of 18.9 ppm corresponding to χ1 = 180° serves as a correct indicator of this conformation with 64% accuracy. However, based on the raw data, this cutoff misses about half of the conformers that have δ13Cγ greater than the mean value and also misidentifies the conformation in five cases.
Figure 1.

(a) Three stable rotameric conformations of threonine. The significant steric interactions are indicated by red arrows. (b) Threonine 13Cγ shifts corresponding to the three stable rotameric states. Shift data were included for ±20° ranges.
Table 1.
χ1 Conformer 13Cγ Shift Perturbations and Statistical Probabilities
| residue | carbon | χ1 value corresponding to maximum steric conflicta | δχ1 - 1/2(δχ1′ + δχ1")a ppm | probability of rare χ1 conformerb |
|---|---|---|---|---|
| Thr | Cγ2 | 180°(t) | -2.74 | 8% |
| Ile | Cγ1 | 60° | -2.02 | 13% |
| Cγ2 | 180° | -1.35 | 10% | |
| Valc | Cγ1 | 60° | -1.03 | 8% |
| Cγ2 | -60° | -1.50 | 20% | |
| Arg | Cγ | 60° (g-) | -0.78 | 9% |
| GluC | Cγ | 60° (g-) | -0.54 | 8% |
| Glu | Cγ | 60° (g-) | -0.59 | 11% |
| Leu | Cγ | 60° (g-) | -0.13 | 2% |
| Lys | Cγ | 60° (g-) | -1.01 | 8% |
| Met | Cγ | 60° (g-) | -0.34 | 9% |
The χ1 value selected corresponds to the conformer in which both the CO and NH groups have a gauche orientation relative to the observed Cγ, while in orientations χ1′ and χ1″ only one of these groups has a gauche orientation relative to Cγ.
Conformer statistics based on Penel et al.;31 see also http://pbil.univ-lyonl.fr/members/penel/manchester/preferences.html.
Val has a different convention for rotamers: g(-) is -60°, t is 60°, and g+ is 180°.
All of the aliphatic Cγ nuclei in the data set showed an upfield bias in the more sterically crowded conformer. The isoleucine methylene Cγ also showed one of the larger shift perturbations:
For isoleucine, χ1 = 60°, corresponding to the g- conformer, places Cγ1 in a gauche orientation relative to N and C′.
Interpretation of the shifts for the valine Cγ1 and Cγ2 methyl groups is based on stereospecific assignments and yields the following:
It is important to emphasize that our data are derived from only those assignments that are coded in the BMRB database as unique and, therefore, stereospecifically assigned. In general, the upfield shift observed for valine is expected to be somewhat smaller than that for threonine or isoleucine due to the greater symmetry of the side chain and hence the increased likelihood of thermal averaging of the conformations. For both isoleucine and valine, the significant differences observed between the upfield shifts of the two Cγ nuclei can be qualitatively understood in terms of thermal averaging of the different rotameric states, which is most significant for the least stable rotamer. This effect is discussed in greater detail for the case of leucine considered below.
Assuming that some of the other factors influencing the 13C shift will be similar or partially averaged for the two valine Cγ nuclei, we can consider the shift difference ΔCγ12 = δCγ1 - δCγ2 as a potentially useful parameter for the analysis of valine side chain conformation. Correlation of mean shift values with χ1 indicates that ΔCγ12 = 1.95 for χ1 ≈ -60° but is near 0 (no correlation) for χ1 = 60° and 180° (Table 2).
Table 2.
Dependence of Mean 13C Shift Differences on χ1 or χ2.
| ΔCγ12 |
||||
|---|---|---|---|---|
| I: Valine χ1 | δCγ1 | δCγ2 | all data | Neri-selected |
| -60° | 22.05 | 20.1 | 1.95 | 1.31 ± 2.8 |
| +60° | 20.87 | 21.23 | -0.36 | 0.05 ± 1.7 |
| 180° | 21.74 | 21.97 | -0.26 | -1.01 ± 1.5 |
| ΔCδ12 |
||||
|---|---|---|---|---|
| II: Leucine χ2 | δCδ1 | δCδ2 | all data | Neri-selected |
| -60°a | 24.9 | 26.2 | -1.3 | 0.093 |
| +60° | 24.45 | 25.79 | -1.34 | -2.3 ± 1.6 |
| 180° | 25.17 | 23.84 | 1.33 | 3.0 ± 0.5 |
The leucine database included only two examples corresponding to χ2 = -60° and one example for the Neri-selected group that was stereospecifically assigned using isotopic labeling.28
Since statistically χ1 ≈ 60° corresponds to only 8% of the valine rotamers, small values for ΔCγ12 are more likely to correspond to the χ1 = 180° (g+) conformer. Interestingly, an even larger Δγ12, χ1 correlation is observed for malate synthase G, the largest protein analyzed in detail; of the 41 assigned valine residues, 39 could be correlated with dihedral angles in the crystal structure, 1D8C.39,40 The parameter ΔCγ12 = 2.86, -0.10, and -1.11 for χ1 ≈ -60°, +60°, and 180°, respectively. Based on this effect, we also tabulated the values for a set of five proteins (see methods) for which the methyl groups were stereospecifically assigned based on isotopic labeling.28 These results extend the correlations with χ1 ≈ +60° still close to 0, but χ1 ≈ 180° corresponding to a more negative shift difference of -1 ppm (Table 2). The correlation apparent in Table 2 is observed for the Val1 rotamers in the cyclic peptide antamanide, which can be individually observed in the solid state.37 NOE data were used to assign the resonances to two rotameric forms: (Rotamer I) χ1 = -60°; δCγ1, δCγ2 = 20.5, 16.1 and (Rotamer II) χ1 = 180°; δCγ1, δCγ2 = 19.5, 17.1. Thus, the transition from g- to g+ conformations corresponds to ΔCγ1 = -1.0 ppm and ΔCγ2 = + 1.0 ppm.
The data for aspartate and asparagine were very limited. Since the side chain Cγ shift of Asp and Asn residues rarely contains any information for structure determination, it is not usually reported or assigned. More importantly, the carbonyl Cγ carbons fall outside the aliphatic hydrocarbon originally evaluated by Grant and Cheney, so that there would be no predictions for these residues.20 The limited data available indicate either no significant shift or even a downfield shift for the most sterically crowded χ1 = 60° conformer. In addition, the shift for the aspartate Cγ will be dependent on the titration state of the residue, which will vary significantly, depending on the individual pK values and the pH of the study.35
The results for the remaining χ1, Cγ shift correlations of Arg, Glu, Gln, Leu, Lys, and Met are summarized in Table 1. For the group of residues shown in Table 1, there are apparently no exceptions to the prediction that the conformation characterized by the most significant steric conflict shows lowest statistical probability and the greatest upfield Cγ shift. In a few cases, notably for leucine and methionine, there was so little data that corresponded to the sterically disfavored conformer that any numerical value for the upfield γ-shift should be regarded as only a qualitative indicator. A more serious limitation on the data results from the assumptions of single rotamer occupancy for all side chains, including those on the protein surface. This is particularly the case for charged residues, since most of these are located on the surface of the protein.
3.2. χ2/χ3 Correlations
Conformational-13C shift correlations for χ2 are summarized in Table 3. For the case of leucine, as for several other residues, the shift pattern changes in that, for each δ methyl group, two possible conformations contain a single, gauche heavy atom, while in the third conformation both gauche atoms are hydrogen. Comprehensive analyses of the protein data bank indicate that leucine side chains exist predominantly in only two rotameric states: χ1 = -60°, χ2 = 180°, and χ1 = 180°, χ2 = +60°.30,31 Consistent with this expectation, in our analysis of stereospecifically assigned leucines there are only two examples where the structure indicates χ2 = -60°. Further, solid-state NMR results indicate that there can be rapid interconversion between the two significantly populated states,41,42 although the motion may be more complex than described by this simple two-site jump model.43 Macarthur and Thornton concluded that the X-ray structures are generally not able to distinguish one conformation from the other, particularly when low resolution results in ambiguity.30 Dunbrack and Karplus had earlier noticed similar problems in the interpretation of electron density maps for leucine residues.44 We therefore have analyzed the leucine data based on the assumption of only two significant populated side chain conformational states, giving the following:
where the above calculation is based on the fact that, for Cδ1, the χ2 = 60° conformation exhibits greater steric crowding, while, for Cδ2, the χ2 = 180° conformation shows more crowding, and the above correlations assume that χ2 can adopt only two different values.
Table 3.
χ2 and χ3 Shift Correlations
| probability of χ2. conformerb |
||||||
|---|---|---|---|---|---|---|
| residue | carbon | steric shiftcalculationa | value | g- | g+ | t |
| χ2 correlations | ||||||
| Ile | Cδ1 | δ-60 - 1/2(δ60 + δl80) | -2.73 | 10 | 15 | 75 |
| Leu | Cδ1 | δ60 - δ180 | -0.72 | 43 | 5 | 52 |
| Cδ2 | δ180 - δ60 | -1.95 | 43 | 5 | 52 | |
| Arg | Cδ | 1/2(δ-60 + δ60) - δ180 | -0.36 | 9 | 12 | 79 |
| Lys | Cδ | 1/2(δ-60 + δ60) - δ180 | -0.38 | 12 | 16 | 72 |
| χ3 correlations | ||||||
| Met | Cϵ | 1/2(δ60 + δ-60) - δ180 | -0.78 | |||
| Lys | Cϵ | 1/2(δ60 + δ-60) - δ180 | -0.18 | |||
The shift calculations subtract the shift values for less sterically crowded conformation(s) from the values for the more sterically crowded conformation(s). In most cases, this corresponds to two conformers with a single gauche heavy atom, compared with a conformer with no gauche heavy atoms. For the case of leucine, only two conformations are significantly populated.
χ2 conformations were determined from the Penel et al.31 Although the g+ conformation for leucine is predicted to experience the greatest steric crowding and hence the greatest upfield shift, there is insufficient data corresponding to this conformation to allow this determination.
It is interesting to note that, in the case of leucine, the apparent steric shift differences for the two Cδ carbon resonances differ by more than a factor of 2. The most probable explanation for this large variation relates to the fact noted above that, in solution at ~300° K, we are not looking at pure conformations. More specifically, we can predict this result based on the assumption that the effect of the higher temperature is to go from a protein structure corresponding to a global energy minimum to a structure in which additional conformational states are populated based on the local minima that characterize the individual residues. In the following discussion, we assume that the local stability of the rotamer conformations is correlated with the observed rotamer probabilities given by Penel et al.31 For the case of leucine, this implies that the trans conformation corresponding to χ2 = 180° is more stable (Table 3) and hence more likely than the gauche conformation to persist in solution at higher temperature. Alternatively, a residue observed to adopt the χ2 = 60° conformation in the crystal will have a greater tendency to equilibrate with the χ2 = 180° rotamer in solution. The averaging of the shifts between states can be modeled quantitatively by amending the relation given above to the following:
The above expressions for the thermally averaged results become equivalent to the nonthremally averaged result as p1,p2 → 1 and are identically equal to 0 if there is complete thermal averaging (p1 = 0.5; p2 = 0.5). In the above expressions, p1 is the probability that a nominal χ2 = 60° conformation identified in the crystal remains in this rotameric state in solution at high temperature, and p2 is the probability that a nominal χ2 = 180° conformation identified in the crystal remains in the trans conformation at high temperature. Given that statistically the χ2 = 180° conformation is more stable, p2 > p1, consistent with a larger upfield shift for Leu Cδ2. As an illustrative calculation, if we assume that the upfield shift experienced by a leucine methyl carbon in a gauche conformation in the absence of rotameric averaging, ΔC, is the same for both Cδ methyl carbons, the above relations simplify to
Setting ΔC = -4 ppm, p1 = 0.59, and p2 = 0.75 gives a Leu Cδ1 shift of -0.72 ppm and a Leu Cδ2 shift = -2.0 ppm, similar to the observed values given above. In addition to predicting that the actual γ-effect shift contribution is significantly larger than the observed values, this model is consistent with NMR data showing interconversion of the two stable leucine conformations.41,42 Qualitatively similar effects also are expected to be present for the Cγ nuclei of valine and isoleucine, although, in these cases, the effects result from mixing three conformational states. In general, the carbon for which the state with the greatest number of gauche interactions is the least stable statistically will show the most significant reduction in shift due to averaging with more stable conformers. For valine, this corresponds to Cγ1 (χ1 = 60°), and for isoleucine this corresponds to Cγ2 (χ1 = 180°).
Returning to the crystallographic comparisons for leucine, we note that the very strong correlation between χ1 and χ2 for this residue implies that the Cδ shifts should also be dependent on χ1.31 Correlating the mean Cδ shifts with the χ1 dihedral angles yields
As expected, the larger γ-effect shift correlation for Cδ2 remains even when the analysis is based on χ1.
As in the case of valine discussed above, we can consider the parameter ΔCδ12 = δCδ1 - δCδ2 as a potentially useful indicator of the leucine side chain conformation, if stereo assignments are known. The strong conformational coupling of the two dihedral angles results in pronounced correlations between ΔCδ12 and both χ2 and χ1. Plots of ΔCδ12 for the leucine residues in malate synthase G as a function of both χ2 and χ1 are shown in Figure 2.39 For the χ2 dependence, the parameter ΔCδ12 = 1.33 and -1.34 ppm for χ2 ≈ 180° and +60°, respectively (Table 2). For the complete data set, there were only two examples with χ2 = -60°, consistent with the above discussion. An even more pronounced dependence was observed for the set of five proteins stereospecifically assigned by isotopic labeling (Table 2). In this case, the sensitivity of the ΔCδ12 parameter to χ1 or χ2 exceeds the standard deviation of the value. The limited accessibility of conformational space and the large dependence of ΔCδ12 on dihedral angles support the use of this parameter for the analysis of conformational changes in leucine residues. It is likely that many of the leucine residues exhibiting larger positive or negative ΔCδ12 values correspond to purer conformational states, while residues exhibiting values closer to 0 are more likely to correspond to nearly equal rotamer mixtures.
Figure 2.
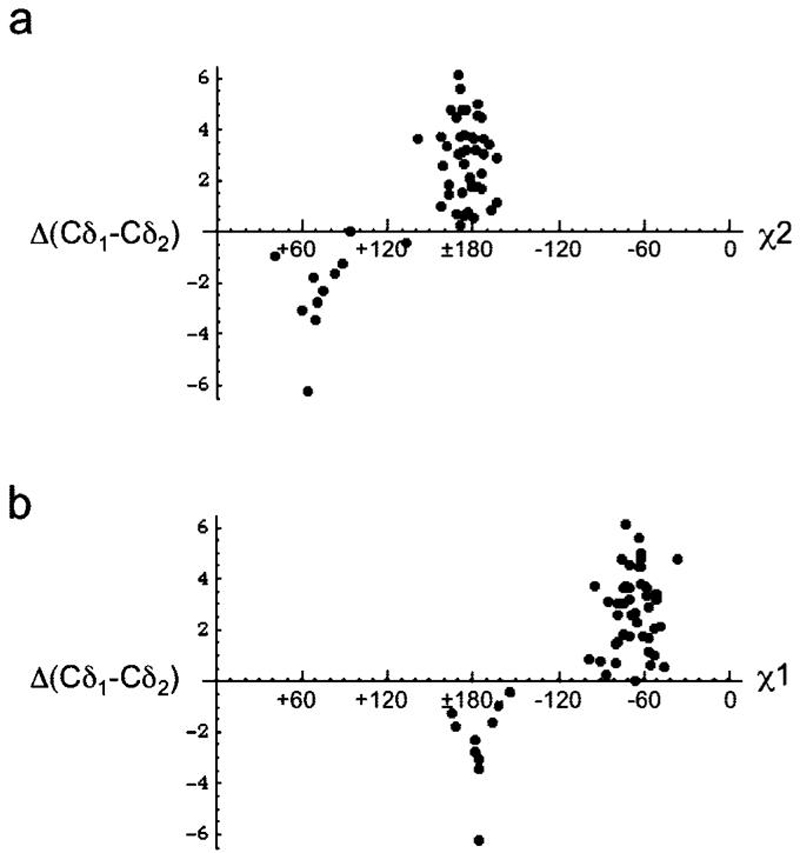
Analysis of leucine methyl shifts in malate synthase G. (A) Variation of ΔCδ12 with χ2 and (b) correlation with χ1. As is apparent from the figure, most of the observed conformations correspond to χ1 = -60°, χ2 = 180°, with a smaller proportion corresponding to χ1 = 180°, χ2 = 60°. Data were analyzed for 54 leucine residues for which both NMR shift data39 and crystallographic χ1/χ2 data40 were available.
For methionine, lysine, and arginine, the Cδ is gauche to Cα for χ2 = ±60° and gauche to two hydrogen atoms for χ2 = 180°. Hence, the effect of steric crowding should be evidenced as a negative value for ½(δ-60 + δ60) - δ180. Since, in methionine, the δ position is occupied by a sulfur atom, we only obtain data for lysine and arginine Cδ atoms (Table 3), both of which show modest upfield shifts.
As discussed above, the small shift differences here undoubtedly relate to the fact that these two charged residues are located predominantly on the surface and, in contrast with the low temperature crystallographic studies, the NMR studies correspond to significant conformational mixtures. For a few cases in which these residues are involved in salt bridges which constrain the conformations, as in the example of DNA polymerase λ discussed below, a larger effect can be observed. These steric interactions are also expected to produce upfield shifts for Cα. However, the 13Cα shifts tend to be dominated by the backbone angle dependences that have been extensively studied, so we have not explored these correlations further.
In the calculation of shift correlations related to Met χ3, we noted a significant variability dependent on whether the mean or median shift value was used. This was traced to three extreme shift values for Met Cϵ: Met1, δ13C = 26.99 ppm (Influenza A virus NS1 protein, pdb code 1AIL BMRB, code 4317; Met60, δ13C = 37.53 and Met 136, δ13C = 32.53 ppm, human fibroblast collagenase, pdb code 1HFC, BMRB code 4064). Additionally, shift data for plastocyanin (pdb code 1PLC, BMRB code 4019) was found to correspond frequently to outliers, as in the case of Met57 (δ13C = 13.8 ppm). The high values above were considered to represent assignment problems, while the low value for plastocyanin was considered to indicate a difference in referencing, and so these values were dropped from the analysis.
The γ-shift perturbation observed for methionine is surprisingly large, particularly in view of the fact that the order parameters for methionine Cϵ are typically very low.45 Hence, this value may reflect the paucity of shift data available for this carbon, which is not readily assigned using standard techniques. Interestingly, the Nϵ shift of arginine showed a large γ-shift effect of -0.87 ppm, although the original Grant-Cheney analysis did not extend to noncarbon atoms and there were only 24 data points available for analysis.20
3.3. Applications
It is anticipated that the 13C shift, χi correlations described here are most useful for the analysis of protein conformational changes. Several illustrative examples are given below.
3.3.1. DNA Polymerase λ Lyase Domain
In general, the polymethylene chain of lysine represents the most tractable structure for revealing correlations between 13C shift values and molecular conformation in proteins. However, the statistical data for lysine are expected to be weak for two reasons. First the lower temperature (~100 vs 300 K) of most X-ray data will result in populating the lowest energy state to a much greater extent than is achieved in the NMR experiment. As an estimate of this effect, the gauche/trans energy difference for a polymethylene chain is approximately 0.5 kcal/mol.46 Using the following relations
yields an 86% trans conformation probability at 100 K compared with a 54% trans probability at 300 K. Second, lysines are commonly located on the surface where there is generally a lack of conformational restraint in solution while in a crystal there may be conformational bias due to lattice contacts. Therefore the analysis of lysine shift and structural data is expected to be problematic. Nevertheless, useful examples of the conformational dependence of lysyl 13C shifts exist in the literature. Studies of [ϵ-13C] lysine-labeled lyase domain from DNA polymerase λ indicate that the 13C shifts for 9 of the 10 lysine residues in the domain cluster near δ13C = 42.2 ppm, while the shift for K291 is 40.8 ppm (Figure 3a).47 Although the 13C shift is also sensitive to the titration state of the ϵ-amino group, deprotonation leads to a downfield rather than an upfield shift for Cϵ, and in addition, the pK of this residue was found to be typical for surface-exposed lysine residues, so that the -1.4 ppm shift difference could not be explained on this basis. Instead, an analysis of the crystal structure of Pol λ (pdb code: 1RZT) indicates a χ3 = -77.2 in the g+ conformation as a result of a salt bridge with E298.48 The other salt-bridged lysine residue, K287, is held in an all trans configuration (Figure 3b). Presumably, the other surface exposed lysine residues, which include all but Lys312, exist as gauche/trans mixtures, with the ratio determined mostly by the gauche/trans energy difference and other inter-residue steric effects. Although there were no useful inter-residue NOE cross peaks to help position K291 in this study, the notable upfield shift for Cϵ indicates that the side chain conformation is constrained to have a gauche conformation for χ3.49
Figure 3.

(a) 1H-13C HSQC spectrum of [ϵ-13C]lysine polymerase λ lyase domain (residues 242-327) obtained on a Unity INOVA 800. Three of the residues, K287, K291, and K312, show inequivalent ϵ protons under the conditions of the study. Other sample conditions were as follows: 100 mM KCl, 2 mM deuterated DTT, 0.1% NaN3 (w/v), 90% H2O and 10% 2H2O (v/v), and 50 μM DSS, used as a chemical shift standard.47 (b) Structural data showing salt bridge interactions for K287-E261 and K291-E298, taken from structure 1RZT.48
3.3.2. Dihydrofolate Reductase
Dihydrofolate reductase, a target of both chemotherapeutic and bacterial antifolate drugs, is one of the most extensively studied enzymes. One of the interesting conformational aspects of DHFR activity concerns the interaction of the “Met20 loop” located at the active site and the βF-βG loop connecting β strands F and G. This second loop comes in contact with the Met20 loop and appears to influence ligand binding. NMR relaxation studies and mutational analysis have supported the conclusion that the βF-βG loop plays a significant catalytic role by influencing the conformational distribution of the Met20 loop which in turn modulates ligand affinity and relative orientation.50,51 For example, deletion of residue G121 in the βF-βG loop reduced the binding affinity for NADPH nearly 3-fold more than the affinity for NADP+. Osborne et al. recently have determined the side chain 13C shifts for many of the residues of E. coli DHFR in two ternary complexes: DHFR•Folate•NADP+ (complex I), corresponding to a closed conformation of the Met20 loop, and DHFR•Folate•DHNADPH (complex II), corresponding to an occluded conformation of the Met20 loop (Figure 4).52 DHNADPH corresponds to 5,6-dihydroNADPH, a stabilized, reduced cofactor analogue. Evaluation of side chain methyl 13C shifts indicates that the only valine residue assigned in both structures for which the Cγ values show a significant variation is V119, located in the βF-βG loop. The Cγ1, Cγ2 shifts for Val119 are 21.59, 18.64 and 20.89, 20.23, for complexes I and II, respectively. Although the methyl groups were not stereospecifically assigned, the presumed Cγ2 resonance undergoes a significant -1.59 ppm upfield shift in complex I relative to complex II, and the parameter ΔCγ12 decreases from ΔCγ12I = 2.95 to ΔCγ12 II12 = 0.66. Based on the data analysis presented above, the shifts correspond to an increased probability for the g-, χ1 = -60° conformer in complex I, with complex II corresponding to χ1 values of 180° or 60°. Since the χ1=+60° conformation for valine is relatively rare (8%), the V119 conformational switch is probably from χ1 = -60° to 180° in going from the complex with NADP+ to DHNADPH and from a closed to an occluded conformation of the Met20 loop. As can be seen from a comparison of the two loop conformations in Figure 4b, the Val119 side chain comes in close contact with Pro21 on the Met20 loop in the closed conformation, while Pro21 moves away from Val119 when the Met20 loop adopts the occluded conformation. Evaluation of the Val119 conformation for all of the crystal structures described by Sawaya and Kraut53 indicates that in most of the structures observed in the P21212 B space group, which was considered the most reliable basis for interpreting the relationship of ligand binding to conformation due to the lower number of lattice contacts for the flexible loops, Val119 has an eclipsed conformation. This result probably indicates a dynamic averaging process. Nevertheless, for a few of the closed conformations (1RX1, 1RX9) Val119 adopts a g-, χ1 = -60° conformation, and for most of the observed occluded conformations, which correspond to the P61 and P65 space groups, Val119 χ1 ≈ 180°, consistent with the conclusions of the 13C shift analysis. A similar conformational conclusion also can be derived from analysis of coupling constant data.54
Figure 4.

Structure of E. coli dihdyrofolate reductase showing the Met20 and βF-βG loops. (a) Structure 1RA253 corresponding to the DHFR•Folate•NADP+ complex. The Met20 loop is indicated in cyan, and the βF-βG loop, in orange. NADP+ is shown in magenta, and folate, in yellow. Sidechains for V119 on the βF-βG loop and several residues in the Met20 loop are also explicitly indicated. (b) Superposition of active site loops in structures 1RX2 (corresponding to a ternary DHFR•Folate•NADP+ complex in which the Met20 loop adopts a closed conformation) and 1RX7 (corresponding to a binary DHFR•Folate complex with the Met20 loop in an occluded conformation). Both structures show residues 9-24 of the Met 20 loop and 117-122 of the βF-βG loop, as well as the sidechains for P21 and V119. The proximity of the P21-V119 sidechains is significantly greater in the closed conformation of the Met20 loop, which is presumably the basis for the observed shift perturbation and corresponding conformational change of V119.
4. Conclusions
Correlation of the 13C shifts for protein side chains with the χi values derived from the protein data bank indicates a readily observed γ-effect, according to which an upfield shift is observed for the most sterically hindered conformation. It is likely that these correlations significantly understate the magnitude of the effect, since at 300 K most side chains, particularly those on the protein surface, populate multiple conformational states, so that the measured values do not correspond to the pure conformational states indicated in the pdb. Although the details of the mechanism remain unclear, the steric origin of the shifts is consistent with the strong correlation between lower (upfield) Cγ shifts and lower statistical conformational probability.31 As noted above, qualitatively similar predictions of γ-effect shifts in N-formylvaline have been determined by Pearson et al.12 Interestingly, in these calculations the shielding is always greatest near χ1 = ±60° and falls off significantly at χ1 = 0°, a result which is not readily explained by simple steric arguments. The side chain shift data also have some absolute predictive values for the analysis of χ1 values, and the more extensive shift data included in the PREDITOR torsion angle prediction program yield χ1 values that agree with the crystallographic results in 64% of the cases, for predictions based only on chemical shift data.16 Density functional studies of Villegas et al. also have indicated that δ13Cα and δ13Cβ show a significant dependence on χ1 and a smaller but significant dependence on χi > 1 for 11 of 19 residues.36 The most significant side chain 13C shift/conformation correlation observed in the present study corresponds to the ΔCδ12 parameter for leucine. Although not all of the proteins gave as well separated data as malate synthase G (Figure 2), assignment of the leucine side chain conformation to one of the two stable alternatives based on the sign of the ΔCδ12 parameter was consistent with crystallographic data >92% of the time for the five protein sample set stereospecifically assigned by isotopic labeling, and it is likely that values close to 0 often correspond to nearly equal concentrations of interconverting conformers. For this data set, most of the discrepancies correspond to χ2 values outside of the usual ranges. The corresponding ΔCγ12 parameter for valine is less reliable; omitting the rare t conformer as well as a few noncanonical conformers, the g-/g+ conformers are correctly predicted in 80% of the cases. Other residues showing a modest correlation included Ile δCγ1 < 26.0 ppm implying a g+ or g-conformer, Ile δCδ < 11.6 ppm corresponding to χ2 = -60°, and Thr δCγ < 19.6 ppm corresponding to χ1 = 180°. In most of these cases, there is a significant number of both false negatives, i.e. similar χ1 values that fail to satisfy the shift cutoff, and false positives, other conformations satisfying the shift cutoff criteria. Further, as noted above, most side chains do not adopt a single conformation under typical solution state conditions.
These correlations should be of general use for the interpretation of conformational changes in proteins, particularly in cases for which NOE and/or coupling data are not available. The dramatic upfield shift observed for the Cϵ of K291 in DNA polymerase λ lyase domain is readily interpreted on the basis of the gauche orientational constraint resulting from the salt bridge, while there is no apparent alternative explanation for such an unsual shift. In this case, no inter-residue NOE constraints could be observed that would indicate the residue conformation and the involvement in a salt bridge. Hence, for this example, the 13C shift gives useful structural information not readily obtained from NOE restraints. Evaluation of available data for E. coli dihydrofolate reductase indicated that Val119 on the βF-βG loop that is not in direct contact with the pyridine nucleotide cofactor is subject to subtle conformational influences that depend on the redox state of the bound pyridine nucleotide. The statistically more stable 180° conformation is correlated with binding of the reduced cofactor analogue, DHNADPH.
Given the current popularity of introducing “selective methyl reprotonation” in large, deuterated proteins,55 and the fact that some of the clearest correlations are obtained for threonine and the aliphatic residues, we believe that such shift perturbations provide a useful basis for analyzing conformational changes in these systems. Further, such conformationally related shift data can be derived independently based on relaxation measurements,56 so that it may be possible to associate dynamic behavior with specific excited-state conformational changes. Further, the large correlation obtained in the case of leucine ΔCδ12 with χ1 and χ2 is sufficient to allow this parameter to be used as a restraint in structure calculations, if stereospecific assignment data are available.
Supplementary Material Legend
Acknowledgment
This research was supported by the Intramural Research Program of the NIH, National Institute of Environmental Health Sciences. The authors wish to thank Dr. Ron Venters and Dr. Eugene DeRose for a critical reading of the manuscript.
Footnotes
Supporting Information Available: Raw and filtered shift data as a function of χi and accompanying Newman projections are provided as Supporting Information. This material is available free of charge via the Internet at http://pubs.acs.org.
References
- (1).Wishart DS, Sykes BD. J. Biomol. NMR. 1994;4:171–80. doi: 10.1007/BF00175245. [DOI] [PubMed] [Google Scholar]
- (2).Wishart DS, Sykes BD, Richards FM. Biochemistry. 1992;31:1647–51. doi: 10.1021/bi00121a010. [DOI] [PubMed] [Google Scholar]
- (3).Cornilescu G, Delaglio F, Bax A. J. Biomol. NMR. 1999;13:289–302. doi: 10.1023/a:1008392405740. [DOI] [PubMed] [Google Scholar]
- (4).Kuszewski J, Gronenborn AM, Clore GM. J. Magn. Reson., Ser. B. 1995;107:293–297. doi: 10.1006/jmrb.1995.1093. [DOI] [PubMed] [Google Scholar]
- (5).Kuszewski J, Qin J, Gronenborn AM, Clore GM. J. Magn. Reson., Ser. B. 1995;106:92–96. doi: 10.1006/jmrb.1995.1017. [DOI] [PubMed] [Google Scholar]
- (6).Cavalli A, Salvatella X, Dobson CM, Vendruscolo M. Proc. Natl. Acad. Sci. U.S.A. 2007;104:9615–9620. doi: 10.1073/pnas.0610313104. [DOI] [PMC free article] [PubMed] [Google Scholar]
- (7).Xu XP, Case DA. J. Biomol. NMR. 2001;21:321–33. doi: 10.1023/a:1013324104681. [DOI] [PubMed] [Google Scholar]
- (8).Neal S, Nip AM, Zhang H, Wishart DS. J. Biomol. NMR. 2003;26:215–40. doi: 10.1023/a:1023812930288. [DOI] [PubMed] [Google Scholar]
- (9).Havlin RH, Laws DD, Bitter HML, Sanders LK, Sun HH, Grimley JS, Wemmer DE, Pines A, Oldfield E. J. Am. Chem. Soc. 2001;123:10362–10369. doi: 10.1021/ja0115060. [DOI] [PubMed] [Google Scholar]
- (10).Havlin RH, Le HB, Laws DD, deDios AC, Oldfield E. J. Am. Chem. Soc. 1997;119:11951–11958. [Google Scholar]
- (11).Shen Y, Bax A. J. Biomol. NMR. 2007;38:289–302. doi: 10.1007/s10858-007-9166-6. [DOI] [PubMed] [Google Scholar]
- (12).Pearson JG, Le HB, Sanders LK, Godbout N, Havlin RH, Oldfield E. J. Am. Chem. Soc. 1997;119:11941–11950. [Google Scholar]
- (13).Sun HH, Sanders LK, Oldfield E. J. Am. Chem. Soc. 2002;124:5486–5495. doi: 10.1021/ja011863a. [DOI] [PubMed] [Google Scholar]
- (14).Kirby TW, DeRose EF, London RE. FASEB J. 2005;19:A308–A308. [Google Scholar]
- (15).Neal S, Berjanskii M, Zhang H, Wishart DS. Magn. Reson. Chem. 2006;44(S1):S158–67. doi: 10.1002/mrc.1832. [DOI] [PubMed] [Google Scholar]
- (16).Berjanskii MV, Neal S, Wishart DS. Nucleic Acids Res. 2006;34:W63–9. doi: 10.1093/nar/gkl341. [DOI] [PMC free article] [PubMed] [Google Scholar]
- (17).Grant DM, Paul EG. J. Am. Chem. Soc. 1964;86:2984. [Google Scholar]
- (18).Cheney BV, Grant DM. J. Am. Chem. Soc. 1967;89:5319. [Google Scholar]
- (19).Saito H. Magn. Reson. Chem. 1986;24:835–852. [Google Scholar]
- (20).Grant DM, Cheney BV. J. Am. Chem. Soc. 1967;89:5315. [Google Scholar]
- (21).Jiao D, Barfield M, Hruby VJ. J. Am. Chem. Soc. 1993;115:10883–10887. [Google Scholar]
- (22).Seidl PR, Leal KZ, Costa VEU, Mollmann MES. Magn. Reson. Chem. 1998;36:261–266. [Google Scholar]
- (23).Tonelli AE. J. Am. Chem. Soc. 1980;102:7635–7637. [Google Scholar]
- (24).Tonelli AE. Biopolymers. 1984;23:819–829. [Google Scholar]
- (25).Doreleijers JF, Mading S, Maziuk D, Sojourner K, Yin L, Zhu J, Markley JL, Ulrich EL. J. Biomol. NMR. 2003;26:139–146. doi: 10.1023/a:1023514106644. [DOI] [PubMed] [Google Scholar]
- (26).Berman H, Henrick K, Nakamura H. Nat. Struct. Biol. 2003;10:980–980. doi: 10.1038/nsb1203-980. [DOI] [PubMed] [Google Scholar]
- (27).Wang LY, Eghbalnia HR, Bahrami A, Markley JL. J. Biomol. NMR. 2005;32:13–22. doi: 10.1007/s10858-005-1717-0. [DOI] [PubMed] [Google Scholar]
- (28).Neri D, Szyperski T, Otting G, Senn H, Wuthrich K. Biochemistry. 1989;28:7510–7516. doi: 10.1021/bi00445a003. [DOI] [PubMed] [Google Scholar]
- (29).Koradi R, Billeter M, Wuthrich K. J. Mol. Graphics. 1996;14:51–5. doi: 10.1016/0263-7855(96)00009-4. [DOI] [PubMed] [Google Scholar]
- (30).MacArthur MW, Thornton JM. Acta Crystallogr., Sect. D. 1999;55:994–1004. doi: 10.1107/s0907444999002231. [DOI] [PubMed] [Google Scholar]
- (31).Penel S, Hughes E, Doig AJ. J. Mol. Biol. 1999;287:127–143. doi: 10.1006/jmbi.1998.2549. [DOI] [PubMed] [Google Scholar]
- (32).Hobohm U, Sander C. Protein Sci. 1994;3:522–524. doi: 10.1002/pro.5560030317. [DOI] [PMC free article] [PubMed] [Google Scholar]
- (33).London RE. J. Am. Chem. Soc. 1978;100:2678–2685. [Google Scholar]
- (34).Schmidt JM, Bruschweiler R, Ernst RR, Dunbrack RL, Joseph D, Karplus M. J. Am. Chem. Soc. 1993;115:8747–8756. [Google Scholar]
- (35).London RE. J. Magn. Reson. 1980;38:173–177. [Google Scholar]
- (36).Villegas ME, Vila JA, Scheraga HA. J. Biomol. NMR. 2007;37:137–146. doi: 10.1007/s10858-006-9118-6. [DOI] [PubMed] [Google Scholar]
- (37).Straus SK, Bremi T, Ernst RR. J. Biomol. NMR. 1997;10:119–128. doi: 10.1023/a:1008280716360. [DOI] [PubMed] [Google Scholar]
- (38).Franks WT, Zhou DH, Wylie BJ, Money BG, Graesser DT, Frericks HL, Sahota G, Rienstra CM. J. Am. Chem. Soc. 2005;127:12291–12305. doi: 10.1021/ja044497e. [DOI] [PubMed] [Google Scholar]
- (39).Tugarinov V, Kay LE. J. Am. Chem. Soc. 2004;126:9827–9836. doi: 10.1021/ja048738u. [DOI] [PubMed] [Google Scholar]
- (40).Howard BR, Endrizzi JA, Remington SJ. Biochemistry. 2000;39:3156–3168. doi: 10.1021/bi992519h. [DOI] [PubMed] [Google Scholar]
- (41).Batchelder LS, Sullivan CE, Jelinski LW, Torchia DA. Proc. Natl. Acad Sci. U.S.A. 1982;79:386–389. doi: 10.1073/pnas.79.2.386. [DOI] [PMC free article] [PubMed] [Google Scholar]
- (42).Colnago LA, Valentine KG, Opella SJ. Biochemistry. 1987;26:847–854. doi: 10.1021/bi00377a028. [DOI] [PubMed] [Google Scholar]
- (43).Yang DW, Mittermaier A, Mok YK, Kay LE. J. Mol. Biol. 1998;276:939–954. doi: 10.1006/jmbi.1997.1588. [DOI] [PubMed] [Google Scholar]
- (44).Dunbrack RL, Karplus M. J. Mol. Biol. 1993;230:543–574. doi: 10.1006/jmbi.1993.1170. [DOI] [PubMed] [Google Scholar]
- (45).Skrynnikov NR, Millet O, Kay LE. J. Am. Chem. Soc. 2002;124:6449–6460. doi: 10.1021/ja012498q. [DOI] [PubMed] [Google Scholar]
- (46).Scherer JR, Snyder RG. J. Chem. Phys. 1980;72:5798–5808. [Google Scholar]
- (47).Gao GH, DeRose EF, Kirby TW, London RE. Biochemistry. 2006;45:1785–1794. doi: 10.1021/bi051856p. [DOI] [PubMed] [Google Scholar]
- (48).Garcia-Diaz M, Bebenek K, Krahn JM, Blanco L, Kunkel TA, Pedersen LC. Mol. Cell. 2004;13:561–572. doi: 10.1016/s1097-2765(04)00061-9. [DOI] [PubMed] [Google Scholar]
- (49).DeRose EF, Kirby TW, Mueller GA, Bebenek K, Garcia-Diaz M, Blanco L, Kunkel TA, London RE. Biochemistry. 2003;42:9564–9574. doi: 10.1021/bi034298s. [DOI] [PubMed] [Google Scholar]
- (50).Miller GP, Benkovic SJ. Biochemistry. 1998;37:6327–6335. doi: 10.1021/bi972922t. [DOI] [PubMed] [Google Scholar]
- (51).Miller GP, Benkovic SJ. Biochemistry. 1998;37:6336–6342. doi: 10.1021/bi973065w. [DOI] [PubMed] [Google Scholar]
- (52).Osborne MJ, Venkitakrishnan RP, Dyson HJ, Wright PE. Protein Sci. 2003;12:2230–2238. doi: 10.1110/ps.03219603. [DOI] [PMC free article] [PubMed] [Google Scholar]
- (53).Sawaya MR, Kraut J. Biochemistry. 1997;36:586–603. doi: 10.1021/bi962337c. [DOI] [PubMed] [Google Scholar]
- (54).Schnell JR, Dyson HJ, Wright PE. Biochemistry. 2004;43:374–383. doi: 10.1021/bi035464z. [DOI] [PubMed] [Google Scholar]
- (55).Goto NK, Gardner KH, Mueller GA, Willis RC, Kay LE. J. Biomol. NMR. 1999;13:369–374. doi: 10.1023/a:1008393201236. [DOI] [PubMed] [Google Scholar]
- (56).Skrynnikov NR, Dahlquist FW, Kay LE. J. Am. Chem. Soc. 2002;124:12352–12360. doi: 10.1021/ja0207089. [DOI] [PubMed] [Google Scholar]
Associated Data
This section collects any data citations, data availability statements, or supplementary materials included in this article.