1. Introduction
Cognitive and functional primary endpoints to assess efficacy in the evaluation of pathologically targeted treatments for Alzheimer’s disease (AD) require 2 or more years of observation to detect a clinically meaningful reduction in the rate of disease progression. In addition, they require 300 to 400 participants to insure that observed changes are not biased by differential dropout and endpoint assessment measurement error. Even with standardization, substantial measurement error is a feature of both cognitive testing and subjective disease severity rating scales. The discovery and validation of sensitive, specific, and reliable biochemical markers of neurodegenerative pathology associated Alzheimer’s disease holds the potential to improve the design of treatment trials by providing objective quantitative pathologically linked endpoint measurements of treatment effects.
A second role for biochemical biomarkers is to increase the certainty that clinical trial participants have the treatment targeted pathology. This is particularly valuable when assessing benefits in the earliest symptomatic phase of late-life dementias such as AD.
Biochemical biomarkers of late-life dementia have an inherent advantage over many other biomarkers in that they can be collected and shipped to a central reference laboratory without a requirement for sophisticated technology at the clinical trial evaluation site.
Despite an emerging consensus that many of the late-life neurodegenerative dementing illnesses have in common abnormal aggregation of otherwise normal proteins (tau, α-synuclein, and β-amyloid [Aβ] fragments of the amyloid precursor protein) biochemical detection of these pathologic changes is currently limited to those associated with AD. Reliable biomarkers of α-synuclein pathology associated with Parkinson’s dementia and dementia with Lewy bodies have yet to be discovered.
In addition, the role of cerebrospinal fluid (CSF) tau in the pathologically heterogeneous frontotemporal (FTD) dementias has yet to be sorted out adequately. Despite the finding of a tauopathy as the dominant pathology in 46% and coexisting AD pathology in an additional 17% [1] most patients with FTD are found to have normal or slightly elevated CSF tau. However, there is one report that some patients have abnormally low CSF tau levels [2]. There is clearly much work to be done in the area of biomarkers of FTD.
2. Diagnostic Statistics: A Brief Glossary and Some Comments
Sensitivity: the proportion of subjects with AD pathology whose biomarker value is above the designated cutoff level.
Specificity: the proportion of subjects without AD pathology whose biomarker value is below the diagnostic cutoff level.
Positive predictive value (PPV): the proportion of subjects with a biomarker value above the diagnostic cutoff who have AD pathology.
The overall agreement: the proportion of all subjects whose biomarker value (above or below the designated cutoff) is consistent with their pathologic diagnosis (AD vs not AD).
Positive likelihood ratio (PLR): An expression of the overall efficiency of a test calculated as sensitivity/(1-specificity). Higher numbers indicate a more efficient test. For diagnostic tests, a PLR greater than 3 is felt to be clinically meaningful.
For an efficacy trial of a drug directed against a particular pathology, setting the inclusion cutoff specificity at >90% will reduce that chance of inappropriately exposing individuals lacking the target pathology. This will help in assessing the outcome measures and is an important safety issue when the experimental treatment has the potential to produce toxicity or other serious medical problems.
3. Candidate Biochemical Biomarkers for Alzheimer’s Disease
The ideal biomarker would mark the onset of pathology at an early point in the neurodegenerative process and provide a quantitative estimate of the intensity of pathologic activity. In 2003 a National Institute on Aging (NIA) Working Group identified a number of candidate biochemical biomarkers for therapeutic trials in AD [3]. Although there was no consensus regarding which biomarkers would be most informative in the assessment of new treatments for AD, there has been some progress in evaluating their potential contribution. Table 1 contains a list of selected candidates that will be discussed in this report.
Table 1.
Candidate biochemical biomarkers
| Biomarker | Biological Sample |
|---|---|
| Tau (total tau and p-tau181)* | CSF |
| β-amyloid 42* | CSF, plasma |
| F2-isoprostanes* | CSF, plasma, urine |
| Hydroxyperoxyeicosa-tetraenoic acid† | CSF |
Identified by NIA biomarkers working group as a candidate biomarker of AD.
Not included on the NIA biomarkers working group list.
4. Cerebrospinal Fluid Tau and β-amyloid
The candidate biomarkers of AD best studied are the CSF proteins tau and Aβ. Each are linked to a hallmark pathologic lesions of AD; neuritic plaques (Aβ) and neuro-fibrillary tangles (tau).
Tau encompasses a group of microtubule-associated cytoskeleton proteins that are alternatively spliced to form 6 isoforms containing 352 to 441 amino acids. They play a crucial role in the formation and stabilization of the neuron’s microtubule system. In a number of pathologic conditions, the protein becomes hyperphosphorylated, dissociates from the microtubule, and forms aggregates of paired twisted filaments recognized as neurofibrillary tangles.
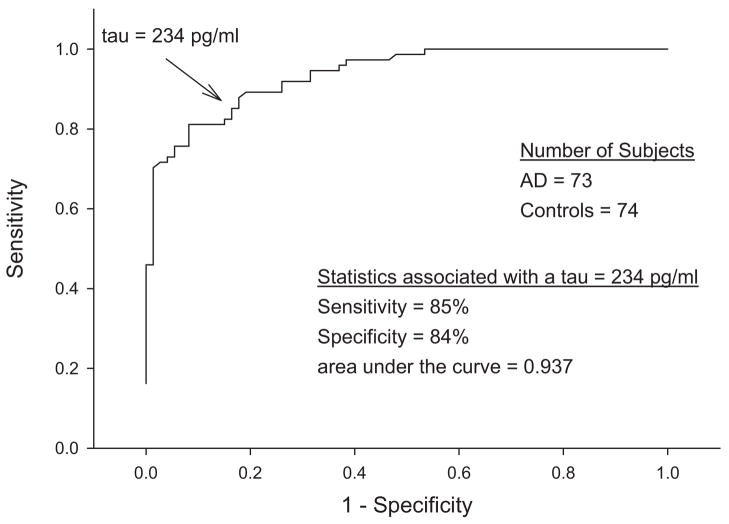
Many studies have confirmed that most (but not all) patients with a clinical diagnosis of AD have increased levels of CSF tau [4]. This association was strengthened with autopsy validation [5]. Importantly, the autopsy-validated study documented that although CSF tau had a sensitivity of 85% and a specificity of 84% to distinguish patients with AD from cognitively normal control subjects, 16% of the AD subjects had CSF total tau levels that were less than cutoff value of 234 pg/mL, and 27% had a value that was less than 2 SD above the mean total tau in the nonautopsy-confirmed control cohort [5]. The AD group with low tau had no distinguishing characteristics, and the biologic basis for this finding remains unknown. The practical implication is that although an elevated CSF tau in a patient with the appropriate cognitive symptoms predicts the presence of AD pathology, a tau level below the cutoff cannot be used as a reliable marker of the absence of pathology. It is unknown if treatments that reduce pathologically elevated CSF tau will also lower the levels in AD patients whose values are below diagnostic cutoff before treatment (Fig. 1).
Fig. 1.
CSF total tau in controls and autopsy-proven AD.
A number of conditions other than AD can elevate CSF tau, including acute stroke, head trauma, and prion diseases. None confound its use as a biomarker in AD clinical trials.
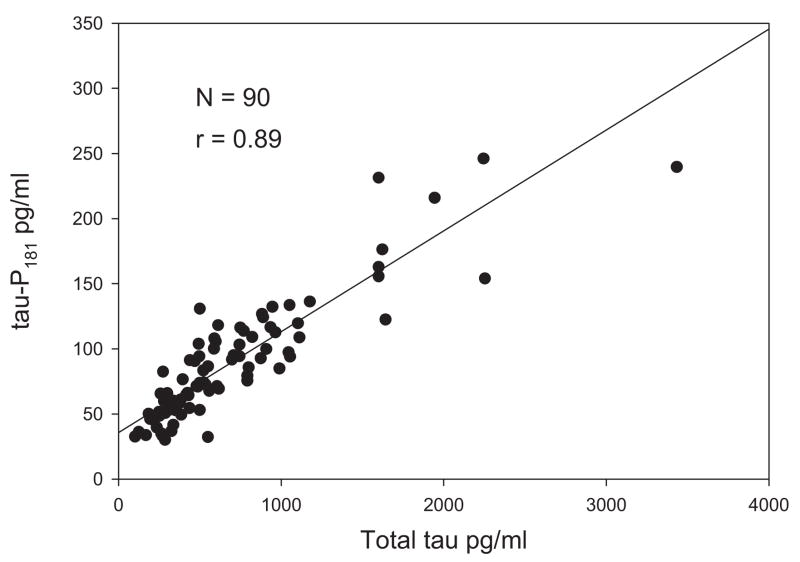
In general, the amount of total tau found in the CSF correlates with the amount measured using antibodies that recognized tau phosphorylated on specific amino acids. Although the cutoff values differ, the diagnostic statistics associated with the ability to distinguish AD from cognitively normal elderly subjects and from elderly subjects with other late-life dementias are similar regardless of whether total tau or one of its phospho epitopes is targeted by the assay as indicated by the tight correlation between CSF total tau and p-tau181 (Fig. 2).
Fig. 2.
Correlation of total tau with p-tau 181 in CSF of patients with AD.
It remains unsettled if antibodies recognizing specific phosphorylation sites are associated more closely with the presence of AD pathology, although some studies suggest this may be the case [6]. Currently, the only commercially available site-specific ELISA identifies tau phosphorylated on amino acid 181.
In general, CSF tau is more helpful in distinguishing between individuals harboring AD pathology from cognitively normal elderly subjects than it is in separating AD patients from those with other clinically defined late-life dementias. Perhaps this is to be expected, given the frequent finding of mixed pathologies in patients with FTD, vascular dementia, Lewy body dementia, and the dementia associated with Parkinson’s disease.
Tables 2 and 3 show the effect of biomarker cutoff levels needed to achieve a diagnostic specificity of 90% when the biomarker is used to aid in the distinction of AD from control subjects (Table 2) or a mixed group of control and other late-life dementing conditions (Table 3).
Table 2.
CSF diagnostic statistics to distinguish patients with a clinical diagnosis of AD from FTD, DLB, IVD and control
| Biomarker | Cutoff | Specificity | Sensitivity | PPV | Overall Accuracy | PLR |
|---|---|---|---|---|---|---|
| Total tau | 558 | 90% | 48% | 87% | 65% | 4.6 |
| p-tau 181 | 81 | 90% | 49% | 86% | 67% | 4.8 |
| A β-42 | 228 | 90% | 32% | 79% | 57.9% | 3.1 |
NOTE. All cutoff values expressed as pg/ml CSF.
Abbreviations: DLB, dementia with Lewy bodies; IVD, ischemic vascular dementia.
Table 3.
CSF diagnostic statistics to distinguish patients with a clinical diagnosis of AD from cognitively normal control subjects
| Biomarker | Cutoff | Specificity | Sensitivity | PPV | Overall Accuracy | PLR |
|---|---|---|---|---|---|---|
| t-tau | 404 | 90% | 69% | 96% | 73% | 7.0 |
| p-tau181 | 77 | 90% | 54.4% | 91% | 66% | 5.2 |
| β-amyloid 42 | 201 | 90% | 26% | 88% | 43% | 2.8 |
NOTE. All cutoff values expressed as pg/ml CSF.
There is general agreement that CSF tau increases quite early in the symptomatic phase of AD and can be detected in its prodromal stage of mild cognitive impairment [7–10]. Whether increased levels can also be reliably detected before the development of any measurable cognitive impairment remains unproven. Anecdotal reports document the existence of cognitively normal control subjects with elevated tau whose disease progresses over several years to clinical AD with subsequent autopsy verification. However, there are also longitudinal control subjects with more than 10 years of observation who remain cognitively normal despite serial spinal taps documenting total tau and p-tau181 levels in the AD range.
Nevertheless, elevated levels of CSF tau can be useful in helping separate individuals destine to progress to AD from those in the prodromal phase of FTD, a distinction that may sharpen the inclusion criteria for phase II clinical trials of disease modifying drugs (Table 4).
Table 4.
CSF values
| AD | MCI | MCI to AD | MCI Stable | FD | Control | |
|---|---|---|---|---|---|---|
| t-tau (SD) | 6 (502) | 500 (359) | 612 (437) | 446 (318) | 376 (364) | 257 (166) |
| Number | 314 | 103 | 40 | 53 | 116 | 86 |
| p-tau181 (SD) | 88 (47) | 74 (37) | 84 (40) | 74 (38) | 55 (24) | 56 (18) |
| Number | 157 | 37 | 13 | 16 | 43 | 71 |
| Aβ- 42 (SD) | 334 (239) | 447 (221) | 393 (153) | 456 (212) | 966 (763) | 469 (208) |
| Number | 226 | 76 | 32 | 35 | 89 | 80 |
Abbreviations: t-tau (SD), total tau pg/mL (SD); p-tau181 (SD), phosopho tau 181 pg/mL (SD); Aβ-42 (SD), the 42 amino acid length fragment in pg/mL (SD); FD, frontal dementia.
Extracellular neuritic plaques, the second hallmark lesion in AD, are composed primarily of β-pleated sheets of fibular amyloid enzymatically cleaved from the transmembrane amyloid precursor protein (APP). The 42 amino acid derivative is especially prone to fibrillation and disproportionably accumulates in neuritic plaques. In doing so, it is thought to act as an “amyloid sink” that, in turn, reduces the amount of A β-42 in the CSF. Numerous studies document this reduction in patients with AD and it is this finding, along with its presence in neuritic plaques, that supports the role of A β as a candidate biomarker of AD pathology [4,11,12]. The correlation between increased positron emission tomography Pittsburgh compound-B (PET PIB) amyloid binding and decreased CSF A β-42 levels lends preliminary support to the amyloid sink hypothesis [13]. However, as a diagnostic biomarker it may provide little significant additional information beyond that obtained from knowing the CSF tau level [5]. Whether it will provide useful information as a marker of efficacy for immunologic-based treatments designed to remove neuritic plaque, or the γ- and β- secretase inhibitor drugs designed to interfere with the production of pathologic amyloid fragments, remains to be seen. Also unknown is whether a change in the CSF A β-42 level will predict clinically meaningful improvement.
Although there is a broad consensus concerning the increased diagnostic certainty associated with knowing the value of the 2 CSF biomarkers most tightly linked to the pathologic lesions of AD, there are a number of important knowledge gaps relevant to understanding the appropriate role of tau and A β-42 as clinical trial biomarkers. Little is know about what happens to these proteins once they enter the CSF compartment. Are they fragmented? How are they affected by the rate of CSF production and circulation? Will adjusting the biomarker concentration measurements for the subjects’ total CSF volume improve their ability to serve as markers of disease progression [14]?
Nevertheless, inclusion of CSF tau and A β-42 as markers of treatment efficacy has the potential to reduce the number of clinical trial subjects needed and may provide positive drug effect signal after a shorter treatment period than is the case with conventional cognitive and functional assessment measures [15].
Most importantly, the ability of alter biochemical biomarkers with treatment remains unproven, and a link between improvement of a biochemical biomarker of pathology and the detection of clinically meaningful functional improvement has not yet been tested.
5. Oxidative Stress
Oxidative stress occurs when the generation of reactive oxygen species exceeds the endogenous capacity of the target tissue to destroy them. Age-related reductions in endogenous antioxidant defense mechanisms increase the brain’s risk for late-life dementias that involve similar mechanisms. In this context, there is growing evidence that excessive oxidative stress is an early pathologic change in AD [16–17]. Both F2 isoprostanes and the metabolic end product of lipoxygenase are potential biochemical biomarkers of this process.
6. Isoprostanes
Oxidative damage is an early feature of AD pathology. Isoprostanes are chemically stable isomers of prostaglandins that are formed nonezymatically by free-radical catalyzed peroxidation of arachidonic acid. The F2 class of isoprostanes (F2-iP) contains up to 64 possible enantiomers. Many have been used as quantitative biochemical markers of oxidative damage.
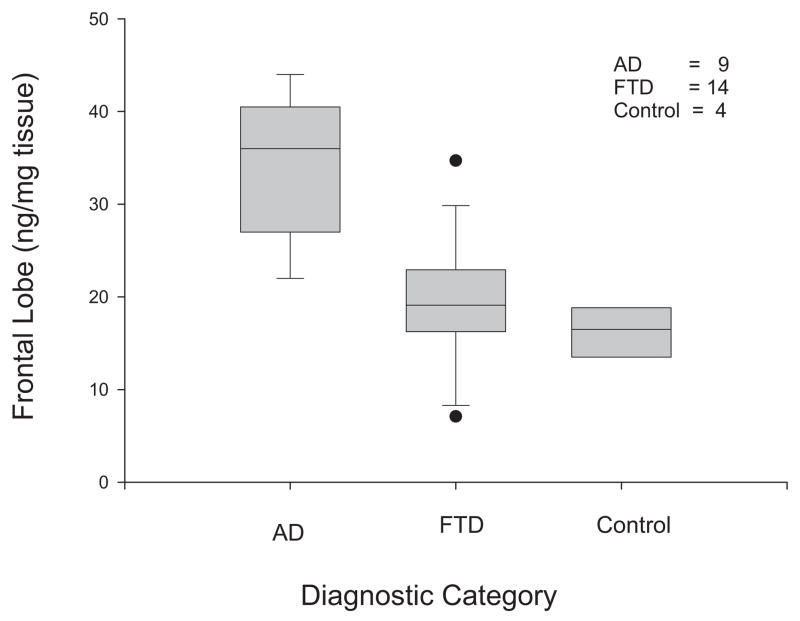
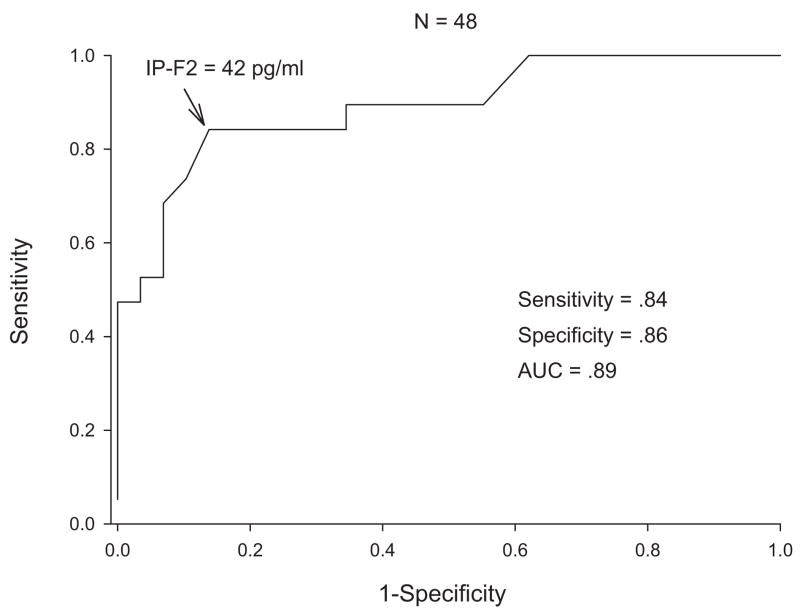
F2-iP are elevated in the brain regions most affected by AD and in the CSF of patients with AD and mild cognitive impairment (MCI) [18–24]. In a study of subjects with a pathologically confirmed diagnosis, CSF levels of greater than 42 pg/mL identified AD with a balanced sensitivity and specificity of 84%, a positive predicative value of 87%, and a negative predictive value of 81%. The positive likelihood ratio was 5.2, and the area under the ROC curve was 0.88 (Figs. 3 & 4).
Fig. 3.
F2 isoprostane in frontal lobes of patients with Alzheimer’s disease, frontal dementia, and controls.
Fig. 4.
CSF F2 isoprostane in patients with autopsy confirmed Alzheimer’s disease and cognitively normal subjects.
In addition to its use as a diagnostic biomarker, F2-iP levels may also provide a biochemical measure of the severity of overall brain failure in patients with AD with CSF levels increasing as patients move from cognitively normal through MCI to AD [25].
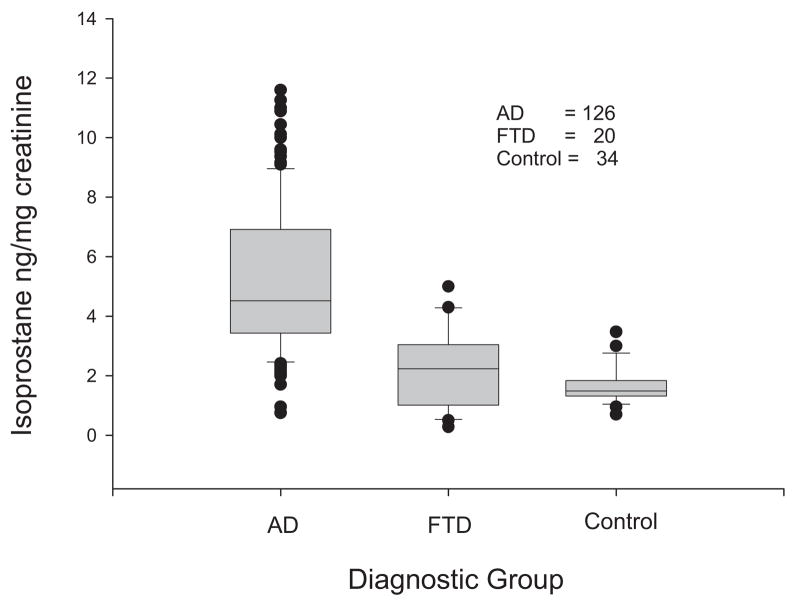
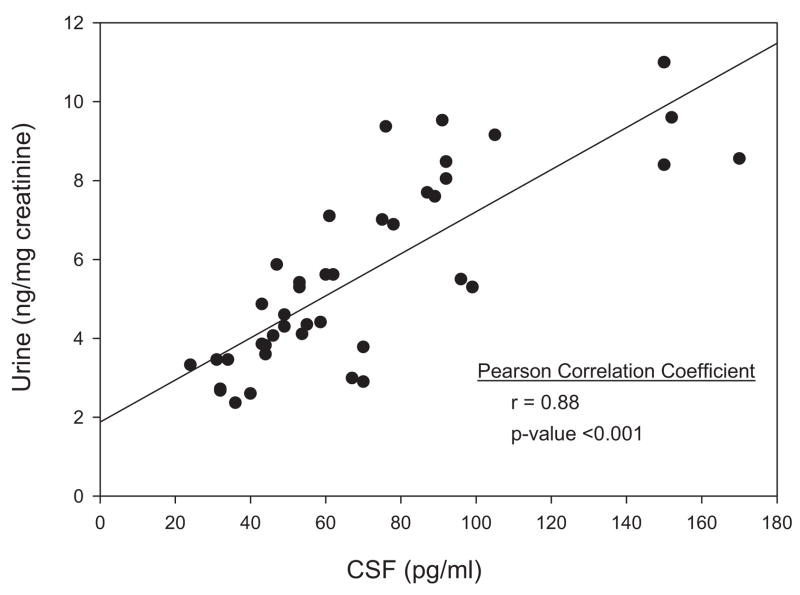
There is less agreement on whether measurements of F2-iP in blood and urine are also reliable indicators of AD neuropathology. Although the precise enantiomer(s) were not identified, one group failed to detect increased levels of F2α-iP in the blood or urine of patients with AD [26]. However, several studies focused on the 8, 12 iso F2α VI isoprostane and found elevated levels in both the blood and urine of AD patients compared with cognitively normal elderly control subjects (Fig. 5) [22,23]. There was a good correlation between the values in the urine and CSF (Fig. 6) suggesting the urine could serve as a reliable marker of changes in the CNS. However, this promising finding with respect to the 8, 12 iso F2α VI isoprostane awaits independent validation and more extensive application to neurodegenerative conditions other than AD.
Fig. 5.
Urine F2 isoprostanes in patients with Alzheimer’s disease, frontal dementia, and control subjects.
Fig. 6.
Correlation of F2 isoprostane in CSF and urine of patients with Alzheimer’s disease.
There are a number of characteristics that favor the use of F2-isoprostanes as biomarkers of AD, both in clinical trials and in the routine evaluation of patients. They have low day-to-day variability (<5% in blood measurements). Once formed, they are not subject to additional enzymatic degradation, and urine samples are stable for up to 12 hours at room temperature. Cerebrospinal fluid and blood samples should be processed and stored at −80°C within several hours.
F2α iP may have an additional advantage in that some very preliminary data suggest CSF levels may increase as the symptomatic expression of brain failure progresses. In a small cohort of subjects followed longitudinally with annual clinical and biomarker assessments CSF, 8, 12 iso F2α VI isoprostanes levels increased as the cognitive performance of a subject declined [14,25].
The 8, 12 iso F2αVI isoprostane assay involves purification by thin-layer chromatography, 2 derivatization steps, and a reversed phase cartridge extraction step followed by negative ion chemical ionization gas chromatography/mass spectrometry. This methodology and the limited availability of the deuterated internal standard needed to perform the assay constrains its widespread application.
7. 12/15-Lipoxygenase
Lipoxgenases (LOX) are a family of nonheme iron di-oxygenase enzymes that contribute to oxidative stress by inserting molecular oxygen into free and esterified polyunsaturated fatty acids in the membranes of neurons and glia, forming hydroperoxy acids such as hyroxyperoxyeicosa-tetraenoic (HETE). Both 12/15-LOX and its metabolic products, 12(S)-HETE and 15(S)-HETE are formed primarily in cerebrum, basal ganglia, and hippocampus and elevated in the frontal and temporal lobes of patients with AD at autopsy. The brain levels were correlated with increased levels of 8, 12 iso F2α VI and inversely correlated with vitamin E levels measured in the same brain regions [27].
Elevated levels of 12(S)- and 15(S)-HETE can also be detected in the CSF of individuals with MCI and AD (Table 5).
Table 5.
CSF 12/15 HETE
| AD | MCI | Controls | |
|---|---|---|---|
| Number of subjects | 20 | 10 | 20 |
| 12(S)-HETE ng/mL (SD) | 20 (1.0) | 17 (2.6) | 9.5 (0.8) |
| 15(S)-HETE ng/mL (SD) | 48 (5.2) | 44 (5.9) | 19.7 (1.1) |
8. Combining Biochemical Biomarkers
Some analyses indicate better diagnostic statistics when combination tau and A β are used. In our autopsy series, we could not demonstrate that adding information about the Takeda A β-42 value to the Innogenetics t-tau value provided any clinically meaningful diagnostic advantage; the outcome of the analysis may be dependent on the specific antibodies used in the assay. We were able to demonstrate in the autopsy series, measuring t-tau and F2-iPs, in the same patient, the PPV for a diagnosis of AD improved if both values were above the diagnostic cutoff. However, predictably, that was counterbalanced by a reduction in the overall diagnostic accuracy (Table 6).
Table 6.
t-tau & F2 iP in diagnosis of pathologically confirmed AD (N = 54)
| One Positive (%) | Both Positive (n%) | |
|---|---|---|
| Sensitivity | 76 | 49 |
| Specificity | 71 | 94 |
| PPV | 85 | 95 |
| NPV | 60 | 46 |
| Overall accuracy | 76 | 63 |
| PLR | 2.7 | 8.3 |
| NLR | 3.3 | 1.8 |
Abbreviations: negative likelihood ratio (NLR), negative predictive value (NPV).
It is reasonable to assume that, in general, the certainty of AD pathology in a subject will increase with each additional biomarker whose value falls above the diagnostic cutoff.
More importantly, in the selection of biochemical biomarkers as surrogate markers of efficacy for disease-modifying therapy, there may be considerable advantage to showing that a treatment directed against one component of the pathology also reduced biomarkers associated with another key pathologic component. For example, it would be especially encouraging if a treatment targeting amyloid (whether a secretase inhibitor or immunotherapy) also reduced CSF tau and F2-iP levels.
9. Conclusion and Future Directions
Biochemical biomarkers hold the potential to mark the earliest presence of late-life neurodegenerative pathology and provide quantitative information about the current level of pathologic activity. In the former capacity, they can be incorporated as inclusion criteria in phase II trials to increase diagnostic reliability when enrolling individuals in the earliest symptomatic phase of the pathology targeted by the experimental treatment.
The successful incorporation of biochemical biomarkers that provide an index of pathologic activity can improve the efficiency of phase II trials by providing adequate power with fewer subjects and shorter observation times. Biochemical biomarkers also have the potential to provide a robust objective indicator of treatment efficacy with less measurement noise than cognitive tests. In addition, they require minimal expense and technical expertise at the data collection site.
Biochemical biomarkers that prove useful in phase II trials would be logical candidates for development as surrogate endpoints in phase III trials, extending their trial design enhancements to that phase of drug development. And if robust enough, once the new medication enters clinical practice, they may prove useful in monitoring a patient’s response to treatment.
It is not clear which biochemical biomarkers are best suited for incorporation into the design of clinical trial protocols for the evaluation of new therapies to modify AD pathology. Most likely a combination of biochemical biomarkers will be more informative that any single biomarker, both with respect to disease identification and as monitors of pathologic activity. Currently, the most robust candidates are t-tau, p-tau181, Aβ-42 and F2-isoprostanes. The most important task ahead is to characterize the performance characteristics of each biomarker as thoroughly as possible and to understand the most efficient combination to provide reliable and informative answers for the questions asked and the outcomes sought. Their measures must be correlated with anatomic, metabolic, and pathologic imaging biomarkers such as regional brain atrophy, [18F]-2-fluoro-deoxy-D-glucose (FDG) positron emission tomography (PET) and imaging using markers with affinity for amyloid. From this will come a better understanding of the relationship between treatment-associated biomarker changes and clinically meaningful outcomes.
There is a critical need to search for new biochemical biomarkers that reflect the most proximal pathologic changes responsible for late-life neurodegenerative dementia. In this respect, it will be important to determine if levels of soluble Aβ oligomers that have been related to functional impairments in the mouse models of AD can be detected and quantified in the CSF of patients.
Lastly, perhaps the most robust evidence that biochemical biomarkers can truly serve as surrogate disease-modifying endpoints in clinical trials of a disease-modifying treatment will be the demonstration that treatments targeting a single point in the pathology, such as amyloid precursor protein γ-secretase inhibitors or Aβ immunotherapy, also lower CSF tau and F2-iP levels.
Biochemical biomarkers provide a laboratory-based method to objectively detect the presence of neurodegenerative pathology at an early stage of disease and to provide the quickest indication of treatment-related effects on the targeted pathology. They hold great potential to serve as surrogate endpoints that can reliably predict clinically meaningful outcomes. Their incorporation into the design of phase II and III clinical trials should significantly accelerate the development of truly effective disease-modifying treatments.
References
- 1.Forman MS, Farmer J, Johnson JK, Clark CM, Arnold SE, Coslett HB, et al. Frontotemporal dementia: Clinicopathological correlations. Ann Neurol. 2006 doi: 10.1002/ana.20873. (In press) [DOI] [PMC free article] [PubMed] [Google Scholar]
- 2.Grossman M, Farmer J, Leight S, Work M, Moore P, Van DV, et al. Cerebrospinal fluid profile in frontotemporal dementia and Alzheimer’s disease. Ann Neurol. 2005;57(5):721–9. doi: 10.1002/ana.20477. [DOI] [PubMed] [Google Scholar]
- 3.Frank RA, Galasko D, Hampel H, Hardy J, de Leon MJ, Mehta PD, et al. Biological markers for therapeutic trials in Alzheimer’s disease. Proceedings of the biological markers working group; NIA initiative on neuroimaging in Alzheimer’s disease Neurobiol Aging. 2003;24(4):521–36. doi: 10.1016/s0197-4580(03)00002-2. [DOI] [PubMed] [Google Scholar]
- 4.Blennow K, Vanmechelen E, Hampel H. CSF total tau, Ab42 and phosphorylated tau protein as biomarkers for Alzheimer’s disease. Mol Neurobiol. 2001;24(1–3):87–97. doi: 10.1385/MN:24:1-3:087. [DOI] [PubMed] [Google Scholar]
- 5.Clark CM, Xie S, Chittams J, Ewbank D, Peskind E, Galasko D, et al. Cerebrospinal fluid tau and beta-amyloid: how well do these biomarkers reflect autopsy-confirmed dementia diagnoses? Arch Neurol. 2003 Dec;60(12):1696–702. doi: 10.1001/archneur.60.12.1696. [DOI] [PubMed] [Google Scholar]
- 6.Hampel H, Buerger K, Zinkowski R, Teipel SJ, Goernitz A, Andreasen N, et al. Measurement of phosphorylated tau epitopes in the differential diagnosis of Alzheimer disease: a comparative cerebrospinal fluid study. Arch Gen Psychiatry. 2004;61(1):95–102. doi: 10.1001/archpsyc.61.1.95. [DOI] [PubMed] [Google Scholar]
- 7.Andreasen N, Vanmechelen E, Vanderstichele H, Davidsson P, Blennow K. Cerebrospinal fluid levels of total-tau, phospho-tau and A beta 42 predicts development of Alzheimer’s disease in patients with mild cognitive impairment. Acta Neurol Scand. 2003;179(Suppl):47–51. doi: 10.1034/j.1600-0404.107.s179.9.x. [DOI] [PubMed] [Google Scholar]
- 8.Arai H, Ishiguro K, Ohno H, Moriyama M, Itoh N, Okamura N, et al. CSF phosphorylated tau protein and mild cognitive impairment: a prospective study. Exp Neurol. 2000;166(1):201–3. doi: 10.1006/exnr.2000.7501. [DOI] [PubMed] [Google Scholar]
- 9.Buerger K, Teipel SJ, Zinkowski R, Blennow K, Arai H, Engel R, et al. CSF tau protein phosphorylated at threonine 231 correlates with cognitive decline in MCI subjects. Neurology. 2002;59(4):627–9. doi: 10.1212/wnl.59.4.627. [DOI] [PubMed] [Google Scholar]
- 10.Hansson O, Zetterberg H, Buchhave P, Londos E, Blennow K, Minthon L. Association between CSF biomarkers and incipient Alzheimer’s disease in patients with mild cognitive impairment: a follow-up study. Lancet Neurol. 2006;5(3):228–34. doi: 10.1016/S1474-4422(06)70355-6. [DOI] [PubMed] [Google Scholar]
- 11.Galasko D, Chang L, Motter R, Clark CM, Kaye J, Knopman, et al. High cerebrospinal fluid tau and low amyloid beta42 levels in the clinical diagnosis of Alzheimer disease and relation to apolipoprotein E genotype. Arch Neurol. 1998;55(7):937–45. doi: 10.1001/archneur.55.7.937. [DOI] [PubMed] [Google Scholar]
- 12.Galasko D. Biological markers and the treatment of Alzheimer’s disease. J Mol Neurosci. 2001;17(2):119–25. doi: 10.1385/JMN:17:2:119. [DOI] [PubMed] [Google Scholar]
- 13.Fagan AM, Mintun MA, Mach RH, Lee SY, Dence CS, Shah AR, et al. Inverse relation between in vivo amyloid imaging load and cerebrospinal fluid Abeta(42) in humans. Ann Neurol. 2006;59(3):512–9. doi: 10.1002/ana.20730. [DOI] [PubMed] [Google Scholar]
- 14.de Leon MJ, DeSanti S, Zinkowski R, Mehta PD, Pratico D, Segal S, et al. MRI and CSF studies in the early diagnosis of Alzheimer’s disease. J Intern Med. 2004;256(3):205–23. doi: 10.1111/j.1365-2796.2004.01381.x. [DOI] [PubMed] [Google Scholar]
- 15.Thal LJ, Kantarci K, Reiman EM, Klunk WE, Weiner MW, Zetterberg H, et al. The Role of biomarkers in clinical trials for Alzheimer disease. Alzheimer Dis Assoc Disord. 2006;20(1):6–15. doi: 10.1097/01.wad.0000191420.61260.a8. [DOI] [PMC free article] [PubMed] [Google Scholar]
- 16.Nunomura A, Perry G, Aliev G, Hirai K, Takeda A, Balraj EK, et al. Oxidative damage is the earliest event in Alzheimer disease. J Neuropathol Exp Neurol. 2001;60(8):759–67. doi: 10.1093/jnen/60.8.759. [DOI] [PubMed] [Google Scholar]
- 17.Pratico D, Uryu K, Leight S, Trojanoswki JQ, Lee VM. Increased lipid peroxidation precedes amyloid plaque formation in an animal model of Alzheimer amyloidosis. J Neurosci. 2001;21(12):4183–7. doi: 10.1523/JNEUROSCI.21-12-04183.2001. [DOI] [PMC free article] [PubMed] [Google Scholar]
- 18.Montine KS, Quinn JF, Zhang J, Fessel JP, Roberts LJ, Morrow JD, et al. Isoprostanes and related products of lipid peroxidation in neurodegenerative diseases. Chem Phys Lipids. 2004;128(1–2):117–24. doi: 10.1016/j.chemphyslip.2003.10.010. [DOI] [PubMed] [Google Scholar]
- 19.Montine TJ, Markesbery WR, Morrow JD, Roberts LJ. Cerebrospinal fluid F2-isoprostane levels are increased in Alzheimer’s disease. Ann Neurol. 1998;44(3):410–3. doi: 10.1002/ana.410440322. [DOI] [PubMed] [Google Scholar]
- 20.Montine TJ, Morrow JD. Fatty acid oxidation in the pathogenesis of Alzheimer’s disease. Am J Pathol. 2005;166(5):1283–9. doi: 10.1016/S0002-9440(10)62347-4. [DOI] [PMC free article] [PubMed] [Google Scholar]
- 21.Pratico D, Lee M-Y, Trojanowski JQ, Rokach J, Fitzgerald GA. Increased F2-isoprostanes in Alzheimer’s disease: evidence for enhanced lipid peroxidation in vivo. FASEB J. 1998;12:1777–83. doi: 10.1096/fasebj.12.15.1777. [DOI] [PubMed] [Google Scholar]
- 22.Pratico D, Clark CM, Lee VM, Trojanowski JQ, Rokach J, Fitzgerald GA. Increased 8,12-iso-iPF2a-VI in Alzheimer’s disease: correlation of a noninvasive index of lipid peroxidation with disease severity. Ann Neurol. 2000;48(5):809–12. [PubMed] [Google Scholar]
- 23.Pratico D, Clark CM, Liu F, Lee VY-M, Trojanowski JQ. Increase of brain oxidative stress in mild cognitive impairment. A possible predictor of Alzheimer disease. Arch Neurol. 2002;59:972–6. doi: 10.1001/archneur.59.6.972. [DOI] [PubMed] [Google Scholar]
- 24.Pratico D, Sung S. Lipid peroxidation and oxidative imbalance: early functional events in Alzheimer’s disease. J Alzheimers Dis. 2004;6(2):171–5. doi: 10.3233/jad-2004-6209. [DOI] [PubMed] [Google Scholar]
- 25.de Leon MJ, DeSanti S, Zinkowski R, Mehta PD, Pratico D, Segal S, et al. Longitudinal CSF and MRI biomarkers improve the diagnosis of mild cognitive impairment. Neurobiol Aging. 2006;27(3):394–401. doi: 10.1016/j.neurobiolaging.2005.07.003. [DOI] [PubMed] [Google Scholar]
- 26.Montine TJ, Quinn JF, Milatovic D, Silbert LC, Dang T, Sanchez S, et al. Peripheral F2-isoprostanes and F4-neuroprostanes are not increased in Alzheimer’s disease. Ann Neurol. 2002;52(2):175–9. doi: 10.1002/ana.10272. [DOI] [PubMed] [Google Scholar]
- 27.Pratico D, Zhukareva V, Yao Y, Uryu K, Funk CD, Lawson JA, et al. 12/15-lipoxygenase is increased in Alzheimer’s disease: possible involvement in brain oxidative stress. Am J Pathol. 2004;164(5):1655–62. doi: 10.1016/S0002-9440(10)63724-8. [DOI] [PMC free article] [PubMed] [Google Scholar]


