Abstract
Inactivating mutations of the tumor suppressor gene, TSC2, are associated with tumorigenesis in tuberous sclerosis complex (TSC) and lymphangioleiomyomatosis (LAM). Statins, as HMG-CoA reductase inhibitors, have the potential to limit the growth of these tumors by limiting the isoprenylation of activated GTPases in Tsc2 null cells. We tested atorvastatin as a therapy for a) ENU-enhanced renal cystadenoma and b) spontaneous liver hemangioma in 129Sv/Jae Tsc2+/- mice. ENU-treated Tsc2+/- mice were given atorvastatin chow (wt/wt 0.1%) for 1 month or 3 months, prior to sacrifice at 6 mo; 129Sv/Jae Tsc2+/- mice were given atorvastatin chow (wt/wt 0.1%) for 6 months prior to sacrifice at 12 mo. All treatment groups were compared to mice of identical genotype and strain background that were fed control chow. Pathological analyses revealed a predominance of renal cystadenoma in ENU-treated, and liver hemangioma in non-ENU-treated 129Sv/Jae Tsc2+/- mice. In both cohorts, serum cholesterol levels and levels of phosphorylated S6 (pS6) and GTP-RhoA in healthy tissue were significantly (> 50%) reduced in atorvastatin treated mice as compared to controls. Following atorvastatin treatment, no significant reduction in tumor size, morphology or pS6 levels was observed for either ENU-associated renal cystadenoma or spontaneous liver hemangioma as compared to the untreated groups. In conclusion, although the marked reduction in cholesterol levels indicates that atorvastatin was effective as an HMG-CoA reductase inhibitor, it not did inhibit the growth of tumors that develop in these Tsc2+/- models, suggesting that it is unlikely to have benefit as a single agent therapy for TSC-associated tumors.
Keywords: Tuberin, TSC2, statin, tumor growth, murine model
Introduction
Mutations in either of two genes, TSC1 and TSC2, are causally linked to the development of tuberous sclerosis complex (TSC), a tumor suppressor gene syndrome characterized by multiple tumors of the brain, kidney, heart and skin (1, 2). Renal involvement by angiomyoliopomas and lung involvement by lymphangioleiomyomatosis (LAM) are both common in TSC, are a significant source of morbidity and mortality, and appear to be due to complete loss of TSC1/TSC2 complex function. Pulmonary LAM is characterized by smooth muscle cell proliferation in nodular lesions with cyst formation. It can be rapidly progressive and fatal, but can also have a slow natural history that spans decades. LAM occurs both in TSC and in sporadic patients without features of TSC. A decade of research has led to improved understanding of the tumor suppressor functions of hamartin and tuberin, the protein products of TSC1 and TSC2, respectively. The hamartin-tuberin complex suppresses the activation of the small GTPase Rheb (ras homolog enriched in brain), through a GTPase activating domain near the C-terminus of tuberin (3, 4). Rheb is a major regulator of mTORC1 (mammalian target of rapamycin complex 1). Thus, in cells lacking functional hamartin or tuberin, elevated levels of active Rheb (GTP-Rheb) lead to constitutive activation of mTORC1, resulting in phosphorylation of p70 S6 kinase (S6K), S6 and 4E-BP1, to regulate protein translation and cell growth (5, 6).
Therapeutic options for TSC tumors, including LAM, have recently focused on targeting mTORC1 (7, 8). Rapamycin, an mTORC1 inhibitor, has a well established role as an immunosuppressant to limit transplant rejection (9, 10) as well as a smooth muscle cell growth inhibitor in vascular stents (11, 12). In addition, Bissler et al. have shown recently in a Phase 1-2 trial that rapamycin has promising activity in decreasing the size of TSC-associated renal angiomyolipomas to an average of 53% of their starting volume in 20 patients who stayed on drug for a year, suggesting possible improvement in pulmonary function in patients with LAM (13). However, benefits appeared to be short-lived, with re-growth of renal tumors to 86% of starting tumor volume on average, during a follow-up period of 1 year off drug, suggesting that continued rapamycin treatment may be necessary for sustained response. Since rapamycin has many potential significant side-effects, including immunosuppression and infection risk (14, 15), and 25% of patients came off treatment in this trial due to side-effects (13), there is a continuing need for alternative treatment approaches.
Statins are lipid lowering agents, with an impressive safety record, that have pleiotropic effects in addition to their cholesterol lowering effect (16). Such pleiotropic benefits range from coronary artery plaque stabilization to anti-proliferative effects on vascular smooth muscle and cancer cells (17). Statins are specific inhibitors of 3-hydroxy-3-methylglutaryl coenzyme A (HMG-CoA) reductase (18). As a result of HMG-CoA reductase inhibition, statins inhibit not only the biosynthesis of cholesterol but also inhibit the synthesis of downstream isoprenoid lipid moieties. The process of isoprenylation (farnesylation and/or geranylgeranylation) is necessary for full functional activity of many small GTPase family members, by enabling them to associate with relevant membranes for downstream signaling (19, 20). Rheb, which is constitutively activated in tuberin-null states, belongs to the Ras family of GTPases and is exclusively farnesylated (21). Moreover, the farnesylation of Rheb is important for the regulation of mTORC1-kinase activity towards S6K (22-24). In contrast, RhoA is typically geranylgeranylated, and although constitutively activated in tuberin null states, its activation remains unaffected by inhibiting mTORC1 kinase (25). We have previously shown that atorvastatin blocks Rheb isoprenylation and downstream phosphorylation of mTOR-S6K-S6 in addition to blocking RhoA activity in tuberin-null cells (26). Atorvastatin resulted in significant and selective reduction of tuberin-null cell growth, making it a potential therapeutic candidate for diseases where tuberin function is dysregulated or lost.
Atorvastatin (aka LipitorR), is a third generation synthetic statin that is widely used clinically and very well tolerated. In this manuscript we describe the in vivo effects of atorvastatin as single agent therapy for renal cystadenoma and liver hemangioma, the two tumors that develop spontaneously at high frequency in Tsc2+/- mice.
Methods
Animals and tissue collection
All procedures were approved by the Children's Hospital Animal Care and Use Committee. Atorvastatin (0.1% wt/wt) was prepared in murine chow (Purina, Richmond, IN); controls were fed standard chow. The dose, 0.1% wt/wt (∼ 100mg/kg/day) was calculated based on the average amount of chow ingested by mice on a daily basis and is the maximum recommended dose of atorvastatin (Pfizer, Inc; (27-29)).
ENU-Treated Cohort (ENU–associated tumors)
Tsc2+/- mice develop kidney tumors (cystadenoma, solid adenoma) and liver hemangiomas at a variable rate that is dependent upon strain (30, 31). To study kidney tumors in these mice, we used mice from a defined strain background (50% C57BL/6, 50% 120Sv/Jae), and treated the mice at P9 with a single dose of N-ethyl-N-nitrosurea (ENU) at 60 micrograms/g IP to accelerate renal tumorigenesis (Pollizzi and Kwiatkowski, unpublished observations). Tumors were allowed to develop, and animals were treated with atorvastatin for either 1 month (n=4) or 3 months (n = 10), prior to sacrifice at 6 months of age. Control mice (n = 7) also received ENU at the same age but were fed standard chow for 6 months.
Non-ENU-treated Cohort (spontaneous tumors)
To study the effects of atorvastatin on spontaneous renal cystadenoma and liver hemangioma development, we used male and female Tsc2+/- mice in the 129/SvJae strain, in which liver hemangioma are common and severe (30, 31). Mice were treated with atorvastatin for 6 months (n=8) prior to sacrifice at 12 months of age, or received a control chow diet (n = 12).
Mice from all cohorts were sacrificed, and blood, lungs, livers and kidneys were harvested for tumor or biochemical analysis.
Standard histology and tumor assessment
Standard histology sections were prepared from mouse kidneys after 10% formalin fixation and cutting into five 1-2 mm sections. After H&E staining, slides were viewed on a Nikon Eclipse E400 microscope, and images were captured using Spot software v4.0.5. Both gross and microscopic kidney pathology was read by a blinded observer (KP) and scored according to a modification of a formula used previously (30, 31). The kidney tumor score for kidney cystadenoma was determined as a summed score for all lesions in a kidney, by scoring each individual tumor grossly as follows: 1 for tumors <1 mm; 2 for 1 to 1.5 mm; 5 for 1.5 to 2 mm; 10 for > 2 mm. Microscopic kidney tumor scores were determined similarly, except that the score for each lesion was multiplied by 2 if the tumor had a papillary component, and by 4 if it was a solid adenoma. The percent cellularity of cystadenoma was determined as the percent of the tumor that contained proliferating cells as opposed to cyst cavity; pure cysts had a score of 0% cellularity while solid adenomas had a score of 100% celluarity.
For mouse liver hemangioma, livers were sectioned throughout at 1mm, and sections were then read to determine the percent involvement by hemangioma on each section by a blinded observer (DK). The percent liver involvement by hemangioma was determined as the weighted average involvement over all sections.
Immunohistochemistry
Immunohistochemistry for phospho-S6 was performed on paraffin-embedded sections as previously described (32). Antibodies used for immunohistochemistry were: pS6 (Ser 235/236) and pS6 (Ser 240/244); Cell Signaling Technology, Bedford, MA. In brief, slides were deparaffinized and antigen retrieval was performed using Dako Target Retrieval Solution pH 6 (Dako, Carpinteria, CA). Sections were stained by the immunoperoxidase technique using AEC (HRP-AEC Cell & Tissue Staining Kit, R&D Systems Inc. Minneapolis, MN) with counterstaining performed using hematoxylin (Dako, Carpinteria, CA). After staining, slides were viewed on a Nikon Eclipse E400 microscope, and images captured using Spot software v4.0.5. Slides were read by a blinded observer (IM) and scored as follows: 0, no detectible tumor-specific stain; 1, light stain, similar to that seen in nearby renal parenchyma; 2, moderately intense stain, higher than that seen in nearby renal parenchyma; 3, strong stain, much higher than surrounding normal renal parenchyma.
Immunoblot analysis
Lung and liver extracts were prepared by homogenization in lysis buffer (50mM Tris pH 7.4, 150mM NaCl, 5mM MgCl2, 1% Triton-X, 10% glycerol) using a dounce homogenizer, beginning with one lobe of the lungs or a small portion of liver. Equal amounts of protein were loaded and analyzed for phospho-S6 levels by immunoblotting as previously described (33). Primary antibodies used were against: pS6 (Ser 235/236), S6, pS6K (Thr 421/424) (Cell Signaling Technology, MA), RhoA and Rheb (Santa Cruz, CA). Secondary horseradish peroxidase (HRP)-conjugated antibody (Cell Signaling Technology, MA) was used with chemiluminescent signal detection by ECL (Cell Signaling Technology, MA). Semi quantitative densitometric analysis was performed by ImageQuant software (Molecular Dynamics, Sunnyvale, CA). Data are expressed as fold-activation relative to control. Images of immunoblots were obtained and cropped using Adobe Photoshop 6.0 (Adobe systems Inc., San Jose, CA).
GTP-RhoA pull-down assay
Whole cell lysate GTP-RhoA was affinity purified using glutathione S-transferase-rhotekin Rho binding domain agarose beads (Upstate/Millipore) as previously described (26).
Measurement of Cholesterol levels
Total and free serum cholesterol levels were measured using a standard ELISA kit (Biovision Cholesterol/Cholesteryl Ester Quantitation Kit, Mountain View, CA). Approximately 1 ml of whole blood was removed at the time of sacrifice. Blood was centrifuged at 10,000g for 5 mins. Serum was removed and stored at -80°C until analysis. All samples were analyzed together and in duplicate. Cholesterol reaction mix with and without cholesterol esterase was added to each sample and incubated at 37°C for 1hr. Fluorescence was measured at Excitation/Emisson wavelengths of 540/595 nm (Tecan Spectrafluor PLUS, Offenburg, Germany). Readings were corrected for background and read off of a standard curve.
Statistical Analysis
Results are expressed as mean ± SD. Statistical analysis using a non-parametric Kruskal-Wallis ANOVA with Dunn's multiple comparison test for follow-up analysis was performed using GraphPad Prism 3.0 software.
Results
ENU-treated Tsc2+/- mice (accelerated renal cystadenoma)
Survival and Tumor type
All mice (with the exception of one) survived to the age of 6 months. The kidney tumors that were observed in ENU-treated Tsc2+/- mice were histologically similar to those previously reported in non-ENU-treated mice of age 12-18 months (30, 31). Liver hemangiomas were not observed in this cohort of mice. Histological analysis of ENU-associated kidney tumors in both control and atorvastatin treatment groups revealed multiple cystadenoma (Figure 1) that on gross inspection were not appreciably different.
Figure 1. Histological appearance of ENU-induced renal cystadenoma in Tsc2+/- mice.
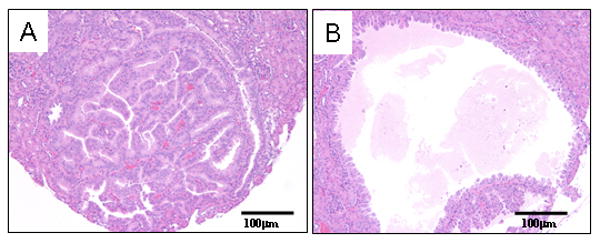
H&E stained sections show the two major tumor types in the kidneys of Tsc2+/- mice: solid adenoma (1A); cystadenoma (1B). Magnification is 20×.
Cholesterol levels
Chow weight was measured on a weekly basis, and no significant difference in chow consumption was observed between control and atorvastatin treatment groups, 1 month or 3 months. Figure 2A shows that there was a major, significant reduction in serum total cholesterol levels (65% ± 2% decrease, 1m; 66% ± 2% decrease, 3m; mean ± SD; p < 0.001) and in free cholesterol levels (81% ± 3% decrease, 1m; 79% ± 2% decrease, 3m; mean ± SD; p < 0.001) in the atorvastatin-treated mice. Total and free cholesterol levels were similar in the 3 month and 1 month atorvastatin treatment cohorts.
Figure 2. Serum cholesterol levels and kidney tumor size in response to atorvastatin therapy in ENU-treated Tsc2+/- mice.
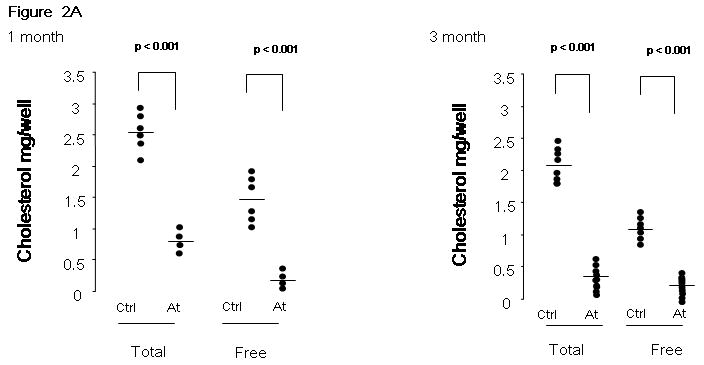
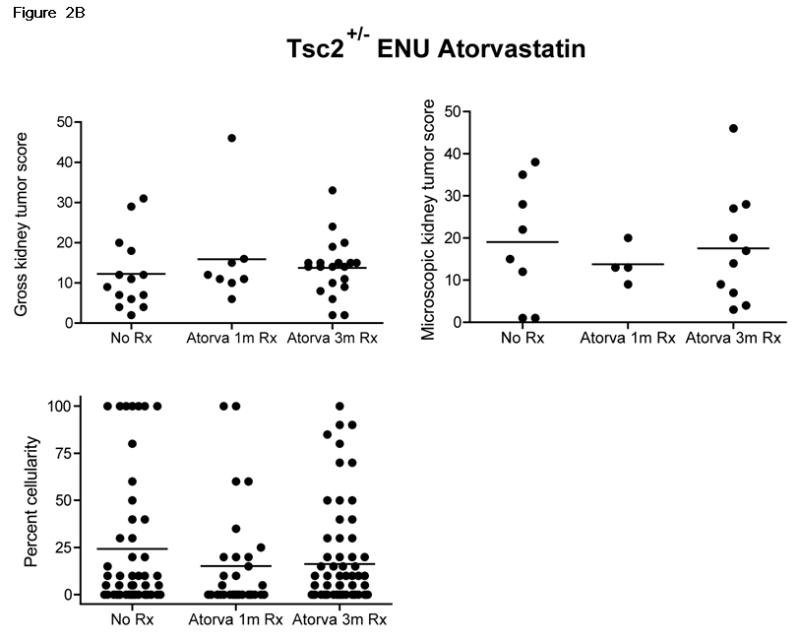
A. Total and free serum cholesterol was measured in atorvastatin treated (At) and control mice (Ctrl), after 1 month or 3 months of therapy. Significance is indicated. B. Gross and microscopic kidney tumor scores and percent cellularity scores from control (No Rx) and atorvastatin (Atorva 1m Rx, Atorva 3m Rx) treated mice are shown. The horizontal bar among the data indicates median.
Gross and microscopic tumor scores
Both gross and microscopic kidney tumor scores were similar among the control, atorvastatin 1 month, and atorvastatin 3 month treatment groups (Figure 2B, p = 0.52 for gross, p = 0.84 for microscopic; control 12.3 ± 9.1, atorvastatin 1 month 15.9 ± 12.5, atorvastatin 3 month 13.7 ± 7.1; mean ± SD for gross scores). In addition, the percent cellularity did not differ according to treatment (Figure 2B, p = 0.36), suggesting that there was no effect on the rate of proliferation of kidney tumors in mice treated with atorvastatin.
Phospho-S6 and GTP-RhoA levels
Immunoblot analysis of healthy lung and liver homogenates in mice treated with atorvastatin for 1 month (Figure 3A) showed significant and consistent reduction in phospho-S6K (pS6K, Thr 421/424) and phospho-S6 (pS6, Ser 235/236) levels (p < 0.001 for all comparisons). Similar significant reductions in GTP-RhoA levels were also observed in atorvastatin-treated mice (Figure 3A) (p < 0.001). Immunoblot analysis of lung and liver homogenates in the atorvastatin 3 month cohort (Figure 3B) showed similar major reductions in pS6K (Thr 421/424), pS6 (Ser 235/236) and GTP-RhoA levels (Figure 3B) (p < 0.01 for all comparisons).
Figure 3. pS6 and GTP-RhoA levels in healthy tissues of atorvastatin and control Tsc2+/- mice.
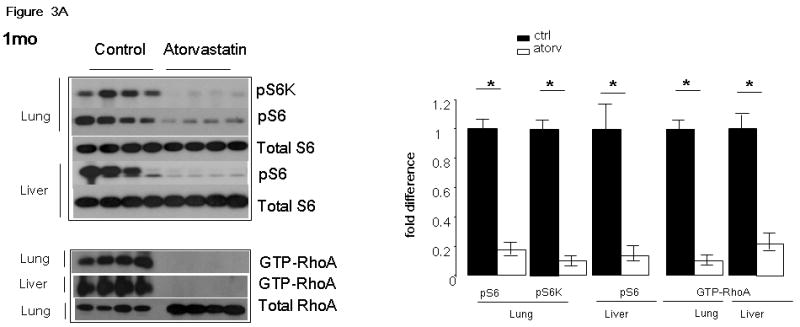
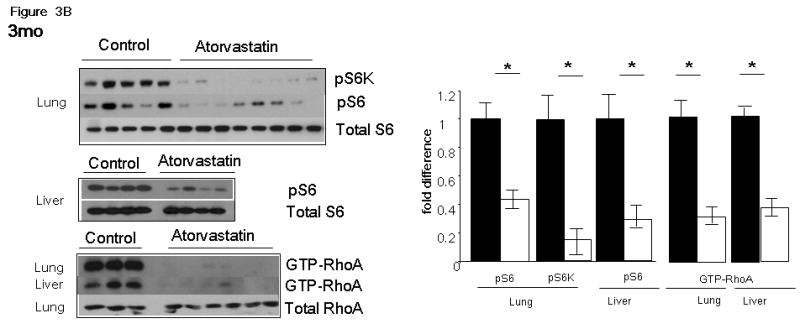
Immunoblots of whole tissue lysates of the lungs and the livers of a representative cohort of mice treated with atorvastatin for 1 month (A) and 3 months (B) are shown. pS6K(T421/4) (pS6K), pS6(S235/6) (pS6), total S6, GTP-RhoA and total RhoA were assessed in control and atorvastatin treated mice. Intensity of bands was measured by densitometry and are expressed as fold difference of levels in atorvastatin (Atorv) mice compared to controls (Ctrl). Significance (p < 0.05) is indicated by *. These images are cropped and full length blots shown in Figures 3A & 3B can be viewed in supplemental Figures 1S and 2S respectively.
Non-ENU-treated 129/SvJae Tsc2+/- mice (spontaneous liver hemangioma)
Survival and Tumor type
The Tsc2+/- mice were evaluated at 12 months of age; in this strain (129/SvJae) liver hemangioma predominate (Figure 4A) and kidney cystadenoma are less common. There were no deaths observed during the 12 months of this trial.
Figure 4. Effects of atorvastatin on serum cholesterol, kidney and liver tumors that arise spontaneously in Tsc2+/- mice.
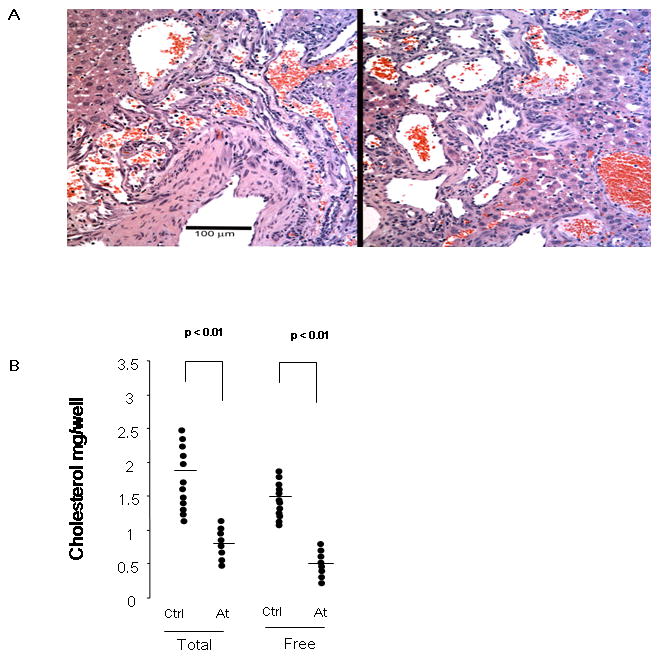
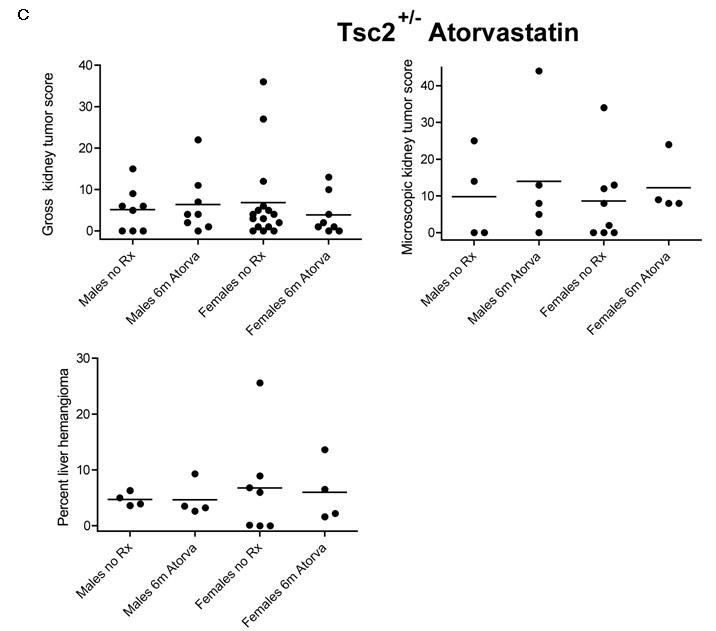
A. Images of H&E stained sections of Tsc2+/- liver hemangioma are shown. Left panel, an untreated 1 year old female mouse; right panel, a 1 year old female mouse treated with atorvastatin for 6 months. Note tortuous irregular vascular channels, some blood-filled, with hyperplastic endothelial cells; magnification is 20×. B. Total and free serum cholesterol was compared in atorvastatin treated mice (At) and controls (Ctrl). Significance is indicated. C. Gross and microscopic kidney tumor scores and percent cellularity of liver hemangioma from control (No Rx) and atorvastatin (Atorva) treated mice are shown. Gender is indicated. The horizontal bar among the data indicates median.
Cholesterol levels
No difference in consumption of chow was observed between control and treatment groups (data not shown). A major reduction in serum total (58% ± 6% decrease; mean ± SD; p < 0.01) and free (71% ± 4% decrease; mean ± SD; p < 0.01) cholesterol levels was seen in the atorvastatin treated mice (Figure 4B).
Gross and microscopic tumor scores
Both gross and microscopic kidney tumor scores were similar in the control and atorvastatin treatment groups (Figure 4C, p = 0.86 for gross, p = 0.83 for microscopic; control males 5.1 ± 5.2, atorvastatin males 6.4 ± 7.2, control females 6.8 ± 10.2, atorvastatin females 3.9 ± 4.9, mean ± SD for gross scores). Although the gross kidney tumor scores were somewhat lower in atorvastatin treated females compared to controls, this did not achieve statistical significance, and showed the opposite trend in the microscopic kidney tumor scores.
Similar to findings in Tsc1 +/- mice, liver hemangioma were somewhat more severe in female compared to male mice (30). However, there was no evidence of a treatment response to atorvastatin based upon quantitative assessment of percent liver hemangioma (Figure 4C, p = 0.98; control males 4.7 ± 1.2, atorvastatin males 4.7 ± 3.1, control females 6.8 ± 9.1, atorvastatin females 6.0 ± 5.5, mean ± SD).
pS6 and GTP-RhoA levels
Similar to the ENU-treated cohort, immunoblot analysis of lung homogenates (Figure 5) showed significant reduction in pS6K, (Thr 421/424; (2.39-fold reduction ± 0.22; mean ± SD; p < 0.05), pS6 (Ser 235/236; 1.88-fold reduction ± 0.12; mean ± SD; p < 0.05) and GTP-RhoA (2.14-fold reduction ± 0.20; mean ± SD; p < 0.05) levels in atorvastatin-treated mice.
Figure 5. Effects of atorvastatin on phospho-S6 and GTP-RhoA levels in healthy tissues of Tsc2+/- mice.
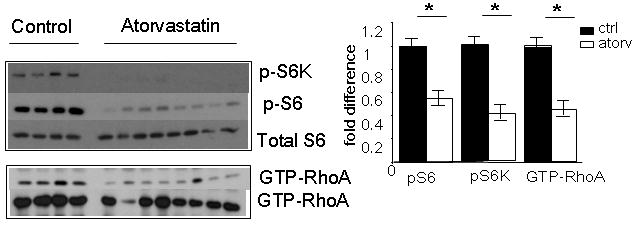
Imunoblots of whole tissue lysates from lung are shown. Levels of phospho-T421/4-S6 kinase (pS6K), phospho-S235/6-S6 (pS6), total S6, GTP-RhoA and total RhoA were compared in vehicle control mice and those treated with atorvastatin for 6 months. Densitometric evaluation of the indicated proteins was calculated and expressed as fold difference of levels in atorvastatin (Atorv) treated mice compared to vehicle controls (Ctrl). Significance (p > 0.05) is indicated by *. These images are cropped and full length blots shown in Figure 5 can be viewed in supplemental Figure 3S.
We also performed histological analysis of kidney tumors in both control and atorvastatin treatment groups to examine potential effects of drug on pS6 expression by the cystadenomas. Cystadenomas expressed variable levels of phospho-S6, which did not differ significantly according to treatment group (Figure 6). To confirm effects of atorvastatin treatment on Rheb and RhoA, we examined organ extracts by immunoblotting. Rheb could not be detected in liver extracts, in contrast to cultured cell lysates. However, we observed increased levels of RhoA in atorvastatin-treated mouse liver extracts (Figure 6C), consistent with depletion of the isoprenoid pool and altered distribution of RhoA, as reported previously (34).
Figure 6. Phospho-S6 immunostaining in kidney tumors and G protein levels in atorvastatin treated and control Tsc2+/- mice.
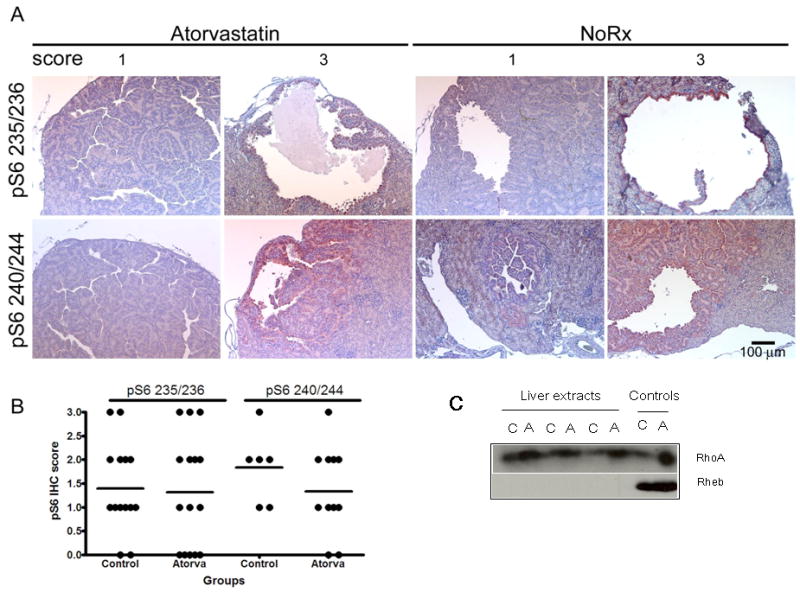
A. Representative images of phospho-S6 staining (red-brown stain) in control (No Rx) and atorvastatin treated renal cystadenoma; magnification is 20×. Upper panel shows staining for the Ser 235/236 pS6 antibody and lower panel shows staining for the Ser 240/244 pS6 antibody. Note the variable levels (scores 0 thru 3) of staining in both control and atorvastatin treated tumors. B. Comparison of staining intensity for pS6 (pS6 IHC score) in mice treated with atorvastatin for 6 mo (Atorva) and controls. Separate scores for the two pS6 antibodies are shown. C. Immunoblots for RhoA and Rheb resolved on large gels on liver extracts from control (C) and atorvastatin-treated (A) mice. Controls (right) are lysates from ELT3 cells treated with either vehicle (C) or atorvastatin (A). Note that the Rheb signal is not detectable in these liver extracts, while RhoA appears increased in atorvastatin-treated mice, but migration is not changed. Full length blots shown in Figure 6C can be viewed in supplemental Figure 4S.
Discussion
The statins, as pharmacological inhibitors of HMG CoA reductase, have a wide array of biological effects including anti-proliferative and anti-cancer properties (17, 35-37). Our results indicate that atorvastatin, given at near maximal dosage with major effects on both total and free serum cholesterol, had little or no effect on the size of ENU-accelerated or spontaneous tumors in Tsc2+/- mice. This study was prompted by in vivo observations that atorvastatin was highly selective and effective at inhibiting growth of cells lacking Tsc2 (26). Although no murine model perfectly replicates the tumor spectrum seen in TSC and LAM patients, we chose to test this therapy in a Tsc2+/- model where tumors develop de-novo to more closely parallel human TSC and LAM. LAM cells in human lung and tumors that develop in both human TSC and Tsc2+/- mice have all been shown to bear markers of Rheb-mTORC1-S6K activation (31, 38, 39), and growth of LAM lesions and TSC-associated tumors are relatively indolent. In addition, mTORC1 inhibition using rapamycin or rapamycin analogues is highly effective at preventing and reducing the extent of the Tsc2+/- renal tumors (40). Thus, as an inhibitor of Rheb prenylation, the failure of atorvastatin to appreciably alter tumor morphology or tumor size in Tsc2+/- mice was rather surprising.
All statins undergo significant first-pass metabolism in the liver (41). Our data show a significant (>50%) reduction of hepatic pS6 levels, and reduced serum cholesterol indicating robust HMG-CoA Reductase blockade with the dose of atorvastatin used here. In addition, S6 phosphorylation and GTP-RhoA levels were significantly lower in the lungs of atorvastatin treated animals, suggesting pharmacologically bioactive drug in serum and target organs outside of the liver. The dose of atorvastatin used was approximately 50 times that required to lower cholesterol levels and was the maximum tolerated dose as determined by previous experiments (26). In addition, no apparent toxicities or deaths were observed in the treatment arms, suggesting that the dose was not too high. It could be postulated that administration of drug by injection could have led to higher bioavailability. However, oral administration is the norm for statin use in human patients. Furthermore, the dose used in this study is similar to that reported to cause successful outcomes in other murine cancer models using oral statins (29, 42, 43). Last, the duration of atorvastatin treatment ranged from 4 weeks to 6 months with the consistent observation that tumor size and morphology remained unchanged. These data suggest that failure of atorvastatin to affect tumor size did not relate to dose, lack of systemic levels, ineffective HMG CoA Reductase blockade, treatment duration or method of administration.
Murine models of melanoma, mammary, prostate and colon cancer have all been responsive to a variety of oral or intraperitoneal statins including pravastatin, lovastatin and atorvastatin (43-46). However, in the present study, tumor volume as well as cellularity and pS6 expression showed no response to atorvastatin. We consider two possible explanations for this lack of sensitivity to atorvastatin. First, it is possible that levels of drug within tumors were reduced in comparison to other cell types and tissues. However, this seems unlikely since the drug was effective in the treatment of other tumor types, although this may relate to effects on pathways other than mTOR signaling. Second, it is possible that there was incomplete in vivo inhibition of G protein function, specifically Rheb and RhoA within tumor cells, in contrast to what was seen in normal tissues. Consistent with this possibility, it is known that while atorvastatin has significant effect as an inhibitor of Rheb and RhoA prenylation, levels of the active GTP-bound G proteins are not completely eliminated by micromolar concentrations of atorvastatin (26). In addition, residual farnesylated Rheb can be detected even after prolonged treatment with atorvastatin. Similarly, we and others have shown that when the ability of Rheb to be farnesylated is altered, either by statins or by the expression of farnesylation mutant Rheb, inhibition of S6 phosphorylation, although significant, does not return to baseline (4, 26). Thus, it is possible that in Tsc2 null tumors in vivo, in which there is no GAP activity for Rheb and markedly elevated Rheb-GTP levels, that the inhibition of farnesylation by atorvastatin is not sufficient to block mTORC1 activation.
In conclusion, several large scale human population studies have indicated that statins may reduce the risk of development of several different cancer types (47-49). In this preclinical study, however, atorvastatin was not effective at reducing the frequency or severity of renal cystadenoma and liver hemangioma in Tsc2+/- mice. Nonetheless, an effective dose was delivered, as assessed by mTOR pathway effects in normal tissues, marked reduction in serum cholesterol, and effects on RhoA. Based upon these findings, caution is appropriate in considering statins as potential monotherapy for patients with either TSC-associated tumors or LAM. However, combination therapy or other novel approaches involving statins may prove to have benefit.
Supplementary Material
Figure 1S. Immunoblots of whole tissue lysates from the lungs and livers of mice treated with atorvastatin for 1 month. Phospho-T421/4-S6 kinase (pS6K), phospho-S235/6-S6 (pS6), total S6, GTP-RhoA and total RhoA levels in vehicle control and atorvastatin treated mice are shown (arrows). Molecular weight markers, positive control (+ ctl) and tissue source are indicated.
Figure 2S. Immunoblots of whole tissue lysates from the lungs and livers of mice treated with atorvastatin for 3 months. Phospho-T421/4-S6 kinase (pS6K), phospho-S235/6-S6 (pS6), total S6, GTP-RhoA and total RhoA levels in vehicle control and atorvastatin treated mice are shown (arrows). Molecular weight markers, positive control (+ ctl) and tissue source are indicated.
Figure 3S. Imunoblots of whole tissue lysates from the lungs of mice treated with atorvastatin for 6 months is shown. Levels of phospho-T421/4-S6 kinase (pS6K), phospho-S235/6-S6 (pS6), total S6, GTP-RhoA and total RhoA were compared in vehicle control and atorvastatin treated mice. Molecular weight markers, positive control (+ ctl) and tissue source are indicated.
Figure 4S. Imunoblots of whole tissue lysates from the livers of mice treated with atorvastatin for 6 months is shown. Immunoblots showing RhoA and Rheb resolved on large gels in control (C) and atorvastatin-treated (A) tissue lysates derived from liver. Positive controls (Pos Ctls) using vehicle (C) atorvastatin-treated (A) cell lysates are shown were used for identification. Molecular weight markers are indicated.
Acknowledgments
Financial support: This work was funded by The LAM Foundation, NIH K08HLO74113-03 and NIH NCI P01CA120964.
Abbreviations
- TSC
Tuberous Sclerosis Complex
- LAM
lymphangioleiomyomatosis
- Rheb
ras homolog enriched in brain
- mTORC1
mammalian target of rapamycin complex 1
- HMG-CoA
3-hydroxy-3-methylglutaryl coenzyme A
- ENU
N-ethyl-N-nitrosurea
Footnotes
Conflict of Interest: None
References
- 1.Identification and characterization of the tuberous sclerosis gene on chromosome 16. The European Chromosome 16 Tuberous Sclerosis Consortium. 1993 doi: 10.1016/0092-8674(93)90618-z. [DOI] [PubMed] [Google Scholar]
- 2.van Slegtenhorst M, de Hoogt R, Hermans C, et al. Identification of the tuberous sclerosis gene TSC1 on chromosome 9q34. Science. 1997;277(5327):805–8. doi: 10.1126/science.277.5327.805. [DOI] [PubMed] [Google Scholar]
- 3.Li Y, Corradetti MN, Inoki K, Guan KL. TSC2: filling the GAP in the mTOR signaling pathway. Trends Biochem Sci. 2004;29(1):32–8. doi: 10.1016/j.tibs.2003.11.007. [DOI] [PubMed] [Google Scholar]
- 4.Li Y, Inoki K, Guan KL. Biochemical and functional characterizations of small GTPase Rheb and TSC2 GAP activity. Mol Cell Biol. 2004;24(18):7965–75. doi: 10.1128/MCB.24.18.7965-7975.2004. [DOI] [PMC free article] [PubMed] [Google Scholar]
- 5.Inoki K, Li Y, Zhu T, Wu J, Guan KL. TSC2 is phosphorylated and inhibited by Akt and suppresses mTOR signalling. Nat Cell Biol. 2002;4(9):648–57. doi: 10.1038/ncb839. [DOI] [PubMed] [Google Scholar]
- 6.Potter CJ, Huang H, Xu T. Drosophila Tsc1 functions with Tsc2 to antagonize insulin signaling in regulating cell growth, cell proliferation, and organ size. Cell. 2001;105(3):357–68. doi: 10.1016/s0092-8674(01)00333-6. [DOI] [PubMed] [Google Scholar]
- 7.Goncharova EA, Goncharov DA, Eszterhas A, et al. Tuberin regulates p70 S6 kinase activation and ribosomal protein S6 phosphorylation: a role for the TSC2 tumor suppressor gene in pulmonary lymphangioleiomyomatosis (LAM) J Biol Chem. 2002;3:3. doi: 10.1074/jbc.M202678200. [DOI] [PubMed] [Google Scholar]
- 8.Jozwiak J, Jozwiak S, Oldak M. Molecular activity of sirolimus and its possible application in tuberous sclerosis treatment. Med Res Rev. 2006;26(2):160–80. doi: 10.1002/med.20049. [DOI] [PubMed] [Google Scholar]
- 9.Giron F, Baez Y, Nino-Murcia A, Rodriguez J, Salcedo S. Conversion therapy to everolimus in renal transplant recipients: results after one year. Transplant Proc. 2008;40(3):711–3. doi: 10.1016/j.transproceed.2008.03.012. [DOI] [PubMed] [Google Scholar]
- 10.Zimmerman MA, Trotter JF, Wachs M, et al. Sirolimus-based immunosuppression following liver transplantation for hepatocellular carcinoma. Liver Transpl. 2008;14(5):633–8. doi: 10.1002/lt.21420. [DOI] [PubMed] [Google Scholar]
- 11.Groeneveld PW, Matta MA, Greenhut AP, Yang F. Drug-eluting compared with bare-metal coronary stents among elderly patients. J Am Coll Cardiol. 2008;51(21):2017–24. doi: 10.1016/j.jacc.2008.01.057. [DOI] [PubMed] [Google Scholar]
- 12.Maresta A, Varani E, Balducelli M, et al. Comparison of Effectiveness and Safety of Sirolimus-Eluting Stents Versus Bare-Metal Stents in Patients With Diabetes Mellitus (from the Italian Multicenter Randomized DESSERT Study) Am J Cardiol. 2008;101(11):1560–6. doi: 10.1016/j.amjcard.2008.01.040. [DOI] [PubMed] [Google Scholar]
- 13.Bissler JJ, McCormack FX, Young LR, et al. Sirolimus for angiomyolipoma in tuberous sclerosis complex or lymphangioleiomyomatosis. N Engl J Med. 2008;358(2):140–51. doi: 10.1056/NEJMoa063564. [DOI] [PMC free article] [PubMed] [Google Scholar]
- 14.Luque AG, Cordero E, Torello J, et al. Sirolimus-Associated Pneumonitis in Heart Transplant Recipients (July/August) Ann Pharmacother. 2008 doi: 10.1345/aph.1l044. [DOI] [PubMed] [Google Scholar]
- 15.Smith MP, Newstead CG, Ahmad N, et al. Poor tolerance of sirolimus in a steroid avoidance regimen for renal transplantation. Transplantation. 2008;85(4):636–9. doi: 10.1097/TP.0b013e3181613e65. [DOI] [PubMed] [Google Scholar]
- 16.Grundy SM. HMG-CoA reductase inhibitors for treatment of hypercholesterolemia. N Engl J Med. 1988;319(1):24–33. doi: 10.1056/NEJM198807073190105. [DOI] [PubMed] [Google Scholar]
- 17.Dulak J, Loboda A, Jazwa A, et al. Atorvastatin affects several angiogenic mediators in human endothelial cells. Endothelium. 2005;12(56):233–41. doi: 10.1080/10623320500476559. [DOI] [PMC free article] [PubMed] [Google Scholar]
- 18.Goldstein JL, Brown MS. Regulation of the mevalonate pathway. Nature. 1990;343(6257):425–30. doi: 10.1038/343425a0. [DOI] [PubMed] [Google Scholar]
- 19.Adamson P, Marshall CJ, Hall A, Tilbrook PA. Post-translational modifications of p21rho proteins. J Biol Chem. 1992;267(28):20033–8. [PubMed] [Google Scholar]
- 20.Zhang FL, Casey PJ. Protein prenylation: molecular mechanisms and functional consequences. Annu Rev Biochem. 1996;65:241–69. doi: 10.1146/annurev.bi.65.070196.001325. [DOI] [PubMed] [Google Scholar]
- 21.Aspuria PJ, Tamanoi F. The Rheb family of GTP-binding proteins. Cell Signal. 2004;16(10):1105–12. doi: 10.1016/j.cellsig.2004.03.019. [DOI] [PubMed] [Google Scholar]
- 22.Castro AF, Rebhun JF, Clark GJ, Quilliam LA. Rheb binds tuberous sclerosis complex 2 (TSC2) and promotes S6 kinase activation in a rapamycin- and farnesylation-dependent manner. J Biol Chem. 2003;278(35):32493–6. doi: 10.1074/jbc.C300226200. [DOI] [PubMed] [Google Scholar]
- 23.Long X, Lin Y, Ortiz-Vega S, Yonezawa K, Avruch J. Rheb binds and regulates the mTOR kinase. Curr Biol. 2005;15(8):702–13. doi: 10.1016/j.cub.2005.02.053. [DOI] [PubMed] [Google Scholar]
- 24.Tee AR, Manning BD, Roux PP, Cantley LC, Blenis J. Tuberous sclerosis complex gene products, Tuberin and Hamartin, control mTOR signaling by acting as a GTPase-activating protein complex toward Rheb. Curr Biol. 2003;13(15):1259–68. doi: 10.1016/s0960-9822(03)00506-2. [DOI] [PubMed] [Google Scholar]
- 25.Goncharova E, Goncharov D, Noonan D, Krymskaya VP. TSC2 modulates actin cytoskeleton and focal adhesion through TSC1-binding domain and the Rac1 GTPase. J Cell Biol. 2004;167(6):1171–82. doi: 10.1083/jcb.200405130. [DOI] [PMC free article] [PubMed] [Google Scholar]
- 26.Finlay GA, Malhowski AJ, Liu Y, Fanburg BL, Kwiatkowski DJ, Toksoz D. Selective inhibition of growth of tuberous sclerosis complex 2 null cells by atorvastatin is associated with impaired Rheb and Rho GTPase function and reduced mTOR/S6 kinase activity. Cancer Res. 2007;67(20):9878–86. doi: 10.1158/0008-5472.CAN-07-1394. [DOI] [PubMed] [Google Scholar]
- 27.Kleemann R, Verschuren L, de Rooij BJ, et al. Evidence for anti-inflammatory activity of statins and PPARalpha activators in human C-reactive protein transgenic mice in vivo and in cultured human hepatocytes in vitro. Blood. 2004;103(11):4188–94. doi: 10.1182/blood-2003-11-3791. [DOI] [PubMed] [Google Scholar]
- 28.Palmer G, Chobaz V, Talabot-Ayer D, et al. Assessment of the efficacy of different statins in murine collagen-induced arthritis. Arthritis Rheum. 2004;50(12):4051–9. doi: 10.1002/art.20673. [DOI] [PubMed] [Google Scholar]
- 29.Swamy MV, Patlolla JM, Steele VE, Kopelovich L, Reddy BS, Rao CV. Chemoprevention of familial adenomatous polyposis by low doses of atorvastatin and celecoxib given individually and in combination to APCMin mice. Cancer Res. 2006;66(14):7370–7. doi: 10.1158/0008-5472.CAN-05-4619. [DOI] [PubMed] [Google Scholar]
- 30.Kwiatkowski DJ, Zhang H, Bandura JL, et al. A mouse model of TSC1 reveals sex-dependent lethality from liver hemangiomas, and up-regulation of p70S6 kinase activity in Tsc1 null cells. Hum Mol Genet. 2002;11(5):525–34. doi: 10.1093/hmg/11.5.525. [DOI] [PubMed] [Google Scholar]
- 31.Onda H, Lueck A, Marks PW, Warren HB, Kwiatkowski DJ. Tsc2(+/-) mice develop tumors in multiple sites that express gelsolin and are influenced by genetic background. J Clin Invest. 1999;104(6):687–95. doi: 10.1172/JCI7319. [DOI] [PMC free article] [PubMed] [Google Scholar]
- 32.Lueck A, Brown D, Kwiatkowski DJ. The actin-binding proteins adseverin and gelsolin are both highly expressed but differentially localized in kidney and intestine. J Cell Sci. 1998;111(Pt 24):3633–43. doi: 10.1242/jcs.111.24.3633. [DOI] [PubMed] [Google Scholar]
- 33.Finlay GA, York B, Karas RH, et al. Estrogen-induced smooth muscle cell growth is regulated by tuberin and associated with altered activation of PDGFR-beta and ERK-1/2. J Biol Chem. 2004;23:23. doi: 10.1074/jbc.M401912200. [DOI] [PubMed] [Google Scholar]
- 34.Holstein SA, Wohlford-Lenane CL, Hohl RJ. Consequences of mevalonate depletion. Differential transcriptional, translational, and post-translational up-regulation of Ras, Rap1a, RhoA, AND RhoB. J Biol Chem. 2002;277(12):10678–82. doi: 10.1074/jbc.M111369200. [DOI] [PubMed] [Google Scholar]
- 35.Corpataux JM, Naik J, Porter KE, London NJ. The effect of six different statins on the proliferation, migration, and invasion of human smooth muscle cells. J Surg Res. 2005;129(1):52–6. doi: 10.1016/j.jss.2005.05.016. [DOI] [PubMed] [Google Scholar]
- 36.Dulak J, Jozkowicz A. Anti-angiogenic and anti-inflammatory effects of statins: relevance to anti-cancer therapy. Curr Cancer Drug Targets. 2005;5(8):579–94. doi: 10.2174/156800905774932824. [DOI] [PMC free article] [PubMed] [Google Scholar]
- 37.Fessler MB, Young SK, Jeyaseelan S, et al. A role for hydroxy-methylglutaryl coenzyme a reductase in pulmonary inflammation and host defense. Am J Respir Crit Care Med. 2005;171(6):606–15. doi: 10.1164/rccm.200406-729OC. [DOI] [PubMed] [Google Scholar]
- 38.El-Hashemite N, Zhang H, Walker V, Hoffmeister KM, Kwiatkowski DJ. Perturbed IFN-gamma-Jak-signal transducers and activators of transcription signaling in tuberous sclerosis mouse models: synergistic effects of rapamycin-IFN-gamma treatment. Cancer Res. 2004;64(10):3436–43. doi: 10.1158/0008-5472.CAN-03-3609. [DOI] [PubMed] [Google Scholar]
- 39.Kwiatkowski DJ, Zhang H, Bandura JL, et al. A mouse model of TSC1 reveals sex-dependent lethality from liver hemangiomas, and up-regulation of p70S6 kinase activity in Tsc1 null cells. Hum Mol Genet. 2002;11(5):525–34. doi: 10.1093/hmg/11.5.525. [DOI] [PubMed] [Google Scholar]
- 40.Lee L, Sudentas P, Donohue B, et al. Efficacy of a rapamycin analog (CCI-779) and IFN-gamma in tuberous sclerosis mouse models. Genes Chromosomes Cancer. 2005;42(3):213–27. doi: 10.1002/gcc.20118. [DOI] [PubMed] [Google Scholar]
- 41.Reinoso RF, Sanchez Navarro A, Garcia MJ, Prous JR. Preclinical pharmacokinetics of statins. Methods Find Exp Clin Pharmacol. 2002;24(9):593–613. [PubMed] [Google Scholar]
- 42.Horiguchi A, Sumitomo M, Asakuma J, Asano T, Asano T, Hayakawa M. 3-hydroxy-3-methylglutaryl-coenzyme a reductase inhibitor, fluvastatin, as a novel agent for prophylaxis of renal cancer metastasis. Clin Cancer Res. 2004;10(24):8648–55. doi: 10.1158/1078-0432.CCR-04-1568. [DOI] [PubMed] [Google Scholar]
- 43.Narisawa T, Fukaura Y, Tanida N, Hasebe M, Ito M, Aizawa R. Chemopreventive efficacy of low dose of pravastatin, an HMG-CoA reductase inhibitor, on 1,2-dimethylhydrazine-induced colon carcinogenesis in ICR mice. Tohoku J Exp Med. 1996;180(2):131–8. doi: 10.1620/tjem.180.131. [DOI] [PubMed] [Google Scholar]
- 44.Alonso DF, Farina HG, Skilton G, Gabri MR, De Lorenzo MS, Gomez DE. Reduction of mouse mammary tumor formation and metastasis by lovastatin, an inhibitor of the mevalonate pathway of cholesterol synthesis. Breast Cancer Res Treat. 1998;50(1):83–93. doi: 10.1023/a:1006058409974. [DOI] [PubMed] [Google Scholar]
- 45.Kusama T, Mukai M, Iwasaki T, et al. 3-hydroxy-3-methylglutaryl-coenzyme a reductase inhibitors reduce human pancreatic cancer cell invasion and metastasis. Gastroenterology. 2002;122(2):308–17. doi: 10.1053/gast.2002.31093. [DOI] [PubMed] [Google Scholar]
- 46.Zheng X, Cui XX, Avila GE, et al. Atorvastatin and celecoxib inhibit prostate PC-3 tumors in immunodeficient mice. Clin Cancer Res. 2007;13(18 Pt 1):5480–7. doi: 10.1158/1078-0432.CCR-07-0242. [DOI] [PubMed] [Google Scholar]
- 47.Karp I, Behlouli H, Lelorier J, Pilote L. Statins and cancer risk. Am J Med. 2008;121(4):302–9. doi: 10.1016/j.amjmed.2007.12.011. [DOI] [PubMed] [Google Scholar]
- 48.Khurana V, Caldito G, Ankem M. Statins might reduce risk of renal cell carcinoma in humans: case-control study of 500,000 veterans. Urology. 2008;71(1):118–22. doi: 10.1016/j.urology.2007.08.039. [DOI] [PubMed] [Google Scholar]
- 49.Kumar AS, Benz CC, Shim V, Minami CA, Moore DH, Esserman LJ. Estrogen Receptor-Negative Breast Cancer Is Less Likely to Arise among Lipophilic Statin Users. Cancer Epidemiol Biomarkers Prev. 2008;17(5):1028–33. doi: 10.1158/1055-9965.EPI-07-0726. [DOI] [PubMed] [Google Scholar]
Associated Data
This section collects any data citations, data availability statements, or supplementary materials included in this article.
Supplementary Materials
Figure 1S. Immunoblots of whole tissue lysates from the lungs and livers of mice treated with atorvastatin for 1 month. Phospho-T421/4-S6 kinase (pS6K), phospho-S235/6-S6 (pS6), total S6, GTP-RhoA and total RhoA levels in vehicle control and atorvastatin treated mice are shown (arrows). Molecular weight markers, positive control (+ ctl) and tissue source are indicated.
Figure 2S. Immunoblots of whole tissue lysates from the lungs and livers of mice treated with atorvastatin for 3 months. Phospho-T421/4-S6 kinase (pS6K), phospho-S235/6-S6 (pS6), total S6, GTP-RhoA and total RhoA levels in vehicle control and atorvastatin treated mice are shown (arrows). Molecular weight markers, positive control (+ ctl) and tissue source are indicated.
Figure 3S. Imunoblots of whole tissue lysates from the lungs of mice treated with atorvastatin for 6 months is shown. Levels of phospho-T421/4-S6 kinase (pS6K), phospho-S235/6-S6 (pS6), total S6, GTP-RhoA and total RhoA were compared in vehicle control and atorvastatin treated mice. Molecular weight markers, positive control (+ ctl) and tissue source are indicated.
Figure 4S. Imunoblots of whole tissue lysates from the livers of mice treated with atorvastatin for 6 months is shown. Immunoblots showing RhoA and Rheb resolved on large gels in control (C) and atorvastatin-treated (A) tissue lysates derived from liver. Positive controls (Pos Ctls) using vehicle (C) atorvastatin-treated (A) cell lysates are shown were used for identification. Molecular weight markers are indicated.


