Abstract
Neurofibromatosis type 1 (NF1) is one of the most common human genetic diseases affecting the nervous system and predisposes individuals to cancer, including peripheral nerve sheath tumors (PNSTs) and astrocytomas. Modifiers in the genetic background affect the severity of the disease and we have previously mapped two modifier loci, Nstr1 and Nstr2, that influence resistance to PNSTs in the Nf1−/+;Trp53−/+cis mouse model of NF1. We report here the analysis of Nstr1 in isolation from other epistatic loci using a chromosome substitution strain, and further show that a modifier locus (or loci) on chromosome 19 influences resistance to both PNSTs and astrocytomas. This modifier locus interacts with sex, resulting in sex specific modification of tumors. Allele variability on chromosome 19 affects both the timing and penetrance of the growth of different tumor types associated with neurofibromatosis type 1, specifically PNSTs and astrocytoma. These results indicate that modifiers of cancer susceptibility interact and affect tumorigenesis under different genetic conditions, and demonstrate the power of chromosome substitution strains to study genetic modifiers.
Keywords: Neurofibromatosis, peripheral nerve sheath tumor, astrocytoma, p53, chromosome substitution strains, modifiers
Neurofibromatosis type 1 (NF1) is a common human genetic disease affecting 1 in 3500 people (FRIEDMAN et al. 1999). NF1 is autosomal dominant and completely penetrant, caused by mutations in the NF1 gene (Nf1 in the mouse). It is characterized by several benign lesions, including neurofibromas, café au lait patches, and pilocytic astrocytomas of the optic pathway. Patients with NF1 are at an increased risk for developing several malignant cancers, including malignant peripheral nerve sheath tumors (MPNSTs), anaplastic astrocytomas, and glioblastomas. In the case of MPNSTs, malignant transformation from a benign neurofibroma to an MPNST has been shown to involve loss or mutation of p53, encoded by the Tp53 gene in humans (Trp53 in the mouse) (MENON et al. 1990).
One of the clinical challenges of NF1 is its variable expressivity. Even within families, where the mutation in NF1 is the same, the disease can be highly variable. This causes difficulty for patients and clinicians in that once the disease is diagnosed it is still unclear whether the individual will go on to be severely or mildly affected. While variable expressivity can be caused by many factors, including different mutations in NF1, polymorphisms in the genetic background, or environmental factors, a study comparing monozygotic twins to more genetically discordant siblings has demonstrated a role for modifier genes in the genetic background affecting the severity of the disease (EASTON et al. 1993). If these modifier genes can be identified and better understood, the management of the disease could be greatly improved.
Because of the established role of genetic modifiers in the severity of NF1 and the wide variety of organs affected by this disease, NF1 is an excellent system to begin to understand how genetic background affects cancer susceptibility and the development of different disease manifestations. A mouse model of the malignancies associated with NF1 has been developed by crossing the Nf1 mutation and Trp53 mutation together onto the same chromosome in the mouse (CICHOWSKI et al. 1999; REILLY et al. 2000; VOGEL et al. 1999). Because the Nf1 and Trp53 genes are tightly linked on mouse chromosome 11, separated by 10 Mb, mutations in these two genes on the same chromosome (Nf1−/+;Trp53−/+cis, abbreviated NPcis) act as a single mutation in genetic crosses, giving near 50% Mendelian inheritance in crosses of NPcis and wild-type mice. These NPcis mice on the inbred C57BL/6J (B6) strain background are a powerful system for mapping modifiers of cancer susceptibility and dissecting out the effects of different strain backgrounds.
While NPcis mice on the B6 inbred background are highly susceptible to mouse peripheral nerve sheath tumors (PNSTs), F1 hybrids between the B6 and A/J (A) strains are resistant to PNSTs (REILLY et al. 2006). We have used these mice to identify two modifier loci for resistance to PNSTs, named Nstr1 and Nstr2 for nerve sheath tumor resistance QTL 1 and 2, by backcross mapping in crosses between the B6 and A strains. Nstr1 was mapped to proximal chromosome 19 (5.3 Mb), and only showed linkage to PNST resistance in progeny of mutant fathers crossed to wild-type mothers. Nstr2 was mapped to chromosome 15 (31.8 Mb) and only showed linkage to PNST resistance in progeny of mutant mothers crossed to wild-type fathers. These data demonstrated that modifiers act within the context of other genetic and epigenetic factors. In addition to the genetic and epigenetic effects on PNSTs we also found effects on astrocytoma tumorigenesis in crosses between the B6 and 129S4/SvJae strains (REILLY et al. 2004). These data further demonstrated that modifiers act in tissue specific ways. Despite this evidence for tissue-specific action of modifier loci, the mechanism of how modifiers act in different contexts remains unknown.
In addition to the effects of Nstr1 and Nstr2 polymorphic loci on PNST susceptibility, we have found that inheritance of the NPcis mutations from the mother or the father has a strong independent effect on PNST incidence (REILLY et al. 2006). On a homozygous B6 strain background, mice that inherit the NPcis mutations from the father have an increased risk for PNSTs compared to mice that inherit the mutations from their mother. In contrast, mice that inherit the NPcis mutations from their mother have an increased risk for astrocytoma. Because these mice are inbred, most imprinted genes in the genome should not be a source of variation with the exception of those on chromosome 11. Because the tumors in NPcis mice initiate through loss of the wild-type copies of Nf1 and Trp53 there is a potential for variation in phenotype depending on whether the linked chromosomal regions being lost are maternal or paternal. The finding that Nstr1 is linked to PNST resistance only in progeny of NPcis mutant fathers suggests that gene interactions between chromosome 11 and chromosome 19, or between chromosome 11 and chromosome 15 in the case of Nstr2, control resistance to PNSTs.
Chromosome substitution strains are a recently developed tool for dissecting complex traits (NADEAU et al. 2000). Each strain is inbred across 20 of the 21 mouse chromosomes with a single chromosome coming from a different strain background. Mouse strains have been generated in which single A chromosomes are introduced onto a B6 background. This allows one to study the effect of a mapped modifier in the absence of epistatic interactions with modifiers on other chromosomes, and to begin to understand how the modifier functions. This information can be used to help differentiate between potential candidate modifier genes in the mapped region.
To independently confirm the location of Nstr1, we have used chromosome substitution strains to look at the effect of A polymorphisms on chromosome 19 in isolation from A polymorphisms on other chromosomes. This allows us to compare the effect of the Nstr1 modifier in a simpler genetic background than the backcross population where epistatic interactions play a larger role. We have expanded the analysis of Nstr1 to another tumor associated with NF1 to determine the tissue specificity of these modifier loci and to better understand the mechanism by which they cause tumor resistance.
MATERIALS AND METHODS
Mouse crosses
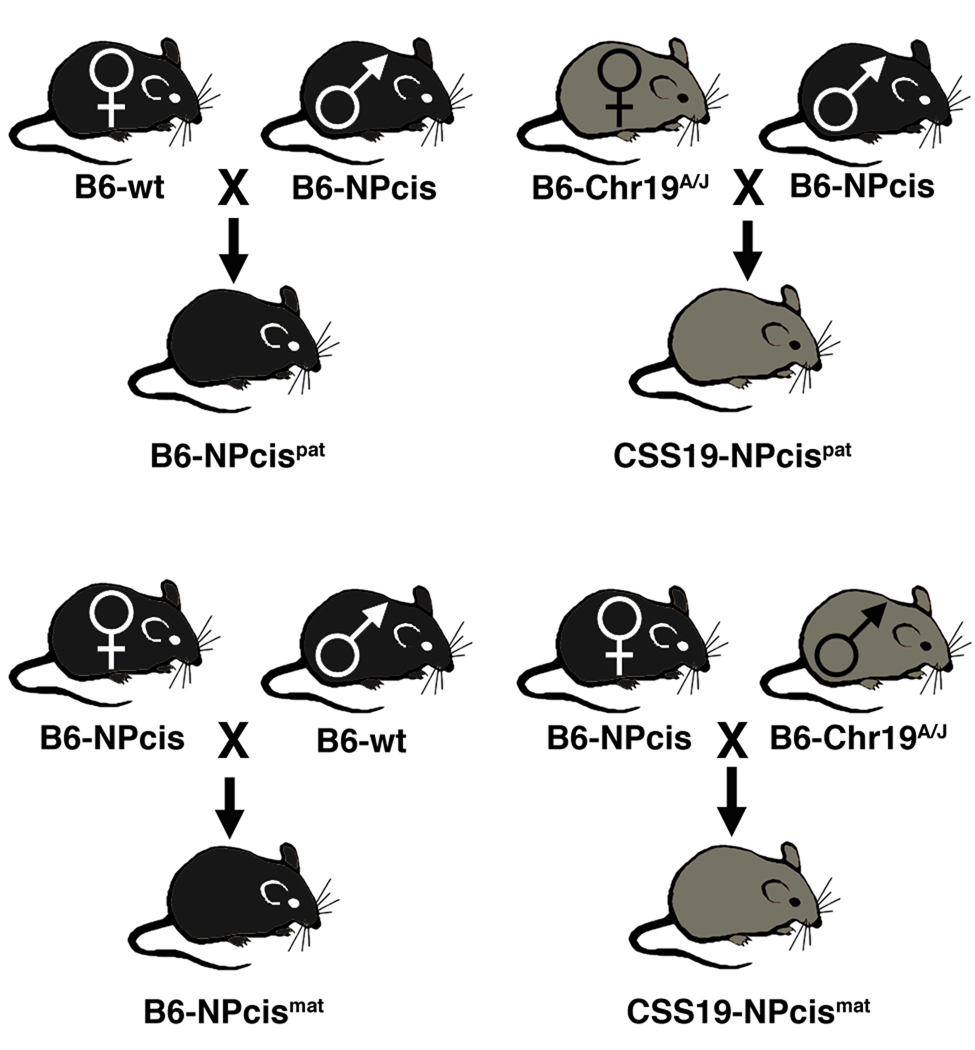
The chromosome substitution strain C57BL/6J-Chr 19A/J/NaJ (B6-Chr 19A) was purchased from The Jackson Laboratory and crossed to B6-NPcis mice (backcross generation 24–29 on B6) from our colony at NCI-Frederick according to the guidelines and regulations of the Institutional Animal Care and Use Committee. B6-Chr 19A females were crossed to B6-NPcis males to generate NPcis paternal crosses (FIGURE 1). In addition, we crossed B6-NPcis females to B6-Chr 19A males to generate smaller cohorts to test the specificity of Nstr1 to paternal crosses (FIGURE 1).
FIGURE 1.
Experimental design of crosses. Mice on the inbred B6 strain that inherit the NPcis mutations from their father (B6-NPcispat) are compared to mice that are F1 hybrids between B6-Chr19A/J females and B6-NPcis males (CSS19-NPcispat) (top panel). Mice on the inbred B6 strain that inherit the NPcis mutations from their mother (B6-NPcismat) are compared to mice that are F1 hybrids between B6-NPcis females and B6-Chr 19A/J males (CSS19-NPcismat) (bottom panel).
Genotyping of mice
Mouse progeny were tail clipped at weaning and genotyped by PCR for presence of the Nf1 and Trp53 mutation as described previously (REILLY et al. 2004).
Phenotyping of mice
Mice were aged up to 15 months until tumors developed as described previously (REILLY et al. 2000). Specifically, mice were observed at least three times per week for signs of tumors, including masses, neurological symptoms, or poor body condition. Mice that showed signs of tumors were monitored daily until a predefined endpoint was reached that included masses growing to 2 cm in diameter, or showing signs of necrosis or hemorrhage. Mice were monitored identically for all experimental groups without regard for genotype or strain background. Once the mice were observed to have tumors by the predefined endpoint criteria, they were euthanized by CO2 asphyxiation and dissected. Tumors were measured using calipers. Tumor size was approximated as an ellipsoid with the calculation of height X width X length X 0.5, and given in mm3. Samples of all organs and macroscopically visible tumors were sectioned and stained with hematoxylin and eosin. Slides were scored for the presence of tumors according to previously established guidelines for this model (REILLY et al. 2006; REILLY et al. 2000; REILLY et al. 2004) by K.M.R, blinded to the genotype of the animal. The tumor scores of all animals in this study are given in SUPPLEMENTAL TABLE 1. Tumor penetrance is defined as the percentage of mice in the cohort that are affected by at least one of tumor type (e.g. PNST).
Statistical methods
Univariate and multivariate logistic regression analysis, Cox proportional hazards modeling, Kaplan-Meier log rank analysis, parametric and nonparametric methods were used in analyses of these data. Animals in this study were euthanized by the predefined endpoint criteria described above. The ‘time of death’ or ‘survival time’ of the animal, was the age of the animal at the time it was euthanized. Following euthanasia, upon examination at necropsy, the presence of a tumor of was defined as an event and the absence of a tumor was considered as a censored observation in the Kaplan-Meier survival curves for different cohorts (e.g. PNST-bearing or astrocytoma-bearing mice) displayed in FIGURE 2–FIGURE 4. Differences in survival between cohorts were determined with the log rank test. Survival curves include animals for which histology was not available (indicated in SUPPLEMENTAL TABLE 1). Sample numbers were as follows: CSS19-NPcis pat N=52, B6-NPcis pat N=90, CSS19-NPcis mat N=18, B6-NPcis mat N=86. Tumor penetrance in the different cohorts was compared using a likelihood ratio chi square test. Average tumor sizes for different cohorts were compared using a one-tailed (nonparametric) Wilcoxon’s rank sum test (FIGURE 5). All other tests were two-tailed. In these analyses, probability values of P ≤ 0.05 were considered significant and P ≤ 0.10 were considered suggestive.
FIGURE 2.
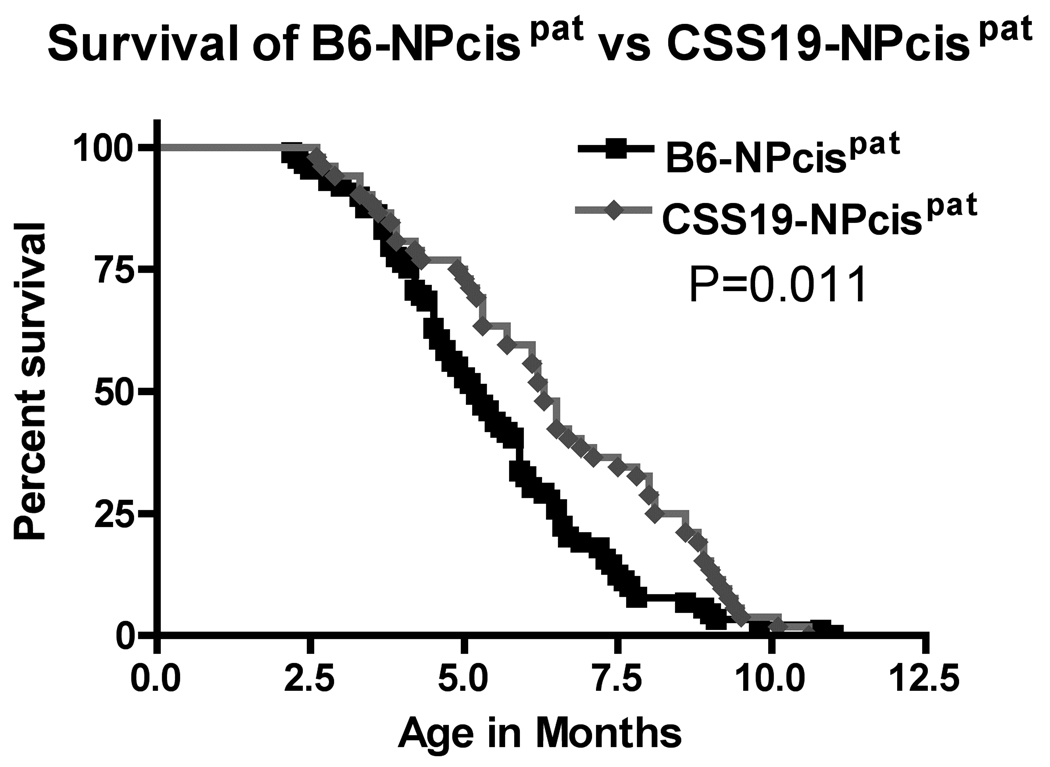
Overall Kaplan-Meier survival curves for CSS19-NPcis pat and B6-NPcis pat progeny. The age at which mice were euthanized due to tumors or poor health (as described in Materials and Methods) is plotted as percent survival. The Kaplan-Meier curve compares the paternal NPcis progeny of the CSS19 strain (grey diamond) to B6 strain (black square). The P value for the logrank test comparing the two curves is shown.
FIGURE 4.
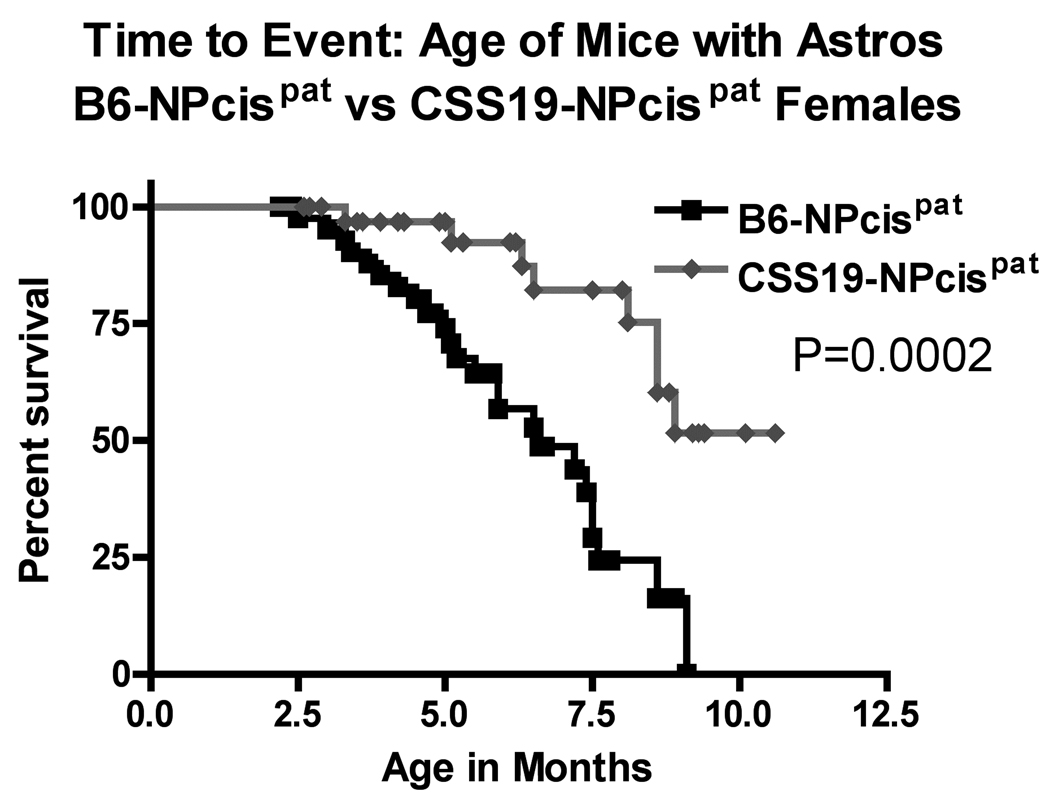
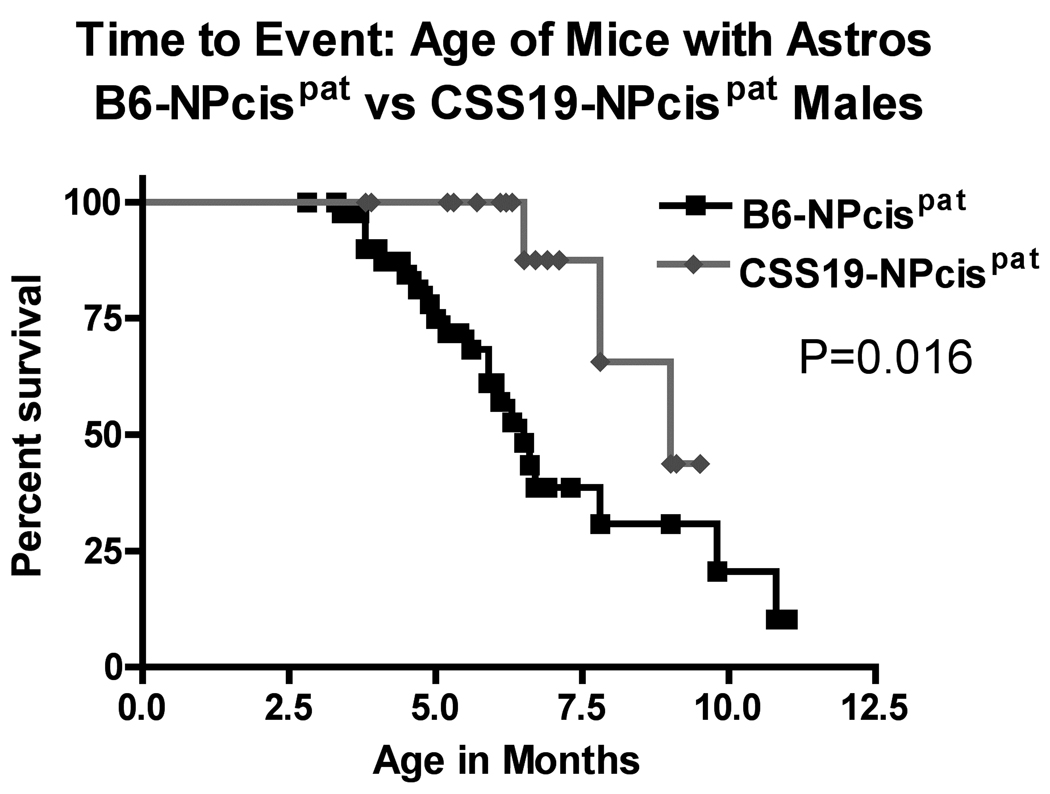
Kaplan-Meier survival curves of the age at death of CSS19-NPcis pat and B6-NPcis pat progeny with astrocytomas. The age at which affected mice were euthanized is plotted as percent survival. The top panel compares the female CSS19-NPcis pat progeny (grey diamond) to B6-NPcis pat progeny (black square), while the bottom panel shows the results for the male progeny. P values (log rank test) for each sex, are displayed, respectively, in each panel.
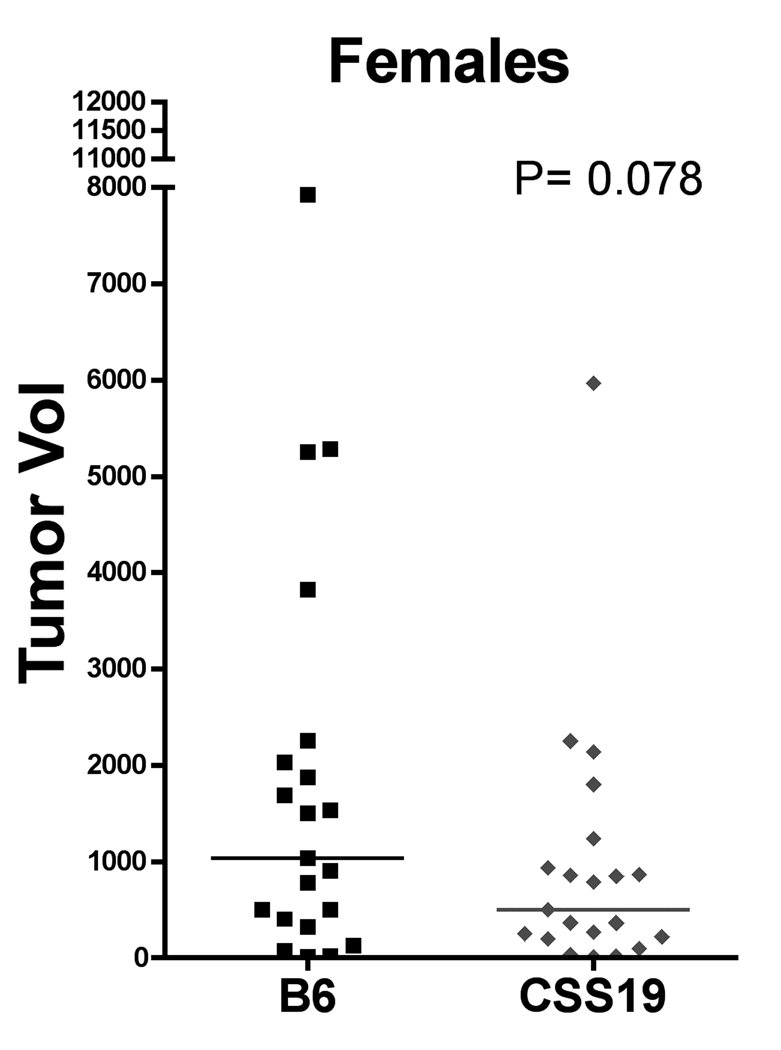
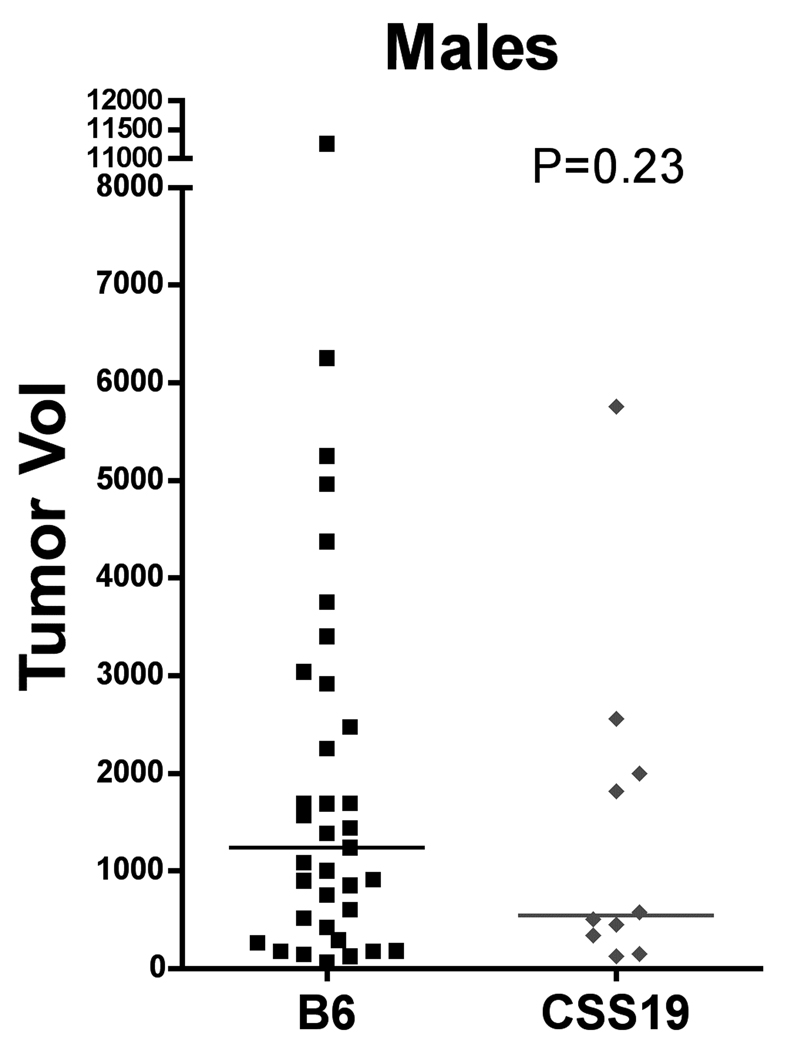
FIGURE 5.
Size of PNSTs in CSS19-NPcis pat and B6-NPcis pat progeny. Tumors were measured after mice were euthanized (as described in Materials and Methods). Tumor size was approximated as an ellipsoid. Within each cohort, each tumor is plotted individually, with the calculated mean size indicated by a line. The left panel compares the tumor volume in CSS19-NPcis pat (CSS19; grey diamond) females to B6-NPcis pat (B6; black square) females. The right panel shows tumor size for males. The P value for the Wilcoxon rank sum test is shown for each graph.
RESULTS
To confirm the location of Nstr1 on chromosome 19 we took advantage of a chromosome substitution strain to isolate the A/J genotype on chromosome 19. Because the original identification of Nstr1 found linkage only in progeny of NPcis fathers (REILLY et al. 2006), we crossed C57BL/6J-Chr 19A/J/NaJ (B6-Chr19A) females to C57BL/6J-NPcis (B6-NPcis) males to generate B6-Chr19AXB6-NPcis (CSS19-NPcis pat) progeny (FIGURE 1), such that all chromosomes are inbred B6, except for chromosome 19, which is heterozygous for B6 and A. B6-NPcis pat progeny (FIGURE 1) were used as controls. The CSS19-NPcis pat progeny (N=52) showed a significant delay (P=0.011) in tumor development (average age = 6.1 mo) compared to B6-NPcis pat progeny (N=90; average age = 5.2 mo) (FIGURE 2). These mice developed many of the tumor types observed previously in the NPcis mouse model: primarily astrocytoma, PNST, lymphoma, histiocytic sarcoma, and pheochromocytoma, with occasional osteosarcoma, mammary carcinoma, pituitary tumor, hemangiosarcoma, ethesioneuroblastoma, and leiomyosarcoma observed. SUPPLEMENTAL TABLE 1 lists the number of tumors found in each mouse. The delay in the survival curve of CSS19-NPcis pat mice supports the presence of a tumor modifier on chromosome 19.
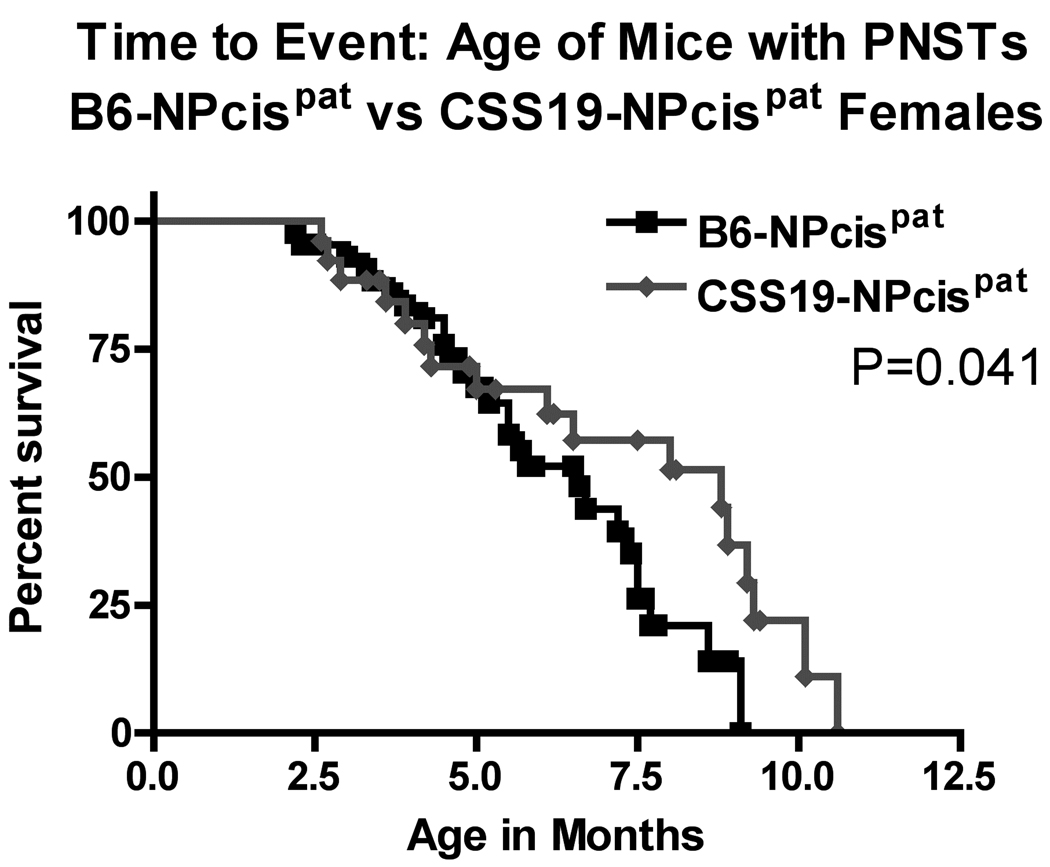
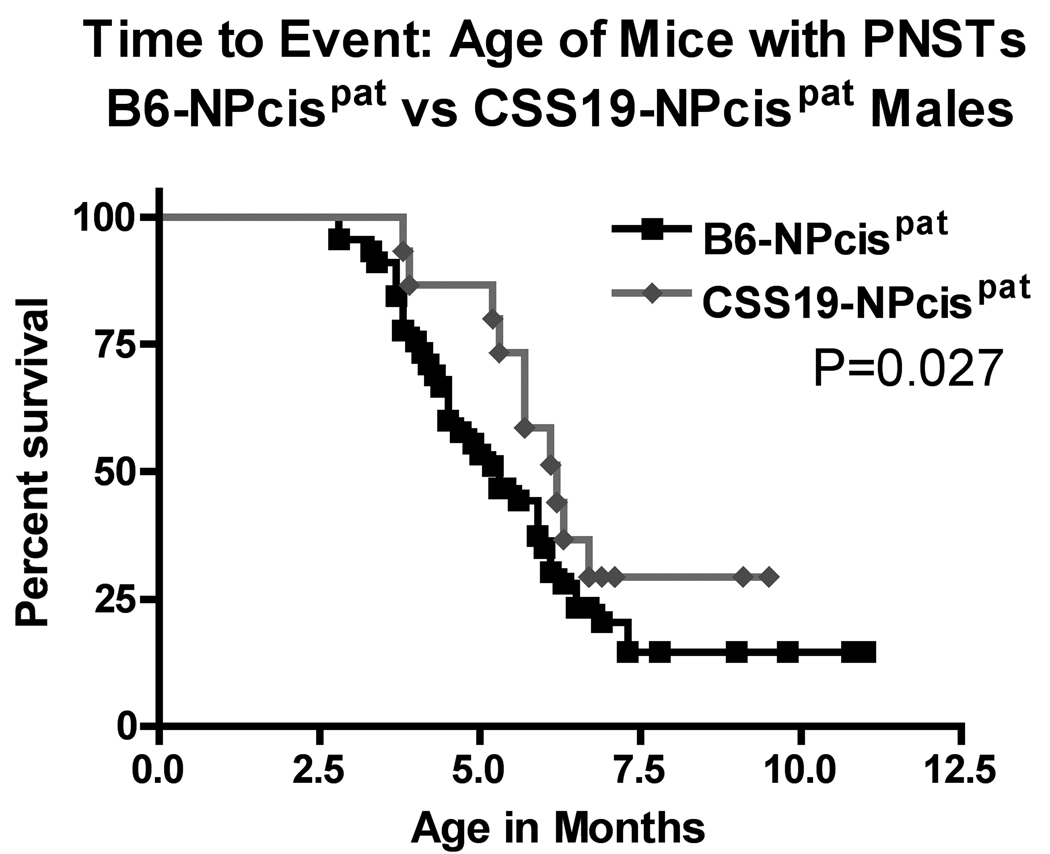
We examined two different nervous system tumors individually to determine whether the modifying effect of chromosome 19 was limited to PNSTs or extended to another common NF1-associated tumor, astrocytoma. For each tumor type, we investigated the effect of CSS19 on both the penetrance and the age at death when the specific tumor type was present (indicated as time to event). Initial analysis indicated that the penetrance of PNSTs in CSS19-NPcis pat mice (62%) was not significantly lower than in B6-NPcis pat mice (71%) (TABLE 1). However, when split into males and females, a significant CSS19 effect was seen in males. Though PNST penetrance in females is similar (65% in CSS19-NPcis pat, 60% in B6-NPcis pat progeny), penetrance was significantly reduced (P=0.033) in CSS19-NPcis pat males (56%) compared to B6-NPcis pat males (82%). Interestingly, though penetrance effects are sex specific, indicative of a sex-gene interaction (P Sex*GT=0.050, TABLE 1), both males and females with PNSTs on the CSS19 background show a significant delay in survival time compared to PNST-bearing mice on a B6 background (TABLE 1, FIGURE 3). PNST-bearing CSS19-NPcispat males die significantly later (P=0.027) (average age=5.5 mo) compared to PNST-bearing B6-NPcispat males (average age=4.9 mo) and PNST-bearing CSS19-NPcispat females significantly die later (P=0.041) (average age=6.4 mo) than PNST-bearing B6-NPcispat females (average age=5.4 mo). In contrast, astrocytoma penetrance is significantly decreased (P=0.0003) in all CSS19-NPcis pat progeny (21%) relative to B6-NPcis pat progeny (51%) (TABLE 2). This CSS-19 effect on penetrance of astrocytoma shows no sex-specific interaction (P Sex*GT=0.93), and is seen in both males and females. CSS19 also significantly delays the time of death in both males (P=0.016) and females (P=0.0002) with astrocytoma (TABLE 2, FIGURE 4). Astrocytoma-bearing CSS19-NPcispat males die later (average age=7.8 mo) compared to astrocytoma-bearing B6-NPcispat males (average age=5.8 mo) and astrocytoma-bearing CSS19-NPcispat females die later (average age=6.9 mo) than astrocytoma-bearing B6-NPcispat females (average age=5.6 mo). To better understand the delay in death in PNST-bearing males and females, we examined the PNST size at time of death, as described in the Materials and Methods section. Although CSS19-NPcis pat females and B6-NPcis pat females develop similar numbers of PNSTs (TABLE 1), the tumor size data suggests that the average size of PNSTs in CSS19-NPcis pat females (953 mm3) is smaller (P=0.78) than those in B6-NPcis pat females (1800 mm3) (TABLE 3, FIGURE 5). Although CSS19 PNSTs tend to be smaller in all crosses, this effect is most pronounced in the CSS19-NPcis pat females.
TABLE 1.
PNST INCIDENCE AND AVERAGE AGE AT DEATH WITH PNST
| Pat Crosses | N | % PNST | Pa | Age (mo) | Pb | P Sex*GTc |
|---|---|---|---|---|---|---|
| B6-NPcispat, all | 90 | 71% | 0.24 | 5.2 ± 1.6 | 0.011 | 0.050 |
| CSS19-NPcispat, all | 52 | 62% | 6.1 ± 2.2 | |||
| B6-NPcispat, females | 45 | 60% | 0.67 | 5.4 ± 1.9 | 0.041 | |
| CSS19-NPcispat, females | 34 | 65% | 6.4 ± 2.6 | |||
| B6-NPcispat, males | 45 | 82% | 0.033 | 4.9 ± 1.2 | 0.027 | |
| CSS19-NPcispat, males | 18 | 56% | 5.5 ± 1.0 | |||
| Mat Crosses | ||||||
| B6-NPcismat, all | 86 | 41% | 0.89 | 6.9 ± 2.0 | 0.21 | 0.74 |
| CSS19-NPcismat, all | 18 | 39% | 7.8 ± 1.7 | |||
| B6-NPcismat, females | 38 | 34% | 0.80 | 6.9 ± 1.6 | 0.46 | |
| CSS19-NPcismat, females | 10 | 30% | 8.0 ± 1.0 | |||
| B6-NPcismat, males | 48 | 46% | 0.83 | 7.0 ± 2.3 | 0.41 | |
| CSS19-NPcismat, males | 8 | 50% | 7.7 ± 2.3 | |||
Likelihood Ratio Chi square test for significance
Log rank test for significance
Logistic regression test for significance of interaction between sex and genotype
FIGURE 3.
Kaplan-Meier survival curves of the age at death of CSS19-NPcis pat and B6-NPcis pat progeny presenting with PNSTs. The age at which affected mice were euthanized is plotted as percent survival. The top panel compares only the female CSS19-NPcis pat progeny (grey diamond) to B6-NPcis pat progeny (black square), while the bottom panel shows the results for the male progeny. P values (log rank test) for each sex, are displayed, respectively, in each panel.
TABLE 2.
ASTROCYTOMA INCIDENCE AND AVERAGE AGE AT DEATH WITH ASTROCYTOMA
| Pat Crosses | N | % Astro | Pa | Age (mo) | Pb | P Sex*GTPc |
|---|---|---|---|---|---|---|
| B6-NPcispat, all | 90 | 51% | 0.0003 | 5.7 ± 1.9 | <0.0001 | 0.93 |
| CSS19-NPcispat, all | 52 | 21% | 7.2 ± 1.8 | |||
| B6-NPcispat, females | 45 | 56% | 0.0037 | 5.6 ± 1.8 | 0.0002 | |
| CSS19-NPcispat, females | 34 | 31% | 6.9 ± 2.0 | |||
| B6-NPcispat, males | 45 | 47% | 0.021 | 5.8 ± 1.9 | 0.016 | |
| CSS19-NPcispat, males | 18 | 17% | 7.8 ± 1.3 | |||
| Mat Crosses | ||||||
| B6-NPcismat, all | 86 | 62% | 0.0019 | 7.3 ± 2.0 | 0.0009 | 0.0040 |
| CSS19-NPcismat, all | 18 | 22% | 8.9 ± 0.8 | |||
| B6-NPcismat, females | 38 | 50% | 0.57 | 7.5 ± 1.9 | 0.21 | |
| CSS19-NPcismat, females | 10 | 40% | 8.9 ± 0.8 | |||
| B6-NPcismat, males | 48 | 71% | <0.0001 | 7.2 ± 2.1 | 0.0018 | |
| CSS19-NPcismat, males | 8 | 0% | NA | |||
Likelihood Ratio Chi square test for significance
Log rank test for significance
Logistic regression test for significance of interaction between sex and genotype
TABLE 3.
TUMOR SIZE
| Pat Crosses | N | Size (mm3) | Pa |
|---|---|---|---|
| B6-NPcispat, females | 21 | 1800 ± 458 | 0.078 |
| CSS19-NPcispat, females | 21 | 953 ± 290 | |
| B6-NPcispat, males | 35 | 1972 ± 387 | 0.23 |
| CSS19-NPcispat, males | 10 | 1427 ± 554 | |
| Mat Crosses | |||
| B6-NPcismat, females | 13 | 1542 ± 810 | 0.50 |
| CSS19-NPcismat, females | 3 | 611 ± 158 | |
| B6-NPcismat, males | 20 | 853 ± 333 | 0.29 |
| CSS19-NPcismat, males | 4 | 372 ± 183 | |
One-tailed (non-parametric) WIlcoxon’s rank sum test
We wanted to determine whether the modifying effect of chromosome 19 is truly specific for paternal crosses, as (B6XA/J)XB6 backcross data suggests for Nstr1 (REILLY et al. 2006). We therefore generated CSS19-NPcis mat progeny by crossing B6-NPcis females to B6-Chr19A males and used B6-NPcis mat mice as controls (FIGURE 1). The data suggest that CSS19 does not have any effect on modifying PNST tumorigenesis in maternal crosses, as CSS19-NPcis mat mice and B6-NPcis mat mice show no significant difference in penetrance or age of PNST (TABLE 1). In contrast, astrocytoma penetrance is both significantly reduced (P=0.0019) and delayed (P=0.0009) in all CSS19-NPcis mat progeny (22%; average age=8.9 mo) compared to B6-NPcis mat mice (62%; average age=7.3 mo) (TABLE 2). When analyzed for an interaction of sex and whether the animal is CSS19 or B6, the data support statistically significant interaction model (P Sex*GT=0.0040), indicating an interaction between sex and the modifier on CSS19, as seen in the NPcis pat PNST data above. CSS19-NPcis mat males show significant decrease (P<0.0001) in penetrance (0%) relative to B6-NPcis mat (71%), with none of the CSS19-NPcis mat males developing astrocytomas. In contrast, the females show no significant difference in penetrance of astrocytoma.
We have shown previously that progeny of NPcis mothers show increased penetrance of astrocytoma (REILLY et al. 2004) and progeny of NPcis fathers show increased penetrance of PNSTs (REILLY et al. 2006). Because this effect is seen regardless of strain background, it is likely due to inheritance of an imprinted gene on chromosome 11 that is lost or amplified during tumorigenesis. (REILLY 2004). We examined the reciprocal crosses in the context of the chromosome substitution strain to determine how these epigenetic effects interact with a specific subset of polymorphisms between B6 and A. We found within the CSS19 background that progeny of NPcis fathers (CSS19-NPcispat) show increased penetrance of PNSTs (62%) with tumors being observed at younger ages (average age = 6.1 mo) compared to progeny of NPcis mothers (CSS19-NPcismat) (39%; average age = 7.8 mo) (TABLE 1), suggesting a strong effect of chromosome 11 inheritance on PNST tumorigenesis, consistent with what is observed in B6-NPcis mice. In contrast, the effects on astrocytoma development may be more complex. CSS19-NPcis pat and CSS19-NPcis mat progeny show no clear difference in astrocytoma penetrance, but age of death in mice with astrocytoma is delayed in NPcis mat progeny compared to NPcis pat progeny in all crosses in this study (e.g. CSS19-NPcismat progeny develop astrocytoma at 8.9 months on average, whereas CSS19-NPcispat progeny develop astrocytoma at 7.2 months on average) (TABLE 2). In summary, the effect of imprinting on chromosome 11 (REILLY et al. 2006; REILLY et al. 2004) and the inheritance of the mutant NPcis chromosome from the mother or the father affect PNST tumorigenesis most consistently.
DISCUSSION
We show here using chromosome substitution strains that chromosome 19A can independently modify PNST tumorigenesis. These data are consistent with our previous finding that a PNST resistance modifier locus maps to chromosome 19 in (B6XA)XB6 backcrosses. Furthermore, we find that chromosome 19A also shows an ability to modify astrocytoma development. Interestingly, chromosome 19A modifies the two tumor types differently, emphasizing the tissue-specific context in which modifier genes act within a given disease such as NF1.
We have also confirmed our previous finding that progeny of NPcis fathers have increased penetrance of PNSTs regardless of the strain background (REILLY et al. 2006), and furthermore have shown that age at death occurs at younger ages in NPcis pat PNST mice on all backgrounds. Interestingly, we find much more variation in the effect of the parental origin of NPcis on astrocytoma. In CSS19-NPcis mice, there is no difference in astrocytoma penetrance in NPcis pat and NPcis mat mice, but the age at death is still noticeably younger in the NPcis pat progeny.
Our data show the first example of a modifier of NF1 tumorigenesis that shows sex specificity. NF1 is 100% penetrant and the range of phenotypes does not show sex specific differences. Some malignancies associated with NF1 show slight sex variances, though these differences are also seen in patients without NF1. For example, both NF1-dependent and independent leukemia show higher incidence in boys (U.S. CANCER STATISTICS WORKING GROUP 2007), suggesting that NF1 does not necessarily have an effect on the sex specificity of the disease. Additionally, though not looked at specifically in NF1 patients, the risk of anaplastic astrocytomas and glioblastomas is significantly increased in males (CBTRUS), and males with PNST show a slight trend towards worse prognosis. (Evans, et al; Loree, et al). This suggests that sex plays a role in PNST and astrocytoma development in humans, but also implies a genetic cause for sex specificity separate from NF1, thus supporting our finding of modifier genes that interact in a sex specific manner.
Interestingly, though CSS19 affects both tumor penetrance and age at death in our mouse model, only tumor penetrance seems likely to be sex specific. The age at which mice with specific tumors die is delayed in all sets of CSS19 progeny, though it is only a trend in the maternal progeny with astrocytoma. Although both male and female CSS19-NPcispat progeny show decreased astrocytoma penetrance compared to B6-NPcispat, only males display a statistically significant reduced risk of PNSTs in the paternal crosses.
PNST penetrance is increased in B6-NPcispat males (82%) relative to females (60%) (TABLE 1), but similar between CSS19-NPcispat males (56%) and females (65%). This suggests that the B6 allele on chromosome 19 interacts in a sex specific way to increase PNST penetrance in males, whereas the A allele has no such effect, resulting in similar low PNST penetrance levels in CSS19 males and females. In contrast, males and females show similar astrocytoma penetrance in NPcispat progeny, regardless of B6 or CSS19 background (TABLE 2), indicating that neither the B6 nor A allele on CSS19 interacts in a sex specific way and confirming the tissue specific mode of action of the modifying locus on chromosome 19. In the maternal crosses, sex differences are seen between males and females in both astrocytoma penetrance and age of death. Females show no significant tumor susceptibility differences between CSS19 (40%) and B6 strains (50%), though there may be a trend towards increased age of death in the CSS19 crosses (8.9 mo) compared to B6 crosses (7.5 mo). In contrast, none of the CSS19-NPcismat males in our study developed astrocytoma, leading to a significant decrease in tumor penetrance (P<0.0001), as well as a delay of death (P=0.0018).
It is interesting to note that there are fewer CSS19-NPcispat males than expected, representing only 16.8% of progeny from the cross of B6-Chr 19A females and B6-NPcis males, compared to CSS19-NPcispat females (25.6%), CSS19-wt males (30.4%), and CSS19-wt females (27.2%). Although this deviation from Mendelian ratios is not statistically significant (P=0.15), it raises the possibility that Chr 19A interacts with the NPcis mutation in males at the level of survival of pups to weaning that is not observed in females. We examined whether any similar effect was seen in (B6XA)XB6-NPcispat backcross progeny at the Nstr1 locus. If we compare NPcis males and females that are either heterozygous (B6/A) at Nstr1 or homozygous (B6/B6), we similarly see a reduction in Nstr1B6/A NPcispat males (16.9%) compared to Nstr1B6/A NPcispat females (27.3%), Nstr1B6/B6NPcispat males (25.3%), or Nstr1B6/B6 NPcispat females. As with the CSS19 data, these differences in the backcross data are not statistically significant, but suggest that further studies are warranted to determine whether the A/J allele of Nstr1 interacts specifically with mutation in Nf1 or Trp53 to modify viability of males, and whether this change in viability is through similar molecular mechanisms to the change in tumor susceptibility.
Our data using chromosome substitution strains presents a discrepancy with our previous data in backcross progeny. The modifier locus, Nstr1, was identified by its ability to reduce PNST penetrance, but CSS19 does not modify PNST penetrance of all progeny, though it does modify PNST penetrance in males as discussed above. Importantly, when analyzed by sex the Nstr1 locus modifies penetrance in females, as well as males, in the (B6XAJ)XB6 backcrosses (data not shown). The disparity in PNST penetrance suggests that additional A alleles in the backcross progeny alter the effect of the modifier locus on chromosome 19. We have previously identified the Nstr2 locus, and are currently identifying other modifying loci that may act additively or synergistically to alter the specific modifying effect of Nstr1 alone. Alternatively, multiple A alleles on chromosome19A may cooperate in CSS19 mice to give the results we observe, whereas these alleles may become unlinked in backcross progeny.
An additional example of epistatic interaction is our finding that CSS19 modifies astrocytoma development. Previous studies have shown that the A/JXB6 F1 mice do not show increased resistance to astrocytoma relative to the B6 background. This suggests that additional A/J genes may reduce the effect of the resistance modifier on chromosome 19, and it is only by removing these susceptibility genes that the CSS19 effect can be seen. This again emphasizes the importance of tissue specificity of these modifier genes, as these potential susceptibility modifiers do not reduce the affect of chromosome 19A in PNSTs in the AXB6 F1 progeny. Potentially, multiple A alleles on chromosome 19 in the chromosome substitution strain could have modifying effects, as described above. Thus, tissue specific tumor effects could be due to one locus having varying effects, or two loci showing separate tissue specific effects with one modifying PNSTs and the other modifying astrocytoma development.
Our results demonstrate that the modifier locus on chromosome 19 modifies tumor resistance in the NF1 mouse model by multiple, distinct mechanisms. This could be due to an inhibition of tumor initiation, such that it occurs later, or a slowing of tumor growth, such that tumors take longer to reach the size necessary for euthanasia of the mouse. Interestingly, in the CSS19-NPcis mice, it appears that both mechanisms may play a role. The trend towards smaller size of PNSTs is sex specific, indicating that while slow tumor growth may be the mechanism delaying death in females, this does not explain both the reduced penetrance and delayed death seen in males. The sex specific interaction of the CSS19 modifier may, for example, change the kinetics of tumor initiation such that in males, fewer cells undergo initiating events and those that initiate, do so later. However, once initiated, based on tumor size at death, progression appears to be faster in males than that in females. Because chromosome19A causes a general delay of both PNST and astrocytoma, it suggests that change in kinetics may explain the different susceptibility of both types.
Although females have smaller PNSTs in the CSS19 strain compared to the B6 strain, the endpoint criteria, of which size is a factor, are consistent for all mice. Importantly, our data shows that not only are PNSTs smaller in CSS19 females, they are delayed in the time of death, which is somewhat surprising. There are multiple explanations for this. The first is that PNST growth is slower in CSS19 females, delaying the time of death, and then allowing the growth of astrocytomas to a phenotypic point that required sacrifice. Some mice are found to have both PNST and astrocytoma at time of death, and therefore are included in both data subsets. However, the development of both is seen in a relatively small fraction of animals, and the likelihood does not increase in the CSS19 background compared to the B6 strain (SUPPLEMENTAL TABLE 1). In fact, while 36% of B6-NPcis pat females develop both a PNST and an astrocytoma, only 15% of CSS19-NPcis pat females develop both, suggesting that CSS19-NPcis PNSTs are not smaller due to the confounding presence of another tumor. Furthermore, time of death curves for females with astrocytoma were also delayed in the CSS19 mice relative to B6, suggesting that early death due to astrocytoma is not the cause of the smaller PNSTs.
Another possibility is that PNSTs in males may be more rapidly growing, such that they are first noticed when they are already significantly bigger than endpoint criteria and require immediate euthanasia of the mouse. In contrast, the tumors in females may grow more slowly, and so may be noticed prior to a size requiring euthanasia, and therefore females may be euthanized at the minimum endpoint volume. Additionally, the slow growing nature of the tumors in females could cause an increase in noticeable necrosis or hemorrhage, requiring euthanasia of the mouse while tumors are still smaller in size. Importantly, in addition to having smaller tumors (FIGURE 5) females with PNSTs are being sacrificed later than all B6-NPcis pat animals and the CSS19-NPcis pat males, indicating that the size difference is not due to an earlier termination. An additional factor affecting final tumor volume could be the location of the tumor. Those tumors that grow internally could have a larger final volume than those (such as on the ear) that are more easily quantifiable. Alternatively, tumors that grow on the face, inhibiting eating, or in other locations that inhibit basic bodily functions may require euthanasia of the mouse at a smaller overall tumor volume. However, examination of the tumor location shows no noticeable trends between males and females, or CSS19 and B6 (SUPPLEMENTAL TABLE 1), suggesting changes in tumor location do not play a role in overall size differences.
Our lab previously used linkage mapping to identify Nstr1, a PNST modifier on chromosome 19 that is polymorphic between B6 and A. The CSS19 data presented here is consistent with the hypothesis that Nstr1 is a locus on chromosome 19 that modifies PNST resistance and susceptibility. We are currently characterizing candidate modifier genes within the loci of Nstr1. While haplotype information helps to narrow the number of candidates within these regions there are still a substantial number of genes that are polymorphic between B6 and A. Having additional information about how the modifiers function allows us to better test which of the gene candidates modify PNSTs. The advantage of using the chromosome substitution strains to focus on candidate genes is that we do not need to make assumptions about whether modifiers act cell-autonomously in the tumor cells or non-cell autonomously/systemically in the animal. These assumptions are often necessary when using approaches such as gene expression profiles or loss of heterozygosity analysis where the tumor cells are analyzed rather than the organism as a whole. In addition, further genetic mapping of the Nstr1 locus involves the analysis of recombinants within the loci, and the chromosome substitution strains allow us to simplify the recombinant congenic strains that we analyze by focusing the polymorphic recombinations to a single chromosome. This reduces the confounding epistatic interactions with the rest of the genome in the analysis. We are currently backcrossing the CSS19 to B6 to confirm the modifier locus in CSS19 as Nstr1, and to generate recombinants for fine mapping of the locus. Furthermore, these experiments will help us to determine whether the effects we see on PNSTs and astrocytomas presented here are linked to the same locus on chromosome 19, or are separable.
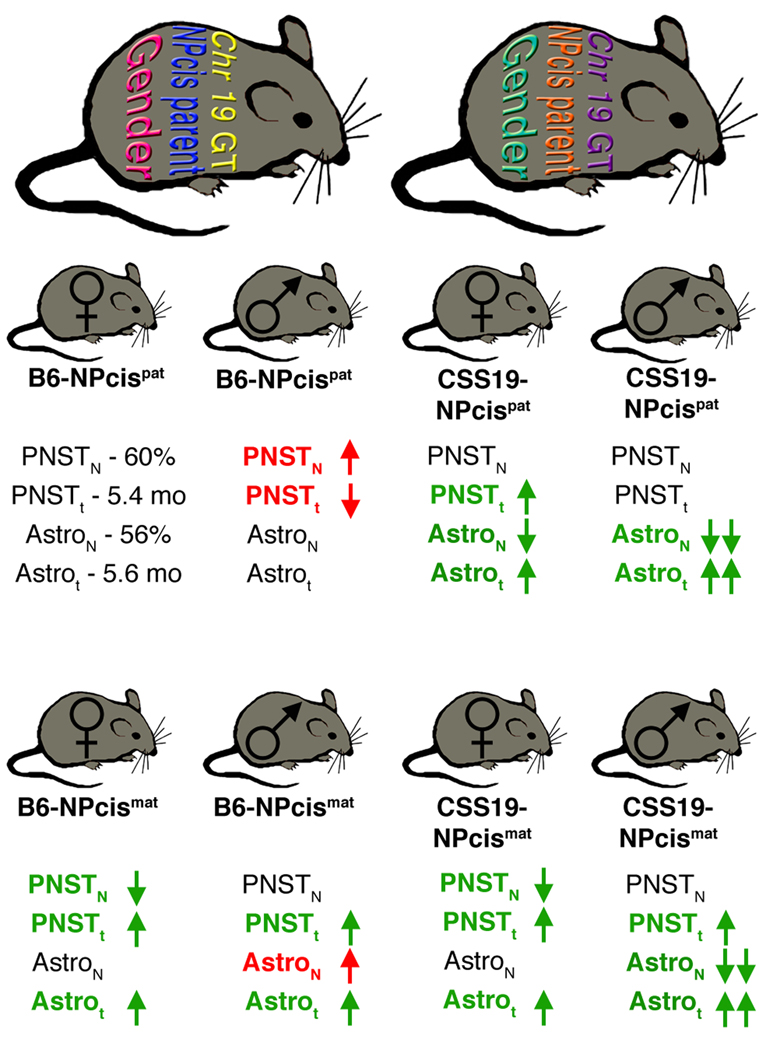
These data presented here emphasize that understanding a single modifier gene is insufficient for prediction of tumor susceptibility in individuals. It is important to understand the network of genes and the context in which these genes function. In this way the individual genetic and epigenetic factors act as bars in a barcode, with different states combining to determine the overall susceptibility of the individual, even though no single trait predicts susceptibility or resistance (FIGURE 6). We show here that PNSTs, already known to be modified by polymorphic loci and affected epistatically by the parental inheritance of chromosome11, are additionally affected by the sex of the mice, indicating an even more complex genetic-epigenetic interaction than previously postulated. In this respect, the study of locus interactions is as important as identification of the genes underlying the modifier loci. It is likely that studies to identify modifier genes in humans will underestimate the genetic component of cancer susceptibility because these complex genetic interactions are difficult to dissect in a highly heterogeneous population such as humans. By using mouse models of human cancer it is possible to hold many genetic variables constant while varying a finite subset, as we have done here using a chromosome substitution strain, to dissect the genetics of susceptibility. Once these networks of genetic interactions are better understood, it will be critical to validate them in human studies using more focused hypothesis testing as opposed to broader screening approaches. By achieving a better understanding of an individual’s risk for developing a tumor such as PNST, more focused prevention and early detection can be used on a subset of patients, rather than applying costly methods to all patients. In this way, identification and understanding of modifiers of tumor susceptibility will improve the treatment of NF1 patients and may improve survival through early detection of tumors.
FIGURE 6.
Model for the interaction of sex, parentage, and genetic background on tumor susceptibility. Different factors contributing to tumor susceptibility can differ in their state like bars in a barcode. For illustrative purposes in panel A, sex can have two states (magenta or cyan), the inheritance of the NPcis chromosome from the mother or father can have two states (blue or orange) and the genotype on chromosome 19 can have multiple different states (shown as yellow or purple). These states combine together to determine the susceptibility of the individual animal to different tumor types (panel B). The susceptibility of mice to PNSTs and astrocytomas is shown in panel B using B6-NPcis pat females as a reference, where mice develop PNST with penetrance (PNSTN) of 60% and an average age (PNSTt) of 5.4 months, and develop astrocytomas with penetrance (AstroN) of 56% and an average age (Astrot) of 5.6 months. Mice varying by sex, NPcis inheritance, and chromosome 19 genotype are depicted as having increased or decreased penetrance and average age of tumors, relative to the B6-NPcis pat females (upper left). Changes associated with an increased susceptibility are indicated in red text, whereas changes associated with increased resistance are indicated in green text. It is clear that tumor penetrance and age are differentially affected by sex, parentage, and chromosome 19 genotype.
Supplementary Material
ACKNOWLEDGEMENTS
We thank R. Tuskan, K. Rogers and staff for technical assistance, and S. Sharan, L. Tessarollo, B. Mock, N. Jenkins, and K. Hunter for helpful discussions on the manuscript. We particularly appreciate the constructive comments from anonymous scientific reviewers that improved the analysis of the presented data. This project has been funded by the Intramural Research Program of the NIH, National Cancer Institute and with federal funds from the National Cancer Institute under contract NO1-CO-12400 to SAIC Frederick. The content of this publication does not necessarily reflect the views or policies of the Department of Health and Human Services, nor does mention of trade names, commercial products, or organizations imply endorsements by the U.S. Government.
REFERENCES
- Cichowski K, Shih T, Schmitt E, Santiago S, Reilly K, McLaughlin M, Bronson R, Jacks T. Mouse models of tumor development in neurofibromatosis type I. Science. 1999;286:2172–2176. doi: 10.1126/science.286.5447.2172. [DOI] [PubMed] [Google Scholar]
- Easton D, Ponder M, Huson S, Ponder B. An analysis of variation in expression of neurofibromatosis (NF) type 1 (NF1): evidence for modifying genes. Am J Hum Genet. 1993;53:305–313. [PMC free article] [PubMed] [Google Scholar]
- Friedman JM, Gutmann DH, MacCollin M, Riccardi VM. Neurofibromatosis: phenotype, natural history, and pathogenesis. 3rd ed. Baltimore: Johns Hopkins University Press; 1999. [Google Scholar]
- Menon A, Anderson K, Riccardi V, Chung R, Whaley J, Yandell D, Farmer G, Freiman R, Lee J, Li F, Barker D, Ledbetter D, Kleider A, Martuza R, Gusella J, Seizinger B. Chromosome 17p deletions and p53 gene mutations associated with the formation of malignant neurofibrosarcomas in von Recklinghausen neurofibromatosis. PNAS. 1990;87:5435–5439. doi: 10.1073/pnas.87.14.5435. [DOI] [PMC free article] [PubMed] [Google Scholar]
- Nadeau JH, Singer JB, Matin A, Lander ES.Analysing complex genetic traits with chromosome substitution strains [published erratum appears in Nat Genet:125]Nat Genet 200024221–225.[published erratum appears in Nat Genet 2000 May;25(1):125] [DOI] [PubMed] [Google Scholar]
- Reilly KM. The importance of genome architecture in cancer susceptibility: location, location, location. Cell Cycle. 2004;3:1378–1382. doi: 10.4161/cc.3.11.1253. [DOI] [PubMed] [Google Scholar]
- Reilly KM, Broman KW, Bronson RT, Tsang S, Loisel DA, Christy ES, Sun Z, Diehl J, Munroe DJ, Tuskan RG. An imprinted locus epistatically influences Nstr1 and Nstr2 to control resistance to nerve sheath tumors in a neurofibromatosis type 1 mouse model. Cancer Res. 2006;66:62–68. doi: 10.1158/0008-5472.CAN-05-1480. [DOI] [PMC free article] [PubMed] [Google Scholar]
- Reilly KM, Loisel DA, Bronson RT, McLaughlin ME, Jacks T. Nf1;Trp53 mutant mice develop glioblastoma with evidence of strain-specific effects. Nat Genet. 2000;26:109–113. doi: 10.1038/79075. [DOI] [PubMed] [Google Scholar]
- Reilly KM, Tuskan RG, Christy E, Loisel DA, Ledger J, Bronson RT, Smith CD, Tsang S, Munroe DJ, Jacks T. Susceptibility to astrocytoma in mice mutant for Nf1 and Trp53 is linked to chromosome 11 and subject to epigenetic effects. Proc Natl Acad Sci U S A. 2004;101:13008–13013. doi: 10.1073/pnas.0401236101. [DOI] [PMC free article] [PubMed] [Google Scholar]
- U.S. Cancer Statistics Working Group U. Atlanta: U.S. Department of Health and Human Services, Centers for Disease Control and Prevention and National Cancer Institute; United States cancer Statistics: 2004 Incidence and Mortality. 2007
- Vogel K, Klesse L, Velasco-Miguel S, Meyers K, Rushing E, Parada L. Mouse tumor model for neurofibromatosis type 1. Science. 1999;286:2176–2179. doi: 10.1126/science.286.5447.2176. [DOI] [PMC free article] [PubMed] [Google Scholar]
Associated Data
This section collects any data citations, data availability statements, or supplementary materials included in this article.


