Abstract
Significant motion artifacts may arise in conventional spectral-domain optical coherence tomography due to sample or probe motion during the exposure time of a CCD array. We show, for the first time to our knowledge, that the motion artifacts can be greatly reduced by short illumination of individual CCD pixels and that this can be accomplished by use of two distinct classes of light sources: broadband pulsed sources and cw wavelength-swept sources. We experimentally demonstrate the benefit of these techniques in terms of the reduction of signal fading due to an axially moving sample and fiber-optic catheter at a high rotational speed.
1. Introduction
Spectral-domain optical coherence tomography (SD-OCT) makes use of low-coherence spectral interferometry to obtain cross-sectional images of a biological sample.1-3 Interference fringes as a function of wavelength are measured using a broadband light source and a spectrometer based on a detector array such as charge-coupled-device (CCD) camera.4,5 The axial reflectivity profile of a sample, or an A-line, is obtained by a discrete Fourier transform of the camera readout data. This imaging technique has recently gone through rapid technical development to demonstrate high quality imaging of biological samples with fast image acquisition time, an order of magnitude faster than state-of-the-art time-domain OCT systems.6-11 The recent advancement in imaging speed may lead to the utilization of SD-OCT in a number of clinical applications in the near future.
SD-OCT systems that have been demonstrated to date utilized either continuous-wave (cw) broad-spectrum light sources, such as super luminescent diodes (SLD) and amplified spontaneous emission (ASE), or ultrashort modelocked pulse lasers with high repetition rates in the range of 10 - 100 MHz. In both cases, the CCD array is illuminated constantly, and therefore the exposure time of the CCD camera determines the signal acquisition time for a single A-line. A recent study12 has shown that sample or probe motion during the A-line acquisition time can result in various undesirable artifacts such as signal fading and spatial resolution degradation. In particular, due to axial sample motion, the visibility of detected spectral fringes can diminish resulting in significant image fading. Considering that cameras appropriate for SD-OCT typically provide exposures times longer than 10 μs, a solution to the fringe washout problem may be required for biomedical applications where sample and probe motion is common.
In this paper, we demonstrate a technique to avoid spurious motion artifacts in SD-OCT. The technique is based on the use of single, relatively short pulse per camera exposure. The short illumination produces snap-shot axial profiles of a sample with greatly reduced motion artifacts. In addition, we extend this pulsed-source technique to a cw wavelength-swept source to gain similar benefits.
2. Principle
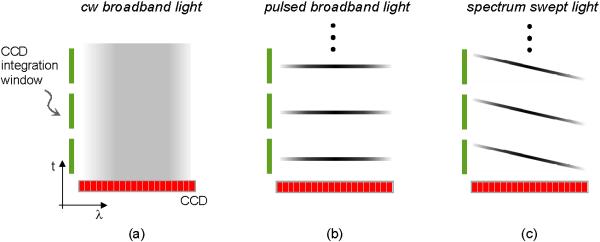
The CCD array in SD-OCT measures the spectral fringes produced as a result of the interference between reference and objective wave. Figure 1 illustrates signal detection in the CCD array for three different light sources: (a) broadband cw, (b) broadband pulsed, and (c) narrowband wavelength-swept. The combined reference and objective wave is spectrally dispersed by a diffraction grating (not shown) and is incident on a CCD array so that each CCD pixel receives a narrowband portion of the optical wave. The vertical bars (green) represent the time window during which the camera integrates photon-generated electrons. The first schematic, Fig. 1(a), corresponds to the common implementation of SD-OCT. The operational principles of the systems corresponding to Figs. 1(b) and (c) are described in the following two sections.
Fig. 1.
Detection of (a) cw, (b) pulsed, and (c) swept light with a CCD array in a spectrometer.
2.1 Pulsed source operation
Figure 1(b) depicts a train of short broadband pulses with a repetition rate equal to the CCD readout rate. The effective signal acquisition time of the system in this case is given by the pulse duration rather than the exposure time of the camera. As a result, snap-shot A-line profiles can be obtained with freedom from sample or probe motion. This technique is conceptually similar to the use of stroboscopic illumination in photography. Although for most biomedical applications sub-microsecond pulses may be sufficiently short to avoid motion artifacts, it is interesting to note that, in principle, this approach could provide sub-picosecond temporal resolution A-line acquisition through the use of low-repetition modelocked lasers. The following analysis, however, pertains to an arbitrary pulsed source delivering either single bursts of short-duration broadband light or bursts comprising a brief train of mode locked pulses.
The fringe washout due to axial motion leads to the loss of signal power by a factor S which can be expresses as 12
| (1) |
where T is the exposure time, P(t) denotes the time-varying optical power of the pulse, νz is the speed of axial motion, and k0 is the center wavenumber of the spectrum. Equation (1) yields S ≈ sin2 (k0Δz)/(k0Δz)2 for a square pulse and S ≈ exp[-k02Δz2/(2 ln 2)] for a Gaussian pulse where τ is a pulse width determined at its half power points (or full-width-at-half-maximum, FWHM) and Δz = νzτ denotes the axial displacement of the sample during the pulse width τ. These expressions indicate that significant signal fading occurs if the sample movement is greater than a half optical wavelength during the pulse duration. Therefore, the short pulsed technique (τ ⪡ T) offers a significant advantage over the conventional cw operation in terms of motion-induced signal fading. Similarly, the pulsed operation also reduces the degradation of spatial resolution due to axial and transverse motion, since the axial and transverse displacements of the sample or probe during the signal acquisition time τ can be significantly reduced with short pulses.
2.2 Swept source operation
Figure 1(c) illustrates an alternative approach based on a narrowband, wavelength-swept source. Since the optical spectrum is continuously changed in time, each of the CCD pixels receives its corresponding spectral component only for a short time interval. As with pulsed broad bandwidth illumination, the signal loss by axial motion can be described with Eq. (1) where τ corresponds to the FWHM of the “spectrum pulse” seen by each CCD pixel. For a narrowband, linearly-swept source, τ would be T/M where M is the number of CCD pixels. Since a typical value of M ranges from 512 to 2048, the swept source operation can provide a significant advantage in terms of signal fading.
An important difference between the pulsed and swept operations [Figs. 2(b) and (c)], however, is that the individual “spectrum pulses” in the swept operation do not arrive at the CCD pixels at the same time. For a quasi-linear sweep of the spectrum, the swept operation is analogous to optical frequency domain imaging (OFDI)13 in which spectral fringes are measured as a function of time using a swept source and a standard photodiode. Therefore, the swept source approach in SD-OCT is expected to exhibit similar motion artifacts as OFDI. The motion artifacts in OFDI, such as Doppler displacement and spatial resolution degradation, have been described in Ref. [12]. The swept-source SD-OCT, however, differs from OFDI in that it does not require a linear tuning slope or narrow instantaneous linewidth of the source because these specifications are governed by the detection spectrometer. This distinction is significant considering that tuning speed and power in wavelength swept lasers are often limited by constraints on linearity and instantaneous linewidth.
Fig. 2.
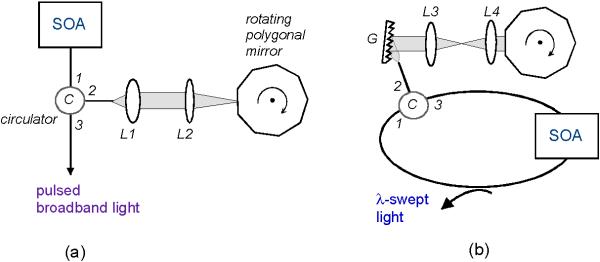
Experimental configurations of (a) the pulsed ASE source and (b) wavelength-swept source.
2.3 Noise in SD-OCT
The fundamental noise in CCD array detection can be quantified in terms of noise electrons - a sum of readout noise, shot noise and intensity noise - accumulated during the electrical integration time, T.5-9 In the following we briefly describe basic properties of individual noise sources and discuss how they are affected by pulsed and swept-source operations. The electrical noise is solely determined by the electrical integration time and the quality of the CCD camera and therefore is independent of the type of light source. The shot noise current is proportional to the square root of the optical power. The total number of shot noise electrons (Nsh) generated in the duration T, summed over the entire CCD pixels, is given as where η is the quantum efficiency, q is the electron charge, and ⟨P⟩ denotes the time-average optical power. Since the shot noise is independent of the temporal and spectral characteristics of light, the pulsed or swept operation in SD-OCT does not alter the shot noise level if the same average optical power is used for the reference wave. On the other hand, the intensity noise current is proportional to the optical power. For the optical power evenly distributed over M CCD pixels, the total number of intensity noise electrons (Nin) can be expressed as where RIN denotes relative intensity noise defined as the ratio of the mean-square optical intensity fluctuation to the square of the time-average optical power detected by a CCD pixel in a 1-Hz bandwidth. Unlike the electrical and shot noise, the intensity noise may vary considerably depending on the light source used since RIN, in general, is a unique characteristic of the source.
It is important to note that because an image in SD-OCT is produced via a Fourier transform of the CCD readout data, only intensity fluctuations uncorrelated between CCD pixels at different wavelengths contribute to the noise in the image. The fluctuation of the total optical power, maintaining the shape of the optical spectrum, affects the image only at a depth corresponding to zero delay in the interferometer and, therefore, may not degrade the image quality. Therefore, the conventional method using a photodetector and electrical spectrum analyzer14 may yield an incorrect estimation of RIN for a particular light source for SD-OCT. Instead, a correct measurement of RIN for SD-OCT necessitates using a CCD-based spectrometer. An important exception is a thermal light source where individual spectral components are completely uncorrelated by the nature of the light generation.14 For a pulsed or swept source following the thermal source statistics, such as an SLD or ASE source, it can be shown that RIN = (2/Δν)χ where Δν is the spectral resolution of the spectrometer and χ = T/τ represents the RIN enhancement factor for a square pulse and χ ≅ 0.66T/τ for a Gaussian pulse. The RIN enhancement factor originates from the fact that the instantaneous peak power of pulsed or swept light detected by individual CCD pixels in the spectrometer is higher than that of cw light at the same average power. For non-thermal sources such as lasers, however, RIN does not scale with the pulse width since it is governed by laser statistics rather than thermal source statistics.
3. Experiment
3.1 Light sources
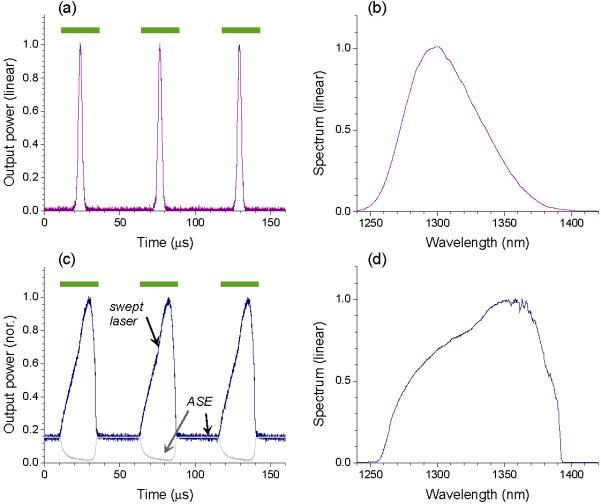
For proof-of-concept experiments, pulsed and wavelength-swept sources were constructed. The pulsed broadband source was realized by external time-gating of cw broadband ASE from a semiconductor optical amplifier (SOA, Philips CQF 882/e). The output of the SOA, prior to time gating, was characterized as cw un-polarized ASE centered 1.3 μm, with 7-mW total output power at an injection current of 450 mA. The cw ASE was coupled to an external optical gating device comprising a polygonal mirror scanner in conjunction with a circulator. A schematic of the gating device is depicted in Fig. 2(a). The polygonal mirror had 40 facets with a facet-to-facet angle of 9 degrees. The focal lengths of the collimating (L1) and focusing (L2) lenses were chosen to be 11 and 100 mm, respectively, to obtain a duty cycle of approximately 5% in the output. Figure 3(a) shows the output pulse train measured with an InGaAs photodetector and oscilloscope (detection bandwidth = 100 MHz), as the polygon scanner was rotated at 474 revolutions per second to produce a pulse repetition rate of 18.94 kHz. The measured pulse width and corresponding duty cycle were 2.85 μs and 5.4%, respectively. The average output power measured with a power meter was 300 μW. Figure 3(b) shows the output spectrum measured with an optical spectrum analyzer. The spectrum was identical to that of the input ASE, with a center wavelength at 1300 nm and a full-width-at-half-maximum (FWHM) of 66 nm.
Fig. 3.
Temporal and spectral output characteristics of the pulsed ASE source, (a) and (b), and the swept source, (c) and (d), respectively. The horizontal bars (green) represent the electrical integration time of the CCD camera.
Figures 2(b) depicts a schematic of the wavelength-swept laser. The laser employed the same SOA and a scanning wavelength filter based on a polygonal mirror scanner in a fiber-optic ring laser cavity.15 The scanning filter consisted of a diffraction grating (G, 830 lines per mm), two lenses in 4f configuration (L3; f = 60 mm, L4; f = 63.5 mm), and the same 40-facet polygonal mirror scanner as used for the pulsed source. The scanning filter was configured to have a free spectral range of 275 nm centered at 1320 nm wavelength, which resulted in a duty cycle of the laser output closely matched to that of the CCD camera (46%). When the pass band of the filter scans outside the gain bandwidth of the SOA, the source does not reach the lasing threshold and simply produces ASE.
Figure 3(c) shows the temporal characteristics of the laser output at a sweep repetition rate of 18.94 kHz. The region where the output power varies with a Gaussian-like profile corresponds to when the source was operated above the lasing threshold. Outside this region, the output is ASE with a constant power. To determine how much the ASE level contributed to the detected light during swept laser operation, the backward-propagating ASE power was measured by inserting a 5% tap coupler in the cavity between the filter and SOA (lower trace in Fig. 3(c), gray line). The ASE level dropped significantly during laser operation because ASE was suppressed due to gain saturation in the SOA. The laser-to-ASE ratio reached as high as 16 dB in the middle of the lasing tuning range. Horizontal bars (green) represent the integration window of the camera, which was synchronized with laser tuning. The average output power measured with a power meter was 18 mW. Figure 3(d) depicts the output spectrum measured with the optical spectrum analyzer in a peak-hold mode. In peak-hold mode, the contribution of ASE to the measurement would be negligible owing to its much lower spectral density than laser light at a given time. Therefore, the measured spectrum represents the tuning envelope of the swept laser. The tuning range was approximately 135 nm, centered at 1325 nm. The FWHM instantaneous linewidth of the swept output was approximately 0.4 nm, as determined by measuring the coherence length with a variable-delay interferometer.
3.2 OCT system
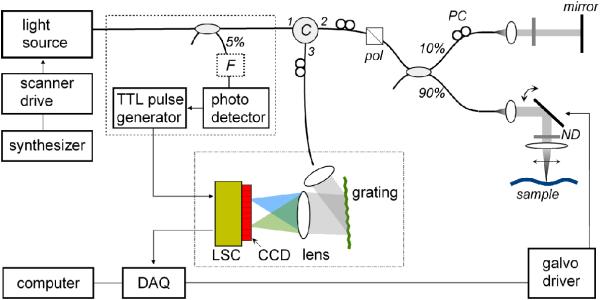
Figure 4 depicts a schematic of the SD-OCT system used in the experiment. The interferometer, probe, and detection spectrometer have been described elsewhere in detail.7 Briefly, the system included a circulator and a 10/90 coupler for the interferometer for efficient power utilization. A galvanometer was used in the probe to provide transverse beam scanning across a sample with a FWHM beam diameter and confocal length of 18 μm and 1.1 mm, respectively. The detection spectrometer, shown in the dash-dot box, consisted of a ruled diffraction grating with 1,200 lines per mm, focusing lens (f = 150 mm), and a line scan camera (LSC) with a 512-element InGaAs CCD array (Sensors Unlimited Inc., SU512LX). Polarization controllers were adjusted to maximize the fringe visibility in the CCD. A total wavelength span of 106 nm centered at 1320 nm was projected to the 512-element CCD array. Both the pulsed and swept sources were operated at a repetition rate of 18.939 kHz corresponding to the maximum readout rate of the camera. In the case of the pulsed light source, the electrical trigger pulses were generated directly from the optical pulses, as illustrated in the dotted box in Fig. 4. In the swept source case, the laser output was transmitted through a narrowband optical filter (presented by a small dotted box labeled F) comprising a circulator and a narrowband fiber Bragg grating reflector. The photodetector then detected a train of short pulses generated when the output spectrum of the laser swept through the reflection band of the Bragg grating. From the photodetector output, TTL trigger pulses were generated with adjustable phase delay to align the integration time window of the camera to the output of the light sources, as shown in Figs. 3(a) and (c). Upon receiving the trigger, the camera integrates photo-generated electrons for 24.4 μs; in the subsequent 28.4 μs period, the integrated voltage is read out. The camera output was digitized with a 4-ch, 12-bit data acquisition board (National Instruments, NI PCI-6115) and processed in a personal computer. The data processing involves zero padding, interpolation and mapping to linear k-space, prior to a fast Fourier transform to create an image.
Fig. 4.
Schematic of the experimental SD OCT system. F, fixed wavelength filter; pol, polarizer; PC, polarization controller; ND, neutral density filter; LSC, line scan camera; DAQ, data acquisition board.
3.3 Sample motion-induced signal fading
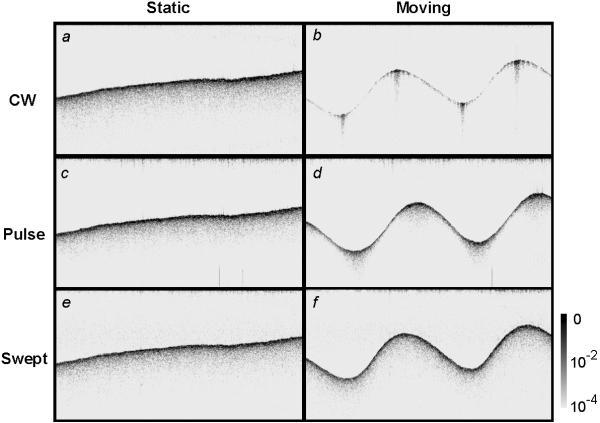
SD-OCT imaging was performed using three different light sources: (1) the cw ASE obtained directly from the SOA, (2) the intensity-gated ASE pulses [Fig. 2(a)], and (3) the wavelength swept laser [Fig. 2(b)]. In order to investigate motion artifacts, a sample was constructed by mounting paper on an acoustic speaker. Figure 5 compares the images obtained with three different sources. Shown on the left are OCT images acquired with cw, pulsed, and swept light, respectively, when the paper sample was kept stationary. Each image comprises 256 axial and 500 transverse pixels, spans a depth of 2.1 mm and a width of 5 mm, and was acquired over a total time period of 26.4 ms. The images were plotted using a logarithmic inverse grayscale over a dynamic range of 40 dB in reflectivity (refer to the grayscale map in Fig. 5). For each of the light sources, the optical power illuminating the sample was adjusted approximately to the same level by using neutral density filters in the probe. The offset of the grayscale map for each light source was finely adjusted so that the three static images (Fig. 5 (a), (c), and (e)) exhibited nearly the same contrast. Images of the axially moving sample (Figs. 5(b), (d), and (f)) were acquired when the speaker was driven with a sinusoidal waveform at 80 Hz with peak-to-peak amplitude of 0.7 mm. Signal fading due to fringe washout is distinct for the case of the cw ASE source (Fig. 5(b)). Except near the peaks and valleys of the oscillation when the axial velocity was zero, the image contrast and penetration depth were noticeably degraded. In contrast, the image d was obtained with the pulsed source and exhibits considerably reduced image fading. Signal fading was not observed while using the wavelength swept source (Fig. 5(f)).
Fig. 5.
SD-OCT images of a paper, acquired when the sample was static and moving at 80 Hz over 0.7 mm with three different light sources. Signal fading appears distinctly in image b obtained with cw ASE, but was greatly reduced with the pulsed source, d, and was not observed with the swept source, f.
To quantify the amount of signal fading, a sum of the pixel values in the unit of linear power along each A-line was obtained from the images in Fig. 5, representing a total signal power in the particular A-line. A total of 200 pixels, from the 31st to 230th elements, were considered in the summation. The results are plotted in Figs. 6(a)-(c) corresponding, respectively, to the cw source (Figs. 5(a) and (b)), the pulsed source (Figs. 5(c) and (d)), and the swept source (Figs. 5(e) and (f)). In each graph, the integrated signal power is plotted as a function of A-line index for the stationary-sample image (blue line) and the moving-sample image (black line). As depicted by the blue lines, the signal power for the stationary sample exhibits random fluctuation with standard deviation of approximately 2 dB due to speckle as the probe beam is scanned across the sample. The speckle-averaged mean value varies linearly over transverse locations of the sample, a variation that was attributed to the finite confocal parameter and resulting depth-dependent light collection efficiency. The signal power traces obtained from Figs. 5(b), (d), and (f) (black lines) clearly demonstrate the benefit of the pulsed and swept source in terms of reducing motion-induced signal fading.
Fig. 6.
Variations of total signal power, a sum of reflectivity of 256 depth points in each A-line, as a function of A-line index or time, obtained from (a) images a and b in Fig. 5, (b) c and d, (c) e and f in Fig. 5. Blue line: stationary sample, black line: moving sample, red line: theoretical curve.
The time gated pulses provided a factor 8.6 reduction in signal acquisition time, from 24.4 μs to 2.85 μs. For the swept source with an instantaneous linewidth of 0.40 nm, individual CCD pixels were illuminated effectively for only 75 ns per each A-line acquisition representing a 325-fold reduction in signal acquisition time based on Eq. (1). Theoretical curves (red lines) based on Eq. (1) show good correspondence with the experimental results with the following exceptions. The experimental noise floor prohibited detection of signal loss greater than -14 dB; the small discrepancy between the blue and black curves in Fig. 6(c), by up to 3 dB, is attributed to the uneven probe collection efficiency at different depths of the stationary and moving samples.
Relative intensity noise (RIN) of the pulsed ASE source was measured to be 7 dB higher than that of the cw ASE source at the same average power. Considering that ASE follows thermal light statistics, this result agrees well with the theoretical expectation of a 7.6-dB increase (χ = 5.7). In the experiment, the reference optical power was lowered compared to the cw operation to reduce the intensity noise and maximize signal-to-noise ratio (SNR). On the other hand, the relative intensity noise of the wavelength swept laser was found to be 10 to 20 dB higher, depending on the depth in the image, in comparison to the cw ASE source of the same average power. The best sensitivity obtained with the swept source was approximately -95 dB at a reference-arm power of 1-2 μW. In principle, dual balanced detection may be employed to reduce the intensity noise and thereby increase SNR.
3.4 Probe motion-induced signal fading
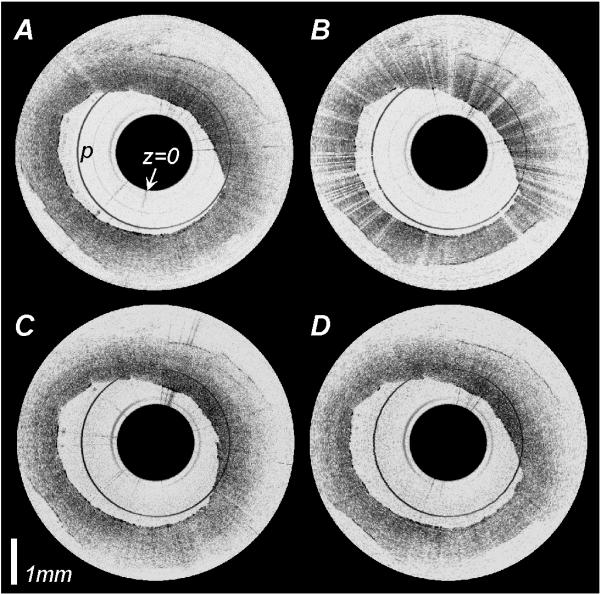
SD-OCT imaging of a human coronary artery in vitro was conducted by use of a fiber-optic catheter. The fiber-optic catheter comprised a graded-index lens and a 90-degree prism at its distal end and was connected to the interferometer through a high-speed rotational joint which could provide a rotational speed of up 100 revolutions per second (rps). Figure 7 depicts the images obtained with the cw ASE source (A and B) and the swept source (C and D) at the same A-line acquisition rate of 18.94 kHz. The difference between images A and B and between C and D is the rotational speed of the catheter, which was 9.5 rps for A and C, corresponding to 2000 A-lines per image, and 37.9 rps for B and D, corresponding to 500 A-lines per image. Zero delay of the interferometer was positioned between the sample and the outer prism surface, resulting in a circular artifact superimposed on the image of the tissue (marked as p).
Fig. 7.
SD-OCT images of a human coronary artery in vitro acquired with a fiber-optic rotational catheter at an A-line rate of 18.94 kHz. The rotation speed of the catheter and the light source that were used for each image are as follows. A; (4.5 rps, cw ASE source), B; (37.9 rps, cw ASE source), C; (4.5 rps, swept source), and C; (37.9 rps, swept source). Catheter-induced signal fading is distinct in B, however is nearly unnoticeable in D.
Image A represents a typical OCT image of the vessel. In contrast, Image B exhibits distinct radial streaks due to loss of signal. This image fading was attributed mainly to catheter-induced modulation in path length, increasing with the rotational speed. The path length modulation was partly due to wobbling motion of the tip of a rotating catheter modulating the distance between the probe and the sample. It was also found that mechanical vibration from a rotation joint modulated the length of the optical fiber inside the catheter by twist and strain. This mechanism accounts for the observation that the circle (p) corresponding to the prism surface also suffers from significant loss of contrast at the same radial locations. Figs. 7(c) and D depicts SD-OCT images obtained with the swept source. The signal fading is not noticeable in D, demonstrating clearly the benefit of the pulsed-source approach. Although transverse beam scanning over a sample can also create motion artifacts such as spatial resolution blurring, we did not analyze these artifacts since they manifest themselves with an order of magnitude less sensitivity than the signal fading due to fringe washout.
4. Discussion
SD-OCT has been demonstrated to provide dramatic improvements in sensitivity and image acquisition rate over time-domain OCT, but is prone to signal fading and image blurring due to motion. Although a solution to this limitation would be to develop faster CCD cameras, the shortest possible integration time will be ultimately limited by the minimum detection sensitivity required for sufficient image quality. We have investigated an alternative solution based on the use of pulsed and swept sources to provide a reduced effective integration time. Considering the challenges and expense of high-speed custom camera development, the methods described in this manuscript are particularly attractive.
As suggested by our results, multiple strategies can be applied to realize the benefit of pulsed or gated illumination. Traditional light sources have included cw SLD, cw ASE sources, modelocked lasers, and supercontinuum sources pumped by modelocked lasers. Each of these sources can be converted into a pulsed source by use of an external intensity modulation scheme. As an intensity modulator or switch, one may consider electro-optic or acousto-optic modulators or injection current modulation. Alternatively, CCD cameras with built-in electrical shutters may be used. This external gating approach, however, has a main drawback in that it results in a loss of optical power and therefore reduces the SNR. In other applications, however, the usable optical power in the system is often limited by the maximum permissible exposure of the sample. In this case, external gating would be an effective way to attenuate the power level entering the system from a powerful source. For example, ophthalmologic retinal imaging has been performed with SD-OCT at a wavelength of 800-nm. At this wavelength, according to American National Standards Institute (ANSI), the maximum permissible exposure (MPE) to the eyes in vivo is limited to approximately 620 μW for cw light as well as a continuous train of high-repetition modelocked pulses with pulse durations longer than 100 fs at the sample.16 The MPE level is equivalent for short bursts of pulses where the bursts are synchronized with the A-line acquisition at a rate higher than 68 kHz for a total exposure duration longer than 10 s. For a lower A-line rate than 68 kHz, the maximum permissible single pulse energy must be considered. At an A-line rate of 20 kHz, for instance, the MPE level could stay at 620 μW if the duration of individual pulses is made (stretched) longer than 50 ps or each burst consists of more than 4 modelocked pulses with a >100 fs pulse duration. One may therefore gate the output from a commercially available high-repetition modelocked Ti:Sapphire laser and reduce sensitivity to motion, while still providing sufficient power to the system. The time gating operation, however, increases the intensity noise compared to the use of a simple attenuator, as discussed in Section 2.3.
Instead of external gating, various power-efficient internal modulation techniques may be employed. For example, Q-switching and cavity dumping are well known techniques applicable to ultrashort pulsed lasers.17 Q-switched supercontinuum sources with repetition rates of a few to tens of kHz have been reported and may be suitable for use in SD-OCT.18,19 Beside the benefit of reducing motion artifacts, the reduced fringe washout of the pulsed source approach may also facilitate quadrature fringe detection based on sinusoidal phase dithering.4,20
The use of a wavelength swept source as described in this manuscript is essentially a hybrid between OFDI and SD-OCT that may permit otherwise stringent OFDI source requirements including narrow instantaneous linewidth and tuning linearity to be relaxed. In this case, the high resolution and linearity of the spectrometer can accommodate a swept laser with a nonlinear tuning element such as a resonantly scanned Fabry-Perot filter or a tunable source based on soliton self-frequency shifting in nonlinear fibers.21,22 Furthermore, the relaxed requirement on the instantaneous linewidth of a swept laser may facilitate the generation of higher output powers because a scanning filter with a low finesse can be used.
In conclusion, we have described, for the first time to our knowledge, the use of a pulsed broadband source and a wavelength-swept source for SD-OCT and have demonstrated the benefit of these methods for greatly reducing motion artifacts over conventional approaches based on cw or high repetition-rate pulses. Moreover, we have conducted, for the first time to our knowledge, catheter-based imaging with SD-OCT. The significant motion artifacts associated with high-speed catheter operation emphasize the benefit of the short light illumination provided by pulsed and swept sources. We expect that these approaches in SDOCT may find a wide range of applications.
Acknowledgments
This research was supported in part by the National Institute of Health contracts (R01-HL70039, R01-RR019768, R33-CA110130), the Center for Integration of Medicine and Innovative Technology (for technical development only), and by a generous gift from Dr. and Mrs. J.S. Chen to the optical diagnostics program of the Massachusetts General Hospital Wellman Center for Photomedicine.
Footnotes
OCIS codes: (110.4500) Optical coherence tomography; (120.3180) Interferometry; (170.3880) Medical and biological imaging
References and links
- 1.Fercher AF, Hitzenberger CK, Kamp G, El-Zaiat SY. Measurement of intraocular distances by backscattering spectral interferometry. Opt. Comm. 1995;117:43–48. [Google Scholar]
- 2.Hausler G, Lindner MW. Coherence radar and spectral radar - new tools for dermatological diagnosis. J. Biomed. Opt. 1998;3:21–31. doi: 10.1117/1.429899. [DOI] [PubMed] [Google Scholar]
- 3.Andretzky P, Lindner MW, Herrmann JM, Schultz A, Konzog M, Kiesewetter F, Hausler G. Optical coherence tomography by spectral radar: dynamic range estimation and in vivo measurements of skin. Proc. SPIE. 1998;3567:78–87. [Google Scholar]
- 4.Wojtkowski M, Kowalczyk A, Leitgeb R, Fercher AF. Full range complex spectral optical coherence tomography technique in eye imaging. Opt. Lett. 2002;27:1415–1417. doi: 10.1364/ol.27.001415. [DOI] [PubMed] [Google Scholar]
- 5.Wojtkowski M, Bajraszewski T, Targowski P, Kowalczyk A. Real time in vivo imaging by high-speed spectral optical coherence tomography. Opt. Lett. 2003;28:1745–1747. doi: 10.1364/ol.28.001745. [DOI] [PubMed] [Google Scholar]
- 6.Nassif N, Cense B, Park BH, Yun SH, Chen TC, Bouma BE, Tearney GJ, de Boer JF. In vivo human retinal imaging by ultrahigh-speed spectral domain optical coherence tomography. Opt. Lett. 2004;29:480–482. doi: 10.1364/ol.29.000480. [DOI] [PubMed] [Google Scholar]
- 7.Yun SH, Tearney GJ, Bouma BE, Park BH, de Boer JF. High-speed spectral domain optical coherence tomography at 1.3 μm wavelength. Opt. Express. 2003;11:3598–3604. doi: 10.1364/oe.11.003598. http://www.opticsexpress.org/abstract.cfm?URI=OPEX-11-26-3598. [DOI] [PMC free article] [PubMed] [Google Scholar]
- 8.Nassif N, Cense B, Park BH, Yun SH, Tearney GJ, Bouma BE, Chen TC, de Boer JF. In vivo high-resolution video-rate spectral-domain optical coherence tomography of the human retina and optic nerve. Opt. Express. 2004;12:367–376. doi: 10.1364/opex.12.000367. http://www.opticsexpress.org/abstract.cfm?URI=OPEX-12-3-367. [DOI] [PubMed] [Google Scholar]
- 9.Leitgeb RA, Drexler W, Unterhuber A, Hermann B, Bajraszewski T, Le T, Stingl A, Fercher AF. Ultrahigh resolution Fourier domain optical coherence tomography. Opt. Express. 2004;12:2156–2165. doi: 10.1364/opex.12.002156. http://www.opticsexpress.org/abstract.cfm?URI=OPEX-12-10-2156. [DOI] [PubMed] [Google Scholar]
- 10.Cense B, Nassif NA, Chen TC, Pierce MC, Yun S, Park BH, Bouma BE, Tearney GJ, de Boer JF. Ultrahigh-resolution high-speed retinal imaging using spectral-domain optical coherence tomography. Opt. Express. 2004;12:2435–2447. doi: 10.1364/opex.12.002435. http://www.opticsexpress.org/abstract.cfm?URI=OPEX-12-11-2435. [DOI] [PubMed] [Google Scholar]
- 11.Wojtkowski M, Srinivasan VJ, Ko TH, Fujimoto JG, Kowalczyk A, Duker JS. Ultrahigh-resolution, high-speed, Fourier domain optical coherence tomography and methods for dispersion compensation. Opt. Express. 2004;12:2404–2422. doi: 10.1364/opex.12.002404. http://www.opticsexpress.org/abstract.cfm?URI=OPEX-12-11-2404. [DOI] [PubMed] [Google Scholar]
- 12.Yun SH, Tearney GJ, de Boer JF, Bouma BE. Motion artifacts in optical coherence tomography with frequency domain ranging. Opt. Express. 2004;12:2977–2998. doi: 10.1364/opex.12.002977. http://www.opticsexpress.org/abstract.cfm?URI=OPEX-12-13-2977. [DOI] [PMC free article] [PubMed] [Google Scholar]
- 13.Yun SH, Tearney GJ, de Boer JF, Iftimia N, Bouma BE. High-speed optical frequency-domain imaging. Opt. Express. 2003;11:2953–2963. doi: 10.1364/oe.11.002953. http://www.opticsexpress.org/abstract.cfm?URI=OPEX-11-22-2953. [DOI] [PMC free article] [PubMed] [Google Scholar]
- 14.Sorin WV. Noise sources in optical measurements. In: Derickson D, editor. Fiber optic test and measurement. Hewlett Packard Company, Prentice Hall; New Jersey: 1998. pp. 597–613. [Google Scholar]
- 15.Yun SH, Boudoux C, Tearney GJ, Bouma BE. High-speed wavelength-swept semiconductor laser with a polygon-scanner-based wavelength filter. Opt. Lett. 2003;28:1981–1983. doi: 10.1364/ol.28.001981. [DOI] [PubMed] [Google Scholar]
- 16.American National Standards Institute . American National Standard for Safe Use of Lasers Z136.1. Orlando: 2000. [Google Scholar]
- 17.Saleh BEA, Teich MC. Fundamental of photonics. ch 14. John Wiley & Sons; New York: 1991. [Google Scholar]
- 18.Chernikov SV, Zhu Y, Taylor JR, Gapontsev VP. Supercontinuum self-Q-switched ytterbium fiber laser. Opt. Lett. 1997;22:298–300. doi: 10.1364/ol.22.000298. [DOI] [PubMed] [Google Scholar]
- 19.Wadsworth WJ, Joly N, Knight JC, Birks TA, Biancalana F, Russell PSJ. Supercontinuum and four-wave mixing with Q-switched pulses in endlessly single-mode photonic crystal fibres. Opt. Express. 2004;12:299–309. doi: 10.1364/opex.12.000299. http://www.opticsexpress.org/abstract.cfm?URI=OPEX-12-2-299. [DOI] [PubMed] [Google Scholar]
- 20.Dubois A, Grieve K, Moneron G, Lecaque R, Vabre L, Boccara C. Ultrahigh-resolution full-field optical coherence tomography. Appl. Opt. 2004;43:2874–2883. doi: 10.1364/ao.43.002874. [DOI] [PubMed] [Google Scholar]
- 21.Washburn BR, Ralph SE, Lacourt PA, Dudley JM, Rhodes WT, Windeler RS, Coen S. Tunable near-infrared femtoseconds soliton generation in photonic crystal fibres. Electron. Lett. 2001;37:1511–1512. [Google Scholar]
- 22.Price JHV, Furusawa K, Monro TM, Lefort L, Richardson DJ. Tunable, femtoseconds pulse source operating in the range 1.06-1.33 mm based on an Yb3+-doped holey fiber amplifier. J. Opt. Soc. Am. B. 2002;19:1286–1293. [Google Scholar]


