Abstract
A novel optical frequency-domain imaging system is demonstrated that employs a passive optical demodulation circuit and a chirped digital acquisition clock derived from a voltage-controlled oscillator. The demodulation circuit allows the separation of signals from positive and negative depths to better than 50 dB, thereby eliminating depth degeneracy and doubling the imaging depth range. Our system design is compatible with dual-balanced and polarization-diverse detection, important techniques in the practical biomedical application of optical frequency-domain imaging.
As in traditional time-domain optical coherence tomography (OCT), optical frequency-domain imaging (OFDI) displays depth-resolved, cross-sectional images of tissue reflectivity.1,2 In contrast to optical coherence tomography, however, OFDI uses a frequency-domain ranging technique3,4 to determine the depth from which light is backreflected in the sample. In this technique depth is encoded in the spectral frequencies of the fringes formed by interfering the sample light with a reference beam. To measure the spectral fringes, an OFDI system uses a narrowband, wavelength-swept source and records the interference signal as a function of time with single-element detectors. Because of the nonzero instantaneous linewidth of the wavelength-swept source, the sensitivity of the system decreases as the magnitude of the differential interferometer delay increases. This sensitivity falloff limits the imaging depth range of the system. Furthermore, the inability of frequency-domain ranging to differentiate between positive and negative delays, referred to as depth degeneracy or complex conjugate ambiguity, can result in severe image distortion artifacts. To prevent these artifacts, the sample can be localized entirely to one side of the zero differential delay depth. This straightforward approach, however, limits the usable imaging depth range to one half of the signal-to-noise ratio (SNR)-limited range. Because imaging depth range is critical in many applications, methods for removing depth degeneracy in OFDI and recovering the full usable ranging depth are of significant interest.
Another technical challenge specific to OFDI arises in the digitization and processing of the spectral interferometric fringes. Computing depth-dependent reflectivity relies on a Fourier transform of the measured fringe from wavenumber (k) space to the depth coordinate. For transform-limited axial resolution, signals must be measured on, or mapped to, a uniformly spaced grid in k space. Since OFDI laser sources generally do not sweep the wavenumber linearly in time, digitization using a fixed time-interval sample clock requires resampling through interpolation, a computationally intensive process that limits display rates. An elegant solution to this problem is the use of an appropriately chirped sample clock.5 This approach allows the signal to be directly digitized at uniform k intervals, eliminating the need for resampling.
Approaches that address these two, distinct technical challenges have been demonstrated.5–8 In this Letter we present a new method for demodulating signals in OFDI that removes depth degeneracy and permits the use of a chirped clock, and we demonstrate this approach for high-speed imaging.
A diagram of the OFDI system is shown in Fig. 1. The laser output was swept over 105 nm centered at 1325 nm (∼15 mW average output power) and was split into a sample arm (90%) and a reference arm (10%). A portion of the reference arm light was directed to a fiber Bragg grating (FBG), generating a reflected optical pulse that was detected and converted to a transistor–transistor logic (TTL) trigger signal. The remainder of the reference arm light passed through a variable optical delay in order to path-length match the interferometer and was input to one port of a fiber-pigtailed polarization beam combiner (PBC). A polarization controller (PC) in the reference arm was used to maximize the coupling of the reference arm light through the PBC. The reflected sample arm light was directed to the other input port of the PBC. One polarization state of this light was coupled to the PBC output port (generalization to a polarization diversity configuration is discussed later). The dashed box in Fig. 1 encloses the optical demodulation circuit that used polarization-based biasing9,10 to generate an in-phase signal, SI, and a quadrature signal, SQ, for each interference fringe. After digitization (NI-6115), these signals were used to construct a complex interference signal (SI+iSQ). Because a complex signal indicates the direction of phase flow, it allows unambiguous discrimination between positive and negative optical delays. To understand the operation of the demodulation circuit, note that the reference arm light and the sample arm light were orthogonally polarized after combination by the first PBC in Fig. 1, resulting in modulation of the output state of polarization rather than intensity. The polarization-modulated light was split by the 50/50 coupler, and each output was directed through a PC to a polarization beam splitter (PBS) that converted the polarization modulation to intensity modulation. In each path, the PC was set to split the reference arm light equally between the two output ports of the PBSs, and the outputs were connected to balanced receivers to provide subtraction of intensity noise. We define the signal from the upper path as SI and from the lower path as SQ. It can be shown that, within the constraint of equally splitting the reference arm power among the output ports, the phase of SI and SQ can be arbitrarily set by manipulation of the polarization controllers PCI and PCQ, respectively.9 In our system a relative phasing of approximately 90° between SI and SQ was induced.
Fig. 1.

Diagram of the OFDI system. The data acquisition card (DAQ) samples the two signals on the analog input (AI) channels and generates a voltage waveform for controlling the sample clock on the analog output (AO). Each A line is synchronized with a TTL signal generated by the receiver (Rx) and TTL pulse generator (PG) on the trigger (trig) input of the DAQ. B.R., balanced receiver; CLK, clock.
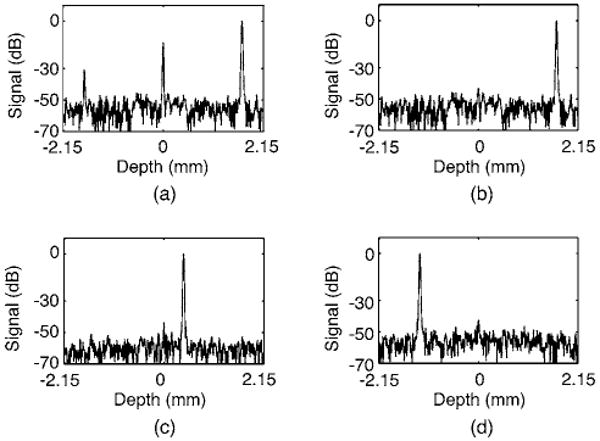
Figure 2(a) depicts a measured A line of a stationary mirror at a depth of +1.7 mm calculated by the Fourier transform of the measured complex signal, (SI+iSQ). The resultant extinction between the real positive-depth peak and the artifact at −1.7 mm was 30 dB and was limited by imperfections in the optical demodulation circuit such as wavelength-dependent loss or an incorrect PC setting. It is possible to improve the extinction by first measuring the state of the demodulation circuit and subsequently using these measurements to calculate corrected in-phase and quadrature signals. To illustrate, we write the detected in-phase and quadrature signals at a given wavenumber as SI=B sin(φ) and SQ=αB cos(φ−ε), where B denotes the in-phase signal amplitude, φ denotes the phase, and it has been assumed that the dc component has been subtracted. The parameters α and ε describe the amplitude and the phase differences between the signals. For ideally formed in-phase and quadrature signals, α=1 and ε=0. Consider that, because of an imperfect setting of the demodulation circuit, the parameters α and ε deviate from the ideal, but their values are known. A corrected quadrature signal, ŜQ=B cos(φ), can be calculated from the measured signals SI and SQ and the parameters α and ε (Ref. 11) as
Fig. 2.

(a) A line for a sample mirror at depth +1.7 mm without digital correction. (b)–(d) A lines for the sample mirror at depths of +1.7 mm, +0.4 mm, and −1.3 mm with digital correction.
An improved extinction between positive and negative depths can then be achieved through the use of the corrected complex interference signal formed as (SI+iŜQ). To measure the parameters α and ε and their wavenumber dependence for a given setting of the optical demodulation circuit, multiple interference fringes were recorded in the presence of a sample arm reflection while the reference arm position was slowly displaced over a few micrometers with a piezotranslator. The resulting data set contained signals SQ and SI at each wavenumber with a quasi-randomized distribution in phase (φ) arising from dithering the reference arm position. The calibration parameters were then calculated statistically according to
| (1) |
| (2) |
where σx is the standard deviation (over the sample number) of the measured signal x and is a function of wavenumber. In these experiments the reference mirror was translated by a few micrometers with a 30 Hz triangular waveform, and signals were recorded over a time period of 3 s at an A-line rate of 15.6 kHz. Figure 2(b) shows the same A line as in Fig. 2(a) but using the corrected complex signal, (SI+iŜQ). The extinction is improved from 30 dB to greater than 50 dB. Figures 2(c)–2(d) show A lines measured at mirror depths of +0.4 and −1.3 mm, respectively. Each of Figs. 2(b)–2(d) used the same previously derived calibration parameters α and ε and demonstrate greater than 50 dB extinction. It was observed that, with proper environmental shielding of the optical demodulation circuit, the calibration coefficients remained valid over periods greater than 60 min. The sensitivity of the system was measured to vary from 107 dB near a depth of +0.2 mm to 103 dB at a depth of +2.0 mm.
Generalization of the single-polarization system of Fig. 1 to a polarization-sensitive system can be accomplished by replacing the three-port PBC of Fig. 1 with a four-port PBC, setting the reference arm PC to split the light equally between the two output ports, and repeating the demodulation optics shown in Fig. 1 on each of the two output ports.
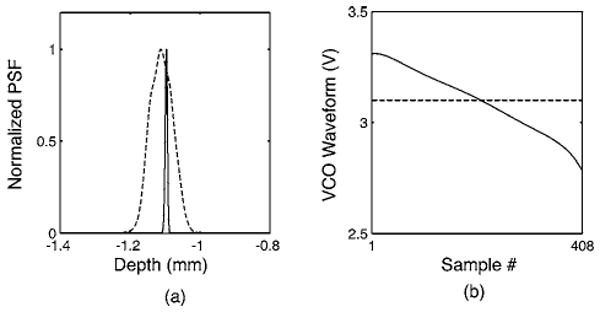
To demonstrate chirped-clock sampling, we constructed a clock generator using a voltage-controlled oscillator (VCO) circuit. The clock frequency was swept phase continuously based on a smoothly varying analog waveform generated by the data acquisition electronics. The waveform was triggered by the same trigger signal used for data acquisition and was therefore synchronized to the source sweep. Figure 3(a) shows the measured axial point spread function of a mirror located at a depth of approximately −1.1 mm for both a constant-time-interval clock signal (dashed curve) and a constant k-interval clock signal that swept from 8.4 to 6.9 MHz over one A line (solid curve). The point spread functions shown in Fig. 2 were also acquired by using chirped-clock sampling. Figure 3(b) shows the corresponding analog waveforms used to control the VCO clock circuit. A straightforward iterative routine was used to find the optimal VCO analog waveform for a given configuration of the source. This waveform remained valid until the source was reconfigured. For the chirped-clock signal, the axial resolution was measured to be 11.2±1 μm in air over the full imaging depth range from −2.15 mm to 2.15 mm. This is in reasonable agreement with the calculated transform-limited resolution of 10.2 μm.
Fig. 3.

(a) Axial point spread functions of a mirror with a constant-frequency clock signal (dashed curve) and the chirped-frequency clock signal (solid curve). The VCO waveforms used to generate the constant-frequency (dashed curve) and chirped-frequency (solid curve) clock signals are shown in (b).
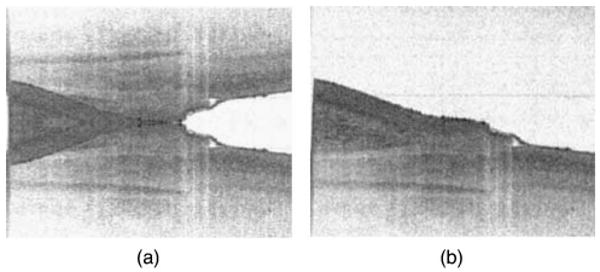
Images of a human finger acquired in vivo at an A-line rate of 15.6 kHz (30 images/s) are shown in Fig. 4. The image size is 5 mm transverse by 4.3 mm depth (500 × 408 pixels). In Fig. 4(a) the image was generated based on only the in-phase signal, SI, and demonstrates pronounced depth-degeneracy artifacts. In Fig 4(b), the complex signal was used, demonstrating artifact-free imaging over a depth range of 4.3 mm.
Fig. 4.

Images of a human finger near the nailbed (a) without and (b) with complex modulation.
The optical demodulation circuit presented in this paper provides an extended imaging depth and allows faster display rates through the use of a chirped sampling clock. The extended imaging depth is critical in many endoscopic applications in which the distance to the tissue surface cannot be precisely controlled, and faster image display rates are useful in applications in which the images are used as feedback within a procedure.
Acknowledgments
This research was supported in part by NIH contracts R01 HL70039, R33 CA110130, and R01 HL076398, and by the Terumo Corporation.
References
- 1.Yun SH, Tearney GJ, de Boer JF, Iftimia N, Bouma BE. Opt Express. 2003;11:2953. doi: 10.1364/oe.11.002953. [DOI] [PMC free article] [PubMed] [Google Scholar]
- 2.Choma MA, Sarunic MV, Yang CH, Izatt JA. Opt Express. 2003;11:2183. doi: 10.1364/oe.11.002183. [DOI] [PubMed] [Google Scholar]
- 3.Fercher AF, Hitzenberger CK, Kamp G, Elzaiat SY. Opt Commun. 1995;117:43. [Google Scholar]
- 4.Kingsley SA, Davies DEN. Electron Lett. 1985;21:434. [Google Scholar]
- 5.Sarunic MV, Choma MA, Yang CH, Izatt JA. Opt Express. 2005;13:957. doi: 10.1364/opex.13.000957. [DOI] [PubMed] [Google Scholar]
- 6.Yun SH, Tearney GJ, de Boer JF, Bouma BE. Opt Express. 2004;12:4822. doi: 10.1364/opex.12.004822. [DOI] [PMC free article] [PubMed] [Google Scholar]
- 7.Zhang J, Nelson JS, Chen ZP. Opt Lett. 2005;30:147. doi: 10.1364/ol.30.000147. [DOI] [PubMed] [Google Scholar]
- 8.Maheshwari A, Choma MA, Izatt JA. Proc SPIE. 2005;5690:91. [Google Scholar]
- 9.Jackson DA, Kersey AD, Lewin AC. Electron Lett. 1984;20:399. [Google Scholar]
- 10.Zhao Y, Chen Z, Saxer C, Xiang S, de Boer JF, Nelson JS. Opt Lett. 2000;25:114. doi: 10.1364/ol.25.000114. [DOI] [PubMed] [Google Scholar]
- 11.Choma MA, Yang CH, Izatt JA. Opt Lett. 2003;28:2162. doi: 10.1364/ol.28.002162. [DOI] [PubMed] [Google Scholar]


