Abstract
At present, optical coherence tomography systems have a limited imaging depth or axial scan range, making diagnosis of large diameter arterial vessels and hollow organs difficult. Adaptive ranging is a feedback technique where image data is utilized to adjust the coherence gate offset and range. In this paper, we demonstrate an adaptive optical coherence tomography system with a 7.0 mm range. By matching the imaging depth to the approximately 1.5 mm penetration depth in tissue, a 3 dB sensitivity improvement over conventional imaging systems with a 3.0 mm imaging depth was realized.
1. Introduction
Optical Coherence Tomography (OCT) is a cross-sectional optical imaging technique [1] that can be used to obtain images of living human tissues with an axial resolution of several microns. OCT is routinely used in the field of ophthalmology [2,3] and multiple medical applications for this technology have been proposed [4-12] in other multiple scattering tissues. Recent research has demonstrated that OCT is capable of identifying the features of plaques that cause sudden cardiac death [9,10] and dysplasia in Barrett's esophagus [11]. Unfortunately, application of OCT in the fields of cardiology, gastroenterology, and ophthalmology is limited by its inability to obtain data when the surface height of the tissue varies by more than the total reference arm scan length or coherence gating range. This limitation of current OCT systems prevents imaging of many clinically relevant sites [11,12].
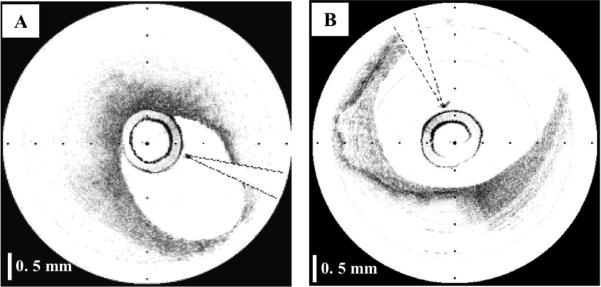
Current OCT systems have a fixed coherence gate range [13], typically ~3 mm, over which image information may be obtained. This range is selected as a compromise that allows imaging of tissue with a penetration of 1-1.5 mm while allowing for small (~1 mm) variations in distance between the probe and tissue surface. For tissues such as the proximal coronary arteries with a luminal diameter as large as 5 mm, a scanning range of 3 mm is not sufficient. The range requirement is severe for imaging coronary arteries since in many cases, the catheter rests against one side of the vessel wall, as it is shown in Fig. 1(A). As a result, the arterial wall opposite the catheter is not within the coherence gate range, preventing full visualization of one side of the arterial wall. For a large artery (Fig. 1(B)), large portions of the vessel wall may be outside the gate range. Tissue height variations can be even greater in the gastrointestinal (GI) tract. As a result, circumferential scanning devices for the GI tract require deinsufflation [14,15] in order to image the mucosal surface, which can preclude imaging of significant portions of the GI mucosa.
Fig. 1.
OCT images of coronary arteries obtained in vivo; A- Artery with the catheter resting against the vessel wall; B-Large artery with a significant portion of the image outside of the coherence range. Tick marks, 500 μm.
One solution that could accommodate large surface height variations would be to increase the coherence gating range of the interferometer. However, a larger range would stress the delay scanning mechanism and decrease the system sensitivity due to an increase in the interferometric signal bandwidth [13].
In this paper, we present a simple but very efficient method, which we term adaptive ranging (AR), that enables an increased OCT scan range. This method adaptively detects the surface of the sample and adjusts the reference delay-scanning offset so that the surface data is always at the top of the image. Since this feedback control corrects for surface height variation, and tissue penetration depths do not typically exceed ~1.5 mm, the scan range for a single axial scan may be reduced to 1.5 mm, resulting in a commensurate increase in sensitivity. AR technology operates in real-time and does not require major hardware modifications to conventional OCT systems.
2. Method and materials
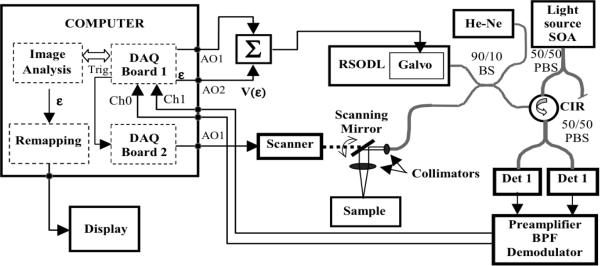
The adaptive ranging method included an algorithm for identifying and tracking the surface of the sample, and a mechanism that utilizes this surface data to dynamically control the origin of the axial scan. The origin of the axial scan was controlled applying an offset voltage to the rapid-scanning optical delay (RSOD) line galvanometer by means of a summation circuit. A simplified schematic that illustrates the AR implementation in a standard time-domain OCT system is shown in Fig. 2.
Fig. 2.
Schematic of the AR implementation in a standard OCT system.
On performing the first scan, the algorithm identifies the surface of the sample (Fig. 3). An error signal ε that represents the difference between the sample surface location and the current position of the coherence gate is generated. The error signal is used to control the origin of the axial scan, so that the subsequent axial scan is initiated just prior to the surface of the sample. The digitized error signal is also used to re-map the coordinates of the acquired data in order to display the true image geometry.
Fig. 3.
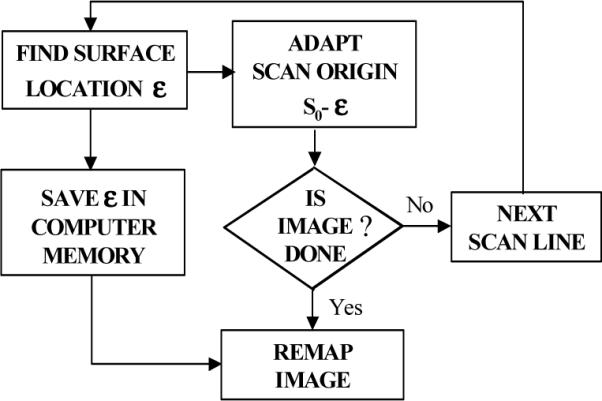
Flow chart depicting the adaptive ranging algorithm.
As can be seen, the only electronic hardware modification to a standard OCT system is the insertion of a summation circuit, which adds an offset Vε(t), proportional to ε, to the triangle waveform of the RSOD (Fig. 4).
Fig. 4.
RSOD Galvanometer driving waveforms. a)- Non AR regime; b) Offset signal; c) AR-regime - summation of the offset with the triangle waveform.
2.1 Surface detection and tracking algorithm
The surface location algorithm was based on first and second moment calculations [16] applied to the average of two axial reflectivity profiles. The first moment, σ1, was used to calculate the centroid or weighted mean value of the axial reflectivity profile, while the second moment, σ2, was utilized to estimate the surface location: ε = σ1 - σ2 (Fig 5). Due to limitations in CPU processing speed, the surface location was computed for every 4 A-lines, The RSOD voltage offset was a constant, V(ε) = γε, where the gain factor γ was empirically determined by imaging samples with various surface profiles. Gamma was adjusted until the AR system placed the surface of the tissue at the same axial location. For values of gamma that were too low, the AR system underestimated the required coherence gate offset and as a result, the location of the image surface was partially, but not completely corrected. For values of gamma that were too high, the AR system overestimated the coherence gate offset, resulting in a sample surface that appeared as a scaled mirror image of the true sample surface with AR “off”. The same digitized error signal, ε, was also utilized to re-map the coordinates of the acquired data for accurate two-dimensional representation of the tissue geometry during data display.
Fig. 5.
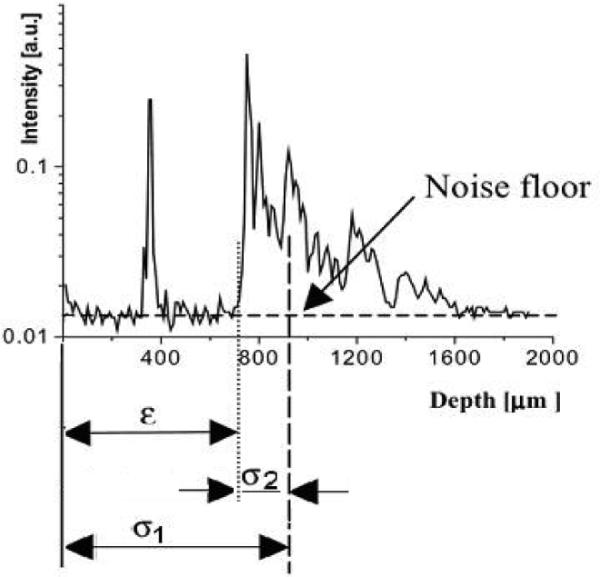
OCT axial reflectivity profile: σ1 is the centroid of the axial reflectivity profile, σ2 is the second moment, and ε is the location of the sample surface.
2.3 Adaptive ranging implementation in MGH TD-OCT system
We have implemented the AR scheme in our TD-OCT system. A schematic of this system is presented in Fig. 6. A semiconductor optical amplifier (SOA, AFC Technology) was used as a light source. It had a maximum power of 20 mW and a 70 nm full-width-at-the-half-maximum (FWHM) spectrum centered at 1310nm. This allowed for a longitudinal resolution of about 10 μm in air. Light from the source was sent to a 50/50 fiber polarization beam-splitter (PBS). The linearly polarized light after the PBS was sent to a fiber-based interferometer with a RSOD line [17] in the reference arm and a scanning probe in the sample arm. The RSOD was also used to compensate dispersion imbalance in the two arms of the interferometer [18]. The RSOD utilized a galvanometer (Cambridge Technology Inc. Model 6210, Cambridge, MA) to scan the group delay. The mirror mounted to the galvanometer was custom shaped to decrease the moment of inertia and provide a clear aperture of 1mm for the dispersed spectrum required for phase control scanning. When cooled and driven with a rounded triangular waveform, this galvanometer was capable of providing an A-line rate of 2 kHz for a mechanical scan angle of 2.5 deg., with 99 % linearity over a 70 % duty cycle. For the experiments in this paper, we ran the galvanometer at 1 kHz rounded triangular waveform (equivalent to a 2 kHz A-line rate) over a mechanical scan angle of 1.5 deg. For these settings, the custom galvanometer achieved a duty cycle of 78%, which represented approximately 18% improvement over the stock 6210/mirror combination. We utilized this custom galvanometer due to its improved linearity, but the AR scheme is general and should be equally effective for standard off-the-shelf galvanometer-based RSOD lines.
Fig. 6.
Schematic of the MGH AR TD-OCT System. SOA -Semiconductor Optical Amplifier, Σ-summator, PBS-Polarization Beam splitter; BS-beam splitter, BPF-Band Pass Filter.
A circulator was interposed between the PBS and BS in order to maximize the amount of light that was transmitted to the sample arm of the interferometer [18]. Interference fringes were detected by two InGaAs fiber pigtailed PIN detectors (EG&G), preamplified, band pass filtered and demodulated in order to extract the envelope. A custom electronic board was used for fringe amplification, filtering and demodulation. A PBS was used for polarization diversity detection [13]. The demodulated signals were digitized using a PCI 6110 DAQ card (National Instruments) with a sampling rate of 5MS/second, processed and displayed as a two dimensional image using a inverse look-up table.
Hardware modifications to our TD-OCT system required for AR included the implementation of a custom circuit designed to add the error offset signal V(ε) to the galvanometer driving waveform, and the use of a larger aperture (50 mm) achromat lens (Edmund Industrial Optics) in the RSOD line in order to accommodate a larger scanning angle of the galvanometer without clipping the reference beam.
3. Measurements and results
With the AR turned on, our system was capable of providing 10 μm axial resolution images at a rate of 4 images/second with (500 transverse × 250 axial) pixels. Images were displayed using an inverse gray scale LUT and digitally stored in real-time. The maximum scanning distance provided by AR was 7 mm. We tested the performance of the AR method by using three different lateral scanning mechanisms, depending on the sample type. A hand-held x-y scanning probe was used to get cross-sectional images of planar tissue samples, and a rotating 3.2 F cardiovascular catheter, developed in our laboratory [12], was used to obtain circumferential cross-sectional images of arterial segments. A slit-lamp scanner was utilized to obtain ophthalmic images. In vivo and ex vivo measurements were done in both AR and non-AR regime in order to check the viability of the AR method.
3.1 Measurement of the scanning distance
We have measured the imaging depth of our AR OCT system by continuously moving the position of the sample along the z direction over a range of several millimeters. Different samples were used, including human aorta specimens, pig and chicken skin. Also, in vivo images were taken from a volunteer finger.
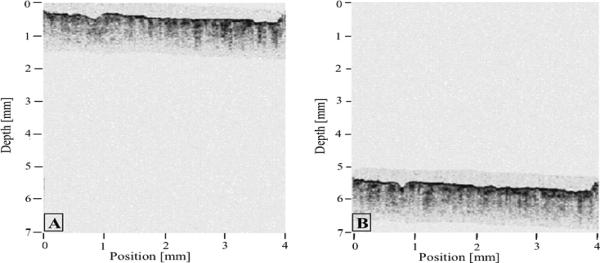
An example of the imaging depth afforded by this technology is shown in Figs. 7(A) & 7(B). In vivo OCT images of the dorsal aspect of a finger have been taken. The finger was slowly moved along the z scanning direction over a distance of approximately 5 mm. Fig. 7(A) shows an OCT image with the finger in the initial position. Fig. 7(B) shows an OCT image with the finger in the final position. An imaging range of about 7 mm was possible in the AR regime. A 1.5 mm scanning rage was used for this experiment.
Fig. 7.
AR OCT images of a dorsal finger, obtained in vivo. The finger was slowly moved along the z scanning direction over a distance of approximately 5 mm. A. OCT image with the finger in the initial position; B. OCT image with the finger in the final position.
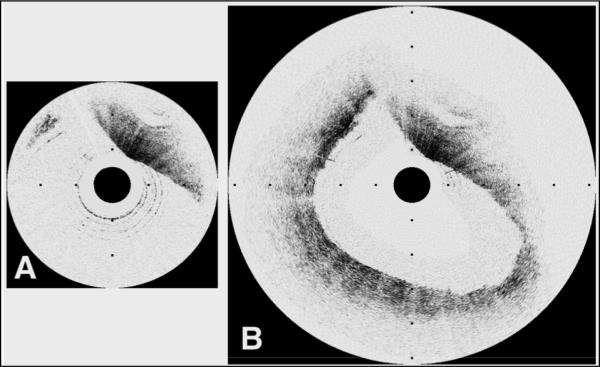
Another example is that of a coronary arterial segment. A representative case of a carotid artery with a 6.0 mm luminal diameter is shown in Fig. 8. Traditional OCT image (Fig. 8.(A)) demonstrates visualization of only a small portion of the arterial cross-section. Adaptive ranging enables imaging of the entire arterial cross-section with high signal strength (Fig. 8.(B)). As can be seen, in the AR image, the resolution doesn't decrease substantially, and the entire vessel was imaged. This demonstrates the new capability of OCT systems to allow clinical imaging of large coronary arteries, which may have luminal diameters of more than 4 mm at the left main coronary artery and ostia [19].
Fig. 8.
Images of a carotid plaque with a 6.0 mm maximum luminal diameter. A. Traditional OCT image demonstrates visualization of only a small portion of the arterial cross-section. B. Adaptive ranging enables imaging of the entire arterial cross-section with high signal strength. Tick marks, 1 mm.
Adaptive ranging has also been applied to minimize motion artifact in the axial direction for real-time in vivo retinal imaging of human volunteers. The OCT system used in the eye study has been described previously [20, 21]. In order to compare data obtained with and without AR, we examined retinal images without AR and retinal images with AR obtained from the same location. Images were acquired from the right eye of the same volunteer while performing a circular scan around the optic nerve head. OCT retinal images without and with AR implementation are shown in Figs. 9(A) and 9(B). As can be seen on the left side of Fig. 9(A), without AR some parts of the retina were outside the imaging window, because of involuntary eye movements and the dynamic topography of the retina. The AR OCT image from Fig. 9(B) corrects for these fluctuations in retinal position and shows the benefit of the AR implementation. This demonstrates again the new capability of OCT systems to allow clinical retinal imaging in the presence of involuntary movements of the eye.
Fig. 9.
Retinal OCT images of a volunteer. A. OCT image obtained from the right eye of a volunteer without adaptive ranging; B. OCT image with adaptive ranging, obtained from the same location (right eye of the same volunteer). Images are composed of 512 A-lines of 1024 pixels and cover a depth of 1 mm.
3.2 Measurement of the SNR improvement
For shot noise limited detection, the theoretical value of the SNR that can be achieved with time-domain OCT under the assumption of infinite linearity of the electronics and infinite dynamic range of the digitization electronics is given by [13]:
| (1) |
where, ηPs/2 h v describes the number of electrons per unit time generated by the photodetector due to the light returning from the sample, and 1/NEB is the time interval corresponding to the electronic band pass filter bandwidth. The full-width-half-maximum noise equivalent bandwidth (NEB) of the filter from the detection unit is chosen to match the source bandwidth and the Doppler frequency caused by the movement of the galvanometer mirror:
| (2) |
where Δλ is the full-width-half-maximum of the light source spectrum, λ0 is the center wavelength of the source, and fd is the Doppler frequency given by the movement of the galvanometer mirror in the reference arm of the interferometer. A larger scanning depth, over the same time interval, implies a higher fd , with a concomitant reduction of the SNR. For example, by doubling the imaging depth, SNR will decrease by about 3dB and will therefore substantially decrease the quality of the OCT image.
We have measured the SNR of our AR OCT system for both 3 mm and 1.5 mm single A-line scanning depths. A partial reflector was used as a sample. The partial reflector has been placed in the focal position of the sample arm of the interferometer. Neutral density filters were inserted in the way of signal in order to avoid detector saturation. The spectrum of the signal was measured in each case. For a 3 mm scanning range, the full with at the half maximum (FWHM) of the spectrum was 554 kHz, while for the 1.5 mm scanning depth the FWHM was 271 kHz. By replacing these values in Eq. 1, we can see that an increase in the SNR of 3.1 dB is expected for 1.5 mm scanning depth. The measured value was slightly smaller than the predicted one, 3.0 dB. The discrepancy between the measured and predicted values was may have been caused by an imperfect match between the band pass filter and the spectrum of the OCT signal.
3.3 Measurement of the AR response times
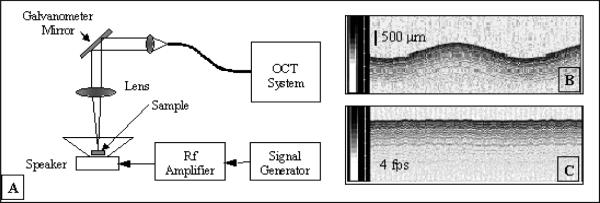
An important aspect of the performance of the adaptive-ranging system that determines its utility is the feedback control response time. Sudden lateral movement of a catheter inside a blood vessel or other lumen is a common situation that, if not tracked properly, can produce geometrical artifacts. We have measured the speed and the accuracy of the AR feedback using the instrumentation shown in Fig. 10(A). In this experiment, a highly scattering target (paper) glued on a speaker was imaged while the speaker was driven with a sinusoidal signal. OCT images with and without the AR turned on were acquired for different driving frequencies. Examples of OCT images with the AR turned “off” and with the AR turned “on” are shown in Figs. 10(B) and 10(C), respectively. For all frequencies, the driving voltage was adjusted so that the OCT image surface displacement magnitude with AR off was constant (1.5 mm). The effectiveness of AR as a function of surface velocity was evaluated by measuring the peak-to- peak displacement of the OCT image with remapping off. Fig. 11 depicts a plot of the peak-to-peak OCT image surface displacement rate with AR on versus the surface velocity with AR off, which is representative of the AR frequency response. At lower frequencies when AR was working completely, the surface of the speaker in the OCT image was flat. Due to the limited speed/bandwidth of the AR loop, distortions in the image occurred at higher frequencies. At the highest frequencies, AR did not affect the image output. For our setup, we found that AR was effective in correcting at least 50% of the surface displacement at a rate of up to 16 mm/s. The performance of AR could be significantly improved by increasing the processing power of our CPU or optimizing the speed of our surface detection algorithm.
Fig. 10.
A. Experimental setup for measurement of the AR performances; B. OCT image without AR; C. OCT image with the AR turned “on”. Gray scale bars in B and C represent OCT signal intensity.
Fig. 11.
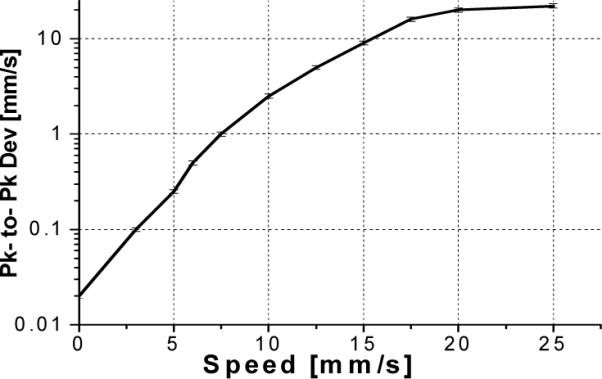
Peak-to-peak OCT image surface displacement rate with AR on versus the surface velocity with AR off.
4. Conclusions and discussion
In this paper, a simple method for adaptively correcting for tissue height variations in optical coherence tomography imaging has been presented. The imaging range has been expanded by a factor of 2.3, from 3 mm to 7 mm. This method has the advantages that it can be implemented with minimal modifications to existing hardware and performs in real-time. A 3.0 dB increase in the SNR was obtained by reducing the scanning depth from 3 mm to 1.5 mm. Measurements on cadaver arterial segments have demonstrated that adaptive ranging enables screening of large size arteries. Therefore, adaptive ranging would greatly enhance visualization of many clinically relevant sites. One limitation of this method is its inability to provide a very high lateral resolution in the case where dynamic focusing [22-24] cannot be very easily implemented due to limited space reasons. When the dynamic focusing is not possible, a compromise should be made between the lateral resolution and confocal parameter. Our results show that a reasonable good lateral resolution on tissue can be obtained for 7 mm imaging depth using a catheter that provides 35 μm lateral resolution in air.
Acknowledgments
This research is supported in part by the Center for Integration of Medicine and Innovative Technologies (development of the imaging system), the Whitaker Foundation, NIH R01 HL076398, and R24 EY 12877. We also gratefully thank David Freihofer, Michael Thanos and Alex Altshuler at Cambridge Technologies, Inc., for developing the high performance galvanometer system used in our OCT system.
Footnotes
OCIS codes: (110.4500) Optical coherence tomography; (170.4500) Optical coherence tomography; (170.3880) Medical and biological imaging
References and links
- 1.Huang D, Swanson EA, Lin CP, Schuman JS, Stinson WG, Chang W, Hee MR, Flotte T, Gregory K, Puliafito CA, Fujimoto JG. Optical coherence tomography. Science. 1991;254:1178–1181. doi: 10.1126/science.1957169. [DOI] [PMC free article] [PubMed] [Google Scholar]
- 2.Strom C, Sander B, Larsen N, Larsen M, Lund-Andersen H. Diabetic macular edema assessed with optical coherence tomography and stereo fundus photography. Invest. Ophthalmol. Vis. Sci. 2002;43:241–245. [PubMed] [Google Scholar]
- 3.Coppe AM, Ripandelli G. Optical coherence tomography in the evaluation of vitreoretinal disorders of the macula in highly myopic eyes. Semin. Ophthalmol. 2003;2:85–88. doi: 10.1076/soph.18.2.85.15857. [DOI] [PubMed] [Google Scholar]
- 4.Swanson EA, et al. In vivo retinal imaging by optical coherence tomography. Opt. Lett. 1993;18:1864–1866. doi: 10.1364/ol.18.001864. [DOI] [PubMed] [Google Scholar]
- 5.Schmitt JM, Yadlowsky MJ, Bonner RF. Subsurface imaging of living skin with optical coherence microscopy. Dermatology. 1995;191:93–98. doi: 10.1159/000246523. [DOI] [PubMed] [Google Scholar]
- 6.Bouma BE, Tearney GJ, Compton CC, Nishioka NS. High-resolution imaging of the human esophagus and stomach in vivo using optical coherence tomography. Gastrointest. Endosc. 2000;51:464–474. doi: 10.1016/s0016-5107(00)70449-4. [DOI] [PubMed] [Google Scholar]
- 7.Tearney GJ, Brezinsky ME, Bopart SA, et al. Images in cardiovascular medicine: catheter based optical imaging of a human coronary artery. Circulation. 1996;94:3013. doi: 10.1161/01.cir.94.11.3013. [DOI] [PubMed] [Google Scholar]
- 8.Pitris C, Goodman A, Bopart SA, Libus JJ, Fujimoto JG, Brezinski ME. High-resolution imaging of gynecologic neoplasms using optical coherence tomography. Obstet. Gynecol. 1999;93:135–139. [PubMed] [Google Scholar]
- 9.Yabushita H, Bouma BE, Houser SL, Aretz HT, Jang IK, Schlendorf K, Kauffman CR, Shishkov M, Kang DH, Halpern EF, Tearney GJ. Characterization of human atherosclerosis by optical coherence tomography. Circulation. 2002;106:1640–1645. doi: 10.1161/01.cir.0000029927.92825.f6. [DOI] [PubMed] [Google Scholar]
- 10.Tearney GJ, Yabushita H, Houser SL, Aretz HT, Jang IK, Schlendorf K, Kauffman CR, Shishkov M, Halpern EF, Bouma BE. Quantification of macrophage content in atherosclerotic plaques by optical coherence tomography. Circulation. 2003;107:113–119. doi: 10.1161/01.cir.0000044384.41037.43. [DOI] [PubMed] [Google Scholar]
- 11.Poneros JM, Tearney GJ, Bouma BE, Lauwers GY, Nishioka NS. Digestive Disease Week. American Gastroenterological Association; San Francisco, CA: 2001. Diagnosis of dysplasia in Barrett's esophagus using optical coherence tomography; p. AB113. [Google Scholar]
- 12.Jang IK, Bouma BE, Kang DH, Park SJ, Park SW, Seung KB, Choi KB, Shishkov M, Schlendorf K, Pomerantsev E, Houser SL, Aretz HT, Tearney GJ. Visualization of coronary atherosclerotic plaques in patients using optical coherence tomography. Journal of the American College of Cardiology. 2002;39:604–609. doi: 10.1016/s0735-1097(01)01799-5. [DOI] [PubMed] [Google Scholar]
- 13.Fercher AF, Drexler W, Hitzenberger CK, Lasser T. Optical Coherence tomography-principles and applications. Rep. Progr. Phys. 2003;66:239–303. [Google Scholar]
- 14.Izatt JA, Kulkarni MD, Wang HW, Kobayashi K, Sivak MV., Jr. Optical coherence tomography and microscopy in gastrointestinal tissues, IEEE J. of Sel. Top. Quantum Electron. 1996;2:1017–1028. [Google Scholar]
- 15.Sivak MV, Jr., Kobayashi K, Izatt JA, Rollins AM, Ung-Runyawee R, Chak A, Wong RC, Isenberg GA, Willis J. High-resolution endoscopic imaging of the GI tract using optical coherence tomography. Gastrointestinal Endoscopy. 2000;51:474–479. doi: 10.1016/s0016-5107(00)70450-0. [DOI] [PubMed] [Google Scholar]
- 16.Kauppinen J, Partanen J. Fourier Transforms in Spectroscopy. Wiley-VCH; Mar, 2001. [Google Scholar]
- 17.Tearney GJ, Bouma BE, Fujimoto JG. High-speed phase- and group-delay scanning with a grating-based phase control delay line. Opt. Lett. 1997;22:1811–1813. doi: 10.1364/ol.22.001811. [DOI] [PubMed] [Google Scholar]
- 18.Bouma BE, Tearney GJ. Power efficient nonreciprocical interferometer and linear scanning fiber-optic catheter for optical coherence tomography. Opt. Lett. 1999;24:531–533. doi: 10.1364/ol.24.000531. [DOI] [PubMed] [Google Scholar]
- 19.Guerra OR, Janowitz WR, Agatston AS, Mantelle LL, Viamonte M., Jr. Coronary artery diameter and coronary risk factors: a study with ultrafast computed tomography. Am. Heart J. 1993;126:600–606. doi: 10.1016/0002-8703(93)90410-b. [DOI] [PubMed] [Google Scholar]
- 20.Cense B, Chen TC, Park BH, Pierce MC, de Boer JF. In vivo birefringence and thickness measurements of the human retinal nerve fiber layer using polarization-sensitive optical coherence tomography. J. Biomed. Opt. 2004;9:121–125. doi: 10.1117/1.1627774. [DOI] [PubMed] [Google Scholar]
- 21.Park BH, Pierce MC, Cense B, de Boer JF. Real-time multi-functional optical coherence tomography. Opt. Express. 2003;11:782–93. doi: 10.1364/oe.11.000782. [DOI] [PubMed] [Google Scholar]
- 22.Schmitt JM, Lee SL, Yung KM. An optical coherence microscope with enhanced power in thick tissue. Opt. Commun. 1997;142:203–207. [Google Scholar]
- 23.Lexer F, Hitzenberger CK, Drexler W, Molebny S, Sattmann H, Sticker M, Fercher AF. Dynamic coherent focus OCT with depth-independent transversal resolution. J. Mod. Opt. 1999;46(3):541–553. [Google Scholar]
- 24.Qi B, Himmer AP, Gordon LM, Yang XDV, Dickensheets LD, Vitkin IA. Dynamic focus control in a high-speed optical coherence tomography based on a micromechanical mirror. Opt. Commun. 2004;232:123–128. [Google Scholar]


